
A Questionnaire for Collecting Data Relevant to UX Experimental Design
Luka Rukoni
´
c
a
, Pierre Fastrez
b
and Suzanne Kieffer
c
Institute for Language and Communication, Universit
´
e Catholique de Louvain, Louvain-la-Neuve, Belgium
Keywords:
User Experience, UX Experimental Design, UX Evaluation, Cues, User Scenarios.
Abstract:
This paper presents the set of experimental cues involved in the UX experiments that define the characteristics
of signals, objects, individuals and prototypes in the lab setting. The contribution of this paper is threefold.
First, methodological, as the method employed for creating the questionnaire is reproducible in other domain-
applications. Second, practical, as the questionnaire itself can serve as a tool for capturing the experimental
cues relevant to the UX evaluation of similar applications. Third, conceptual, as this paper renders a first
account of how the questionnaire-collected data can inform other activities ranging from the selection of eval-
uation methods to the specification of independent variables, UX measures, experimental tasks and apparatus.
1 INTRODUCTION
The development of interactive systems requires User
Experience (UX) evaluations with representative end-
users, which is an integral part of User-Centered De-
sign (UCD) (ISO, 2010). Typically, UX methods are
integrated into the product development lifecycle as
a way to follow UCD principles. Within a forma-
tive approach, they aim at improving existing design
solutions, while within a summative approach, UX
evaluations aim at checking whether design solutions
meet UX requirements. Also, UX evaluations have
a strong impact at the User Interface (UI) level as
they always or almost always lead to new or updated
User Interfaces (UIs), UX requirements and use cases
(Alves et al., 2014). In turn, UX evaluations help to
validate design decisions, inform further product de-
velopment, and achieve UX goals. Because UX is
subjective and context-dependent (Law et al., 2009),
experimenters need to achieve representative experi-
mental design to allow the generalization of results.
It requires capturing the relevant aspects of the real
world in order to engage participants in performing
the experimental task as they would have for real (Ki-
effer, 2017). Specifically, experimental designs need
to capture both the physical and the digital space of
the users, as both spaces are intertwined in the user’s
experience. The physical space refers to the signals,
artifacts and objects typically present in the surround-
a
https://orcid.org/0000-0003-1058-0689
b
https://orcid.org/0000-0001-7465-4363
c
https://orcid.org/0000-0002-5519-8814
ing of the users, while the digital space refers to the
product prototype under investigation. Although nec-
essary for the success of UX evaluations, capturing
these data is a complex UX activity, especially in
the early stages of the product development lifecycle
when the context of use analysis is still underway.
We experienced difficulties capturing these data
in an ongoing project involving five other partners
and aiming at developing a voice interface for au-
tonomous cars. In this project, we are in charge
of the integration of UX into the software develop-
ment model, an ”ad-hoc SCRUM” which combines
waterfall and agile methodologies. Previous Human-
Computer Interaction (HCI) research (Mayhew, 1999;
Maguire, 2001) and UX agile research (Brhel et al.,
2015; Garcia et al., 2017) both recommend conduct-
ing user requirements analysis or small upfront anal-
ysis to extend knowledge about the context of use
and user needs before any other development activ-
ity. However, conducting such analysis contradicts
the agile principle of ”changing requirements, even
late in development” advocated in the agile mani-
festo (Beck et al., 2001). Due to the conflicting per-
spective about user requirements analysis, we had to
shrink the analysis process and proceed with design
and evaluation processes to align with the agile de-
velopment team. Although from our perspective it
felt like putting the cart before the horse, we had
to provide the consortium with experimental designs
for UX evaluation without the necessary knowledge
about the context of use, that being users, tasks, plat-
forms and environments (Alonso-R
´
ıos et al., 2010).
128
Rukoni
´
c, L., Fastrez, P. and Kieffer, S.
A Questionnaire for Collecting Data Relevant to UX Experimental Design.
DOI: 10.5220/0008164001280136
In Proceedings of the 3rd International Conference on Computer-Human Interaction Research and Applications (CHIRA 2019), pages 128-136
ISBN: 978-989-758-376-6
Copyright
c
2019 by SCITEPRESS – Science and Technology Publications, Lda. All rights reserved

This paper reports preliminary findings of using
survey research to collect the data relevant for popu-
lating the experimental design of the first UX evalua-
tion in our project. We present a questionnaire sup-
porting such data collection, and how we used the
collected answers to design the first experiment. In
particular, the collected answers allowed us to specify
the first instance of our evaluation plan: a selection
of the UX evaluation method, specification of inde-
pendent variables, experimental tasks, scenarios and
apparatus.
2 BACKGROUND
2.1 Selecting UX Evaluation Methods
The HCI community has been interested in develop-
ing methods supporting UX evaluation (Vermeeren
et al., 2010), in building theoretical frameworks to de-
fine UX measures (Hassenzahl and Tractinsky, 2006;
Law et al., 2009, 2014; Lachner et al., 2016; Zarour
and Alharbi, 2017) and developing methodologies
for its integration into software development models
(Kashfi et al., 2014; Peres et al., 2014). UX evalua-
tion method selection depends on the type of collected
data, location of use and phase of development, al-
lowing practitioners to select the most appropriate UX
method based on their needs (Vermeeren et al., 2010).
However, the current state of UX evaluation. still re-
lies on self-defined questionnaires and post-use evalu-
ation, demonstrating a weak connection between the-
ory and evaluation (Pettersson et al., 2018). Finally,
the specification of the experimental tasks involved in
UX evaluations remains a choice of the experimenter.
2.2 Conducting Empirical UX Research
The way empirical UX research is conducted is rarely
discussed in the HCI literature. The relevant literature
on this topic reports that studies either overgeneral-
ize their findings or overemphasize their methodolog-
ical stance. Regarding the former, while close atten-
tion should be paid to experimental design, empirical
research in HCI suffers from cause-effect issues and
generalization issues (Gray and Salzman, 1998). Re-
garding the latter, some studies overemphasize their
methodological stance to the extent of damaging re-
search quality. Many uniqueness papers do not report
interview questions or protocols, rarely describe data
analysis methods, focus mostly on generic UX, and
contribute to the dimensionality explosion (Bargas-
avila and Hornbæk, 2011)).
2.3 Designing UX experiments
Designing UX experiments require to control the in-
dependent variables to achieve validity of experimen-
tal designs. In the context of UX research, such con-
trol requires to identify and manipulate the visual,
sound and haptic cues that are involved in the exper-
imental design. These cues include the characteris-
tics of the prototypes, signals, objects or individuals
that should be available to participants. Therefore, to
design UX experiments, researchers need to acquire
sufficient knowledge about user goals, needs and lim-
itations, user tasks, platforms used to perform these
tasks, and the physical, socio-cultural and organiza-
tional environments of users. The relevant literature
recommends using UX methods such as surveys, in-
terviews and observations (Maguire, 2001; Law et al.,
2009; Vermeeren et al., 2010; Bargas-avila and Horn-
bæk, 2011; Law et al., 2014).
In turn, how to properly design UX experiments
seems to be rarely discussed in the HCI literature and
relies on the skills and preferences of UX practition-
ers and researchers. Previous work (Kieffer, 2017)
recommends a seven-step procedure to design UX ex-
periments consisting of task analysis, setting the study
goals and metrics, identification of cues, setting the
experimental design and assessing its feasibility, as-
sessment of experimental validity and finally conduct-
ing the experiment itself and reporting on findings.
The term ”cues” refers to traits present in the con-
text of use that users perceive, evaluate and interpret
in order to act, react and make decisions (Brunswik,
1956; Araujo et al., 2007; Kieffer, 2017). For exam-
ple, ice is a visual cue that may indicate slippery road-
way risk; beeps are sound cues that may indicate ob-
stacles; steering wheel vibrations are haptic cues that
may indicate an unintentional lane change. In the con-
text of UX evaluations, cues refer to any characteris-
tic of the prototypes, signals, objects or individuals
available to the participants in the experimental set-
ting. Participants exploit the perceived traits of these
cues to understand how to interact with the product
prototype, learn its state and how to respond to it.
3 CONTRIBUTION
Because of conflicting perspectives within the consor-
tium about analysis, we were unable to conduct user
requirements analysis. Instead, we organized three
half-day workshops to specify user scenarios. These
workshops were intended for refining the use cases
that were written nine months earlier during the writ-
ing of our project proposal and for sharing a com-
A Questionnaire for Collecting Data Relevant to UX Experimental Design
129

mon big picture of the project goals. However, the
project coordinator decided not to proceed with these
small upfront analysis activities, as they wanted to
move towards development immediately in order to
deliver something faster. Paradoxically, the consor-
tium wanted us to design UX experiments, which was
impossible because we did not have any information
about user needs or goals with the system, what to
evaluate or for which purposes.
To work around these issues, we decided to col-
lect the information missing to write relevant experi-
mental scenarios by administrating an online prospec-
tive questionnaire about the experimental cues to in-
volve in the UX experiment. The questionnaire is
intended for the audience of stakeholders, including
product owners, project coordinators and developers.
It also serves as a tool for the requirements elicitation
from stakeholders as they are the source of informa-
tion about what scenarios need to be tested when re-
quirements analysis is not done. The contribution of
this paper is threefold:
1. Methodological, as the method employed for cre-
ating the questionnaire is reproducible in other
domain-applications
2. Practical, as the questionnaire itself can serve as a
tool for capturing the experimental cues relevant
to the UX evaluation of similar applications
3. Conceptual, as this paper renders a first account
of how the data collected with the questionnaire
can also inform other activities ranging from the
selection of evaluation methods to the specifica-
tion of independent variables and UX measures,
experimental tasks and apparatus.
4 METHOD FOR CREATING THE
QUESTIONNAIRE
The experimental cues to involved in the UX experi-
ment include the visual, sound and haptic characteris-
tics of the signals, objects, individuals and prototypes
available to subjects in the lab setting (Kieffer, 2017).
4.1 Signals and Objects
Signals refer to the stimuli present in the physical en-
vironment of the driver such as weather conditions,
lighting conditions and level of noise inside and out-
side the vehicle. Typically, these cues are used by
drivers to estimate the comfort and safety while driv-
ing, the current state of the vehicle or the situation on
the road. Objects such as traffic signals, buildings or
vegetation are cues that can be used by drivers to as-
sess the general and local driving conditions: indoor
versus outdoor, urban versus rural and the presence of
obstacles on the road.
To achieve the representative design and action fi-
delity (Stoffregen et al., 2003), the experimental de-
sign needs to capture these cues and reproduce them
in the lab. Examples of real signals and real objects to
be reproduced in the lab setting include noise of the
engine, honks, sirens, rain drops on the windshield,
daylight, traffic signals or obstacles on the road.
4.2 Individuals
This cue consists of a set of traits that describe the
social interaction between a driver and other individ-
uals or groups during the experiment such as talking
to other passengers in the car, accessing social net-
works, making phone calls and collaboration with the
traffic officers or other types of traffic regulation per-
sonnel. The social environment constitutes the pres-
ence of other people, collaboration and interaction
among them. In other words, the people with whom
the user interacts and who affect the user’s interaction
with the system (Alonso-R
´
ıos et al., 2010). In real-
ity, drivers often communicate with other people and
interact with various devices which all contribute to
the driver’s distraction from driving and the increase
of their cognitive load. Social, physical and technical
environments are the factors that directly influence the
usability, design and the use of the system (Maguire,
2001; Alonso-R
´
ıos et al., 2010). Depending on the
chosen evaluation method, the experimenter can take
the role of an observer, participant or a wizard (e.g.
in WOz), performing tasks such as recording users’
answers and behavior, taking notes, etc. The experi-
menter becomes a cue in case there is an interaction
happening between the experimenter and the user.
4.3 Prototype
A prototype is the representation of a computer sys-
tem, characterized by means of five dimensions: vi-
sual refinement, interactivity, data model and breadth
and width of functionality (Table 1) (McCurdy et al.,
2006). The level of fidelity varies across each dimen-
sion, supporting mixed-fidelity prototyping. Mixed-
fidelity prototyping allows for tailored prototypes to
meet specific goals of UX evaluations. For example,
the evaluation of the interaction with a prototype re-
quires a rich data model, but the level of visual refine-
ment can be kept low (McCurdy et al., 2006). The
level of fidelity of prototypes (low versus high) influ-
ences the outcomes of UX evaluations: differences in
CHIRA 2019 - 3rd International Conference on Computer-Human Interaction Research and Applications
130

Table 1: Independent variables related to the prototype.
Dimension Values
level of visual refinement low, medium, high
breadth of functionality completion (%)
depth of functionality completion (%)
level of interactivity low, medium, high
richness of data model low, medium, high
the nature of usability issues detected (Walker et al.,
2002) and differences in the feedback received from
participants (Sefelin et al., 2003). The experimenters
manually assess the fidelity of the prototype in each of
the five dimensions once the prototype is effectively
available.
4.4 Resulting Questionnaire
The questionnaire (Table 2) includes 12 items (Q1 to
Q12), each item reflecting one independent variable
relevant to inform the experimental design from sig-
nals, objects and individuals class of cues. Each ques-
tion starts with the words ”Please specify...”. Items
Q1-2 and Q6-9 are closed and multiple-choice ques-
tions, whereas items Q3-5 and Q10-12 are open ques-
tions. Items Q1-9 are mandatory. We have combined
the existing use cases and the description of classes of
cues to write the questions.
5 DATA COLLECTION
5.1 Questionnaire Administration
We administered the questionnaire to four industrial
partners out of five, which totals 19 potential re-
spondents. We excluded one academic partner from
the questionnaire administration, as their mission in
the project does not involve any design or develop-
ment activities. We collected the data from interdis-
ciplinary teams having different needs to develop the
final product as they work on the development of var-
ious components of the system.
In turn, we collected four survey answers, each
representing one partner. It is worth mentioning that
these answers represent combined multi-subject re-
sponses, as more than one person worked on de-
livering the answers to the questions. Therefore,
more than four persons participated in the survey, but
they delivered a unified response reflecting their com-
pany’s opinion on what kind of scenarios should be
tested according to the type of needs they have to suc-
cessfully develop the final product.
5.2 Results
The results combine quantitative and qualitative find-
ings (Table 3). All respondents indicated that various
weather conditions need to be included in the experi-
mental design. None selected the snowy and icy con-
ditions. Among respondents, daytime was the most
commonly selected part of the day, followed by night
and then dusk or dawn. All respondents answered
that the experimental design should involve outdoor
(e.g. parking lot or road) and urban setting (e.g. in a
city). Three respondents selected medium traffic den-
sity (i.e., some cars, fluid traffic), one selected low
traffic density (a few cars). Two respondents out of
four selected interactions through interactive systems.
Finally, all respondents answered that the experimen-
tal design should involve social interactions with pas-
sengers and no social interactions with individuals on
the road (e.g. traffic officers).
6 OUTCOMES
The collected data enabled us to select the UX eval-
uation method, write testable user scenarios and ex-
tract the task sequence models as part of UX evalua-
tion. Furthermore, the prototype fidelity and the in-
struments used are to be defined by the researchers
based on the selected UX evaluation method. For ex-
ample, it would depend on whether the prototype will
require developers to code some components or not,
the location of the evaluation or whether the users will
be involved (user or expert-based evaluation).
6.1 Selection of the UX Evaluation
Method
Given that we will be designing an in-car Voice User
Interface (VUI), we decided to use a Wizard of Oz
(WOz) technique. Using the classes of cues described
above, we designed a WOz experiment to simulate
the future system and evaluate the UX while using
it. Generally, WOz is used in the early design phase,
but it fits well into an iterative design process. In a
WOz experiment, ”wizards” simulate only a part, or
the whole system while users are interacting with it
without being aware that the system is not real (Dow
et al., 2005). Nevertheless, WOz experiments can
be relatively complex and challenging to implement.
The wizards analyze the user’s input, determine and
generate the output and simulate the behavior of the
system. This way the system can be evaluated before
it is developed and thus help derive requirements that
can then be safely implemented (Bernsen et al., 1993).
A Questionnaire for Collecting Data Relevant to UX Experimental Design
131

Table 2: Questionnaire (soc. interact. = social interaction).
Item Question: Please specify... Answer options
Q1 weather conditions sunny, clear, dry, cloudy, foggy, rainy, snow, icy, windy
Q2 lighting conditions day, night, dusk, dawn
Q3
time of the day or year
Q4
noises in the passenger compartment
Q5
exterior noises
Q6 general driving conditions indoor or outdoor
Q7
local driving conditions
urban or rural
Q8
potential obstacles on the road
pedestrians, bicycles, roadworks
Q9
traffic density
none, low, medium, high
Q10
soc. interact. through interactive systems
Q11
soc. interact. with passengers
Q12
soc. interact. with individuals on the road
Table 3: Results.
Item Collected data
Q1 good (sunny: 2; clear: 3; dry: 2), bad (cloudy: 3; foggy: 1; rainy: 2; snow: 0; icy: 0; windy: 2)
Q2 day: 4; night: 2; dusk: 1; dawn: 1
Q3 no specific time: 4
Q4 ambient noise: 3; engine noise: 1; passengers talking: 2; music: 3
Q5 traffic noise: 1; sirens: 1; engine noise: 1; tyres noise: 1
Q6 indoor: 0; outdoor: 4
Q7 urban: 3; rural: 1
Q8 a pedestrian crossing the road: 1; no obstacles: 1
Q9 none: 0; low: 1; medium: 3; high: 0
Q10 yes: 2; no: 2
Q11 yes: 4; no: 0
Q12 yes: 0; no: 4
The WOz technique has been extensively used in
automotive research because it allows for a certain
level of improvisation, flexibility, and identification of
possibilities of the future system. It has been used to
evaluate user expectations, speech-based in-car sys-
tems and use of gestures as input modalities in cars
(Mok et al., 2015; Lathrop et al., 2004). Furthermore,
WOz also served as design research and design pro-
totyping tool allowing researchers to perform remote
observation and interaction prototyping of driving in-
terfaces in a car in real time. This way, they could per-
form contextual interviews with the drivers as well as
discover implications for the design of car interfaces
(Martelaro and Ju, 2017).
6.2 Generating Scenarios
From the collected questionnaire data, we constructed
several testable user scenarios that depict the interac-
tion between the driver and the VUI of an autonomous
car. The selection of variables to be included in the
experiment is based on their frequency of occurrence
in the set of answers. The procedure is as follows:
1. Select the most frequently chosen variables
2. Check for the consistency among variables so that
there are no conflicts between them (e.g. sunny
and rainy at the same time; day and night; indoor
and outdoor)
3. In case of inconsistencies, decide which one will
be selected
4. Classify variables into classes of cues
5. Assign them selected values
6. Write a scenario containing the selected variables
7. Create a task sequence model(s)
8. Decide on the prototype characteristics (Table 1)
Following this procedure, researchers can gener-
ate several scenarios by either selecting the indepen-
dent variables based on their frequency of occurrence
or by looking at the available data and combining
them to come up with a scenario that satisfies the UX
evaluation needs. For example, if the goal is to eval-
uate the system in rainy and dark conditions, then the
CHIRA 2019 - 3rd International Conference on Computer-Human Interaction Research and Applications
132

Table 4: Independent variables for the User Scenario 1.
Class of cues Independent variable Value
Signals
weather
lighting
noise
sunny
day
radio on and ambient noise
Objects
general driving conditions
local driving conditions
outdoor
urban
Individuals
social interaction
experimenter(s)
yes
no
Prototype
level of visual refinement
breadth and depth of functionality
level of interactivity
richness of data model
medium
low
high
medium
weather variable will be set to “rainy” and the lighting
variable to “night”.
Previous research used scenarios to represent real-
world situations, describe the study design and condi-
tions drivers face on the road. Manawadu et al. (2015)
analyzed the driving experience of autonomous and
conventional driving using the driving simulator in
urban, rural, expressway and parking areas. Scenar-
ios enabled the identification of whether drivers pre-
fer autonomous or conventional driving, depending
on the situation and events occurring while driving in
different areas. R
¨
odel et al. (2014) used user scenar-
ios to describe the driving situations that correspond
to each of the five levels of vehicle autonomy and in-
vestigated the relationship between the degree of au-
tonomy and user acceptance and UX factors. Frison
et al. (2019) evaluated the influence of road type and
traffic volume in different scenarios on the fulfillment
of psychological needs during fully automated driving
using a simulator and showed that automated driving
increases a lack of trust, lowers stimulation and makes
drivers want to intervene in driving tasks .
In this paper, we present the ”first available spot
scenario” and its corresponding task sequence model.
It depicts the situation where the driver wants to park
the car at any available parking spot on the cur-
rent route while approaching driver’s final destina-
tion. Additionally, we defined two more scenarios de-
scribing a predefined outcome where the driver can
set preferences related to the type of parking place
(accessibility, space, distance, etc.), and the collab-
orative scenario where the driver and the car work
together to find a parking place and exchange infor-
mation meanwhile. We did not include them in this
paper, but we derived them using the previously de-
scribed procedure. All scenarios are related to a semi-
automated parking use case.
6.2.1 Scenario 1 - First Available Spot
Alicia is being driven in the autonomous mode. It is a
clear and sunny day and she feels like taking a walk.
The radio in the car is on. She tells the car to park few
blocks away from her apartment. The traffic density
is low. The car confirms that the parking search pro-
cess has started. Alicia wants to meet Bob for coffee
in an hour and instructs the car to text him. Eventu-
ally, the car has found a parking place but she refuses
it. Next, Alicia spots an empty parking place she likes
and tells the car to park there. Car confirms that the
message has been sent and notifies Alicia to wait for
the road to be cleared of passing cars before starting
a parking maneuver. Then, Alicia takes over the con-
trol of car pedals and with the car’s help the parking
process finishes. Finally, she leaves the car.
Independent Variables. The independent variables
related to the experimental cues of the user scenario
1 are presented in Table 4. These are the values that
have to be set to each of the cues involved in the UX
experiment and simulated in the lab.
Task Sequence Model. The user scenario was
translated into a task sequence model, to enable the
identification of user steps, possible errors and break-
downs, as well as triggers and intents that initiate user
tasks. This way, we will be able to identify when will
the wizard interact with the user (wizard’s ”hooks”),
and when will the response be sent to the user. More-
over, we will be able to compare if the users follow or
deviate from the task sequence. The user tasks sup-
ported in the experiment are presented in Table 5. The
task sequence model for Scenario 1 is shown in Figure
1.
The WOz will help us collect speech data and an-
alyze users’ utterances to identify intents and entities
used in their dialog. Previous research shows that
A Questionnaire for Collecting Data Relevant to UX Experimental Design
133
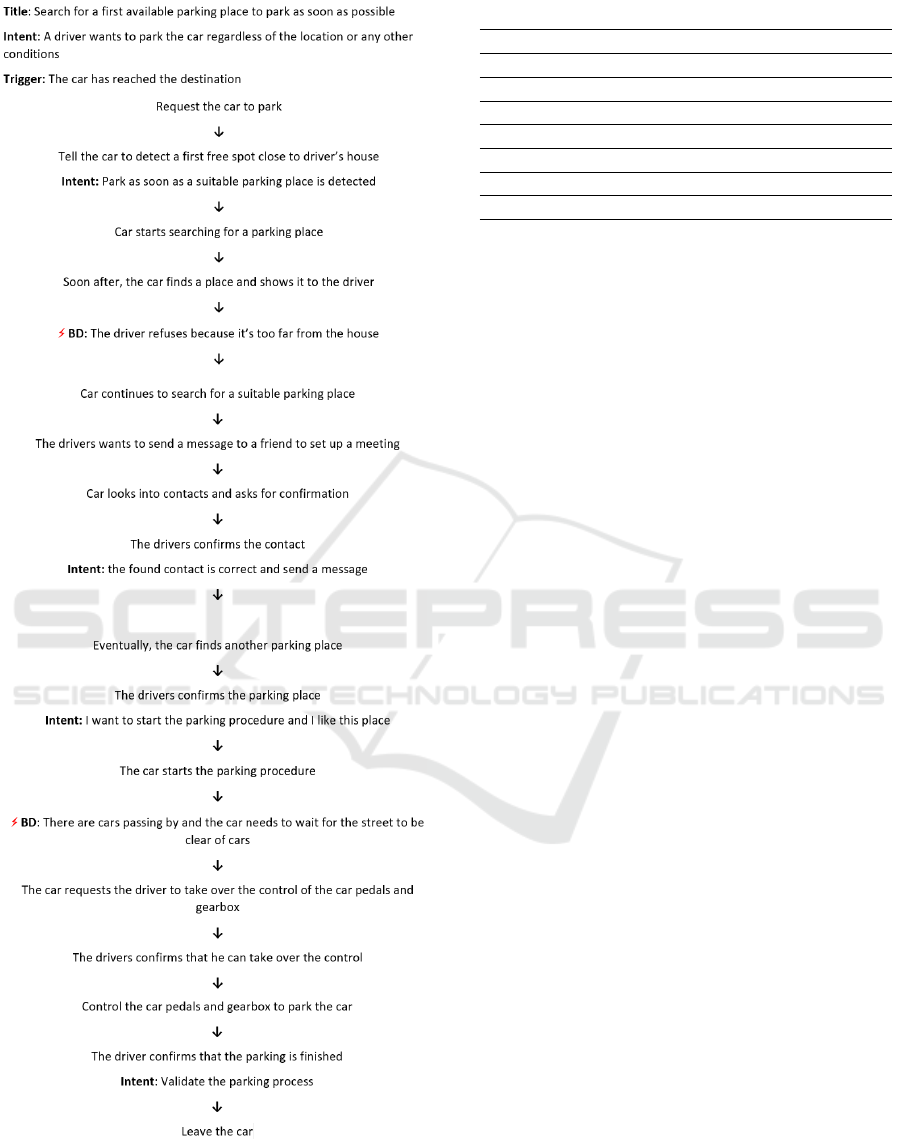
Figure 1: Task sequence model for the User Scenario 1.
user utterances vary depending on the driving con-
text and currently performed tasks. For example, ut-
terances spoken while stopped at a traffic light might
Table 5: List of user tasks supported in the experiment.
ID Task name
T1 Request the car to park
T2 Confirm or deny the parking place
T3 Control the car manually (pedals, gearbox)
T4 Show the car a particular parking place
T5 Specify the parking conditions
T6 Make phone calls/send texts
T7 Control the radio/entertainment system
be more complex than the ones spoken while driving
at a curvy road (Lathrop et al., 2004). These intents
and entities will feed directly into the design and de-
velopment of the conversational agent to build dia-
log flows. Also, WOz will help us evaluate the future
system in the early development phase, identify addi-
tional user tasks, assess the UA of a voice-controlled
autonomous car and evaluate the UX with it.
6.3 UX Measures and Instruments
For the UX measurements to be valid and reliable,
they need to be collected from a sample of real users,
carrying out real tasks in a realistic context of use.
However, measuring UX directly and holistically is
not possible (Bevan, 2008; Law et al., 2014). Mea-
suring UX seems to be a difficult task that depends
on the type of tasks, their timing, methods used, type
of information that is collected, etc Law et al. (2014).
Clearly, UX measures should provide arguments and
implications for the redesign of the evaluated system.
Instruments are the tools used for data collec-
tion during UX evaluation. We aim to capture mo-
mentary experiences to understand what triggers spe-
cific emotions or physiological reactions. The Fac-
eReader enables the real-time measurement of users’
emotions which are happiness, anger, disgust, sad-
ness, confusion, fear and neutral state to study UX
of single episodes (Vermeeren et al., 2010; Zaman
and Shrimpton-Smith, 2006). Thus, the FaceReader
will enable us to link user’s emotions to actions, ut-
terances or tasks being performed at a specific mo-
ment. Finally, we will use the standard questionnaires
to collect self-reported data such as task-load and he-
donic and pragmatic qualities, the NASA-TLX and
AttrakDiff respectively. These data will help us de-
rive requirements that can be safely implemented and
that comply with the user’s needs.
CHIRA 2019 - 3rd International Conference on Computer-Human Interaction Research and Applications
134

7 LESSONS LEARNED
Using the data collected with the questionnaire, we
produced multiple user scenarios and their task se-
quence models, but we presented only one. The
questionnaire served as a requirements elicitation tool
to design the experiment and identify experimental
tasks. We realize that the procedure to create scenar-
ios is not deterministic and can yield different scenar-
ios depending on the preferences of the experimenter.
However, researchers can generate a set of scenar-
ios following our procedure and choose those that are
most valuable for development. Therefore, the exper-
imenter can, depending on the goals of the evaluation,
make deliberate choices to study how each cue affects
the UX. The UX evaluations need to resemble the real
users, real tasks and real environment to increase the
ecological validity and obtain representative findings.
We deliberately made the questionnaire specific to the
project in the automotive sector for the purpose of this
case study. Nevertheless, the methodology to create
the questionnaire can be replicated to other domain-
applications by adapting the questions to a specific
domain because the cues are generalizable.
8 CONCLUSION
This paper presents the set of experimental cues in-
volved in the UX experiments that define the char-
acteristics of signals, objects, individuals and proto-
types in the lab setting. We used these cues as a
methodological basis to construct the questionnaire
where each class of cues represents a set of variables.
We used this questionnaire to collect the data to form
the UX experimental design, create the experimen-
tal tasks, select the UX evaluation method and UX
measures. The questionnaire served as a tool to work
around the missing requirements analysis and helped
us to keep up with the development team. The cues
represent the independent variables of the experiment
which the researchers can use to generate testing sce-
narios and study how their manipulation affects the
results of the UX evaluation. We plan to reuse the
questionnaire whenever we need to define the exper-
imental tasks for the UX evaluation to enhance the
communication between UX and development teams
and understand what types of scenarios need to be
tested to properly inform the system’s design. Also,
the questionnaire allowed us to quickly collect the
data necessary to create the UX evaluation plan that
we could present to the agile team and align with the
development process.
ACKNOWLEDGEMENTS
The authors acknowledge the support by the project
VIADUCT under the reference 7982 funded by Ser-
vice Public de Wallonie (SPW), Belgium.
REFERENCES
Alonso-R
´
ıos, D., V
´
azquez-Garc
´
ıa, A., Mosqueira-Rey, E.,
and Moret-Bonillo, V. (2010). A context-of-use tax-
onomy for usability studies. International Journal of
Human-Computer Interaction, 26(10):941–970.
Alves, R., Valente, P., and Nunes, N. J. (2014). The state of
user experience evaluation practice. In Proceedings of
the 8th Nordic Conference on Human-Computer Inter-
action: Fun, Fast, Foundational, NordiCHI ’14, pages
93–102, New York, NY, USA. ACM.
Araujo, D., Davids, K., and Passos, P. (2007). Ecolog-
ical validity, representative design, and correspon-
dence between experimental task constraints and be-
havioral setting: Comment on Rogers, Kadar, and
Costall (2005). Ecological Psychology, 19(1):69–78.
Bargas-avila, J. A. and Hornbæk, K. (2011). Old Wine in
New Bottles or Novel Challenges? A Critical Analy-
sis of Empirical Studies of User Experience. Proceed-
ings of the SIGCHI Conference on Human Factors in
Computing Systems, pages 2689–2698.
Beck, K., Beedle, M., Van Bennekum, A., Cock-
burn, A., Cunningham, W., Fowler, M., Grenning,
J., Highsmith, J., Hunt, A., Jeffries, R., et al.
(2001). Manifesto for agile software development.
http://www.agilemanifesto.org/. 2019-04-26.
Bernsen, N. O., Dybkjær, H., and Dybkjær, L. (1993). Wiz-
ard of Oz prototyping: How and when. In CCI Work-
ing Papers in Cognitive Science and HCI.
Bevan, N. (2008). Classifying and selecting UX and usabil-
ity measures. In International Workshop on Meaning-
ful Measures: Valid Useful User Experience Measure-
ment, volume 11, pages 13–18.
Brhel, M., Meth, H., Maedche, A., and Werder, K. (2015).
Exploring Principles of User-Centered Agile Software
Development: A Literature Review. Information and
Software Technology, 61:163–181.
Brunswik, E. (1956). Perception and the representative de-
sign of psychological experiments. Univ of California
Press.
Dow, S., MacIntyre, B., Lee, J., Oezbek, C., Bolter, J. D.,
and Gandy, M. (2005). Wizard of Oz support through-
out an iterative design process. IEEE Pervasive Com-
puting, 4(4):18–26.
Frison, A.-K., Wintersberger, P., Liu, T., and Riener, A.
(2019). Why do you like to drive automated?: A
context-dependent analysis of highly automated driv-
ing to elaborate requirements for intelligent user inter-
faces. In Proceedings of the 24th International Con-
ference on Intelligent User Interfaces, IUI ’19, pages
528–537, New York, NY, USA. ACM.
Garcia, A., Silva da Silva, T., and Selbach Silveira, M.
(2017). Artifacts for Agile User-Centered Design:
A Questionnaire for Collecting Data Relevant to UX Experimental Design
135

A Systematic Mapping. Proceedings of the Annual
Hawaii International Conference on System Sciences,
pages 5859–5868.
Gray, W. D. and Salzman, M. C. (1998). Damaged mer-
chandise? A review of experiments that compare us-
ability evaluation methods. Human-computer interac-
tion, 13(3):203–261.
Hassenzahl, M. and Tractinsky, N. (2006). User experience-
a research agenda. Behaviour & information technol-
ogy, 25(2):91–97.
ISO (2010). Ergonomics of human system interaction-Part
210: Human-centred design for interactive systems.
Standard, International Organization for Standardiza-
tion, Geneva, Switzerland.
Kashfi, P., Feldt, R., Nilsson, A., and Svensson, R. B.
(2014). Models for integrating UX into software en-
gineering practice: an industrial validation. Software
Engineering.
Kieffer, S. (2017). ECOVAL: Ecological Validity of Cues
and Representative Design in User Experience Evalu-
ations. AIS Transactions on Human-Computer Inter-
action, 9(2):149–172.
Lachner, F., Naegelein, P., Kowalski, R., Spann, M., and
Butz, A. (2016). Quantified UX: Towards a Com-
mon Organizational Understanding of User Experi-
ence. Proceedings of the 9th Nordic Conference on
Human-Computer Interaction - NordiCHI ’16, pages
1–10.
Lathrop, B., Cheng, H., Weng, F., Mishra, R., Chen, J.,
Bratt, H., Cavedon, L., Bergmann, C., Hand-Bender,
T., Pon-Barry, H., et al. (2004). A wizard of oz frame-
work for collecting spoken human-computer dialogs:
An experiment procedure for the design and testing
of natural language in-vehicle technology systems. In
Proc. ITS.
Law, E. L. C., Roto, V., Hassenzahl, M., Vermeeren, A. P.
O. S., and Kort, J. (2009). Understanding, Scoping
and Defining User Experience: A Survey Approach.
CHI 2009, 23(1):23–32.
Law, E. L. C., Van Schaik, P., and Roto, V. (2014). At-
titudes towards user experience (UX) measurement.
International Journal of Human Computer Studies,
72(6):526–541.
Maguire, M. (2001). Context of use within usability activi-
ties. International Journal of Human-Computer Stud-
ies, 55(4):453–483.
Manawadu, U., Ishikawa, M., Kamezaki, M., and Sugano,
S. (2015). Analysis of individual driving experience in
autonomous and human-driven vehicles using a driv-
ing simulator. In 2015 IEEE International Conference
on Advanced Intelligent Mechatronics (AIM), pages
299–304. IEEE.
Martelaro, N. and Ju, W. (2017). WoZ Way: Enabling Real-
Time Remote Interaction Prototyping & Observation
in On-Road Vehicles. Accepted: Proceedings of the
20th ACM Conference on Computer-Supported Coop-
erative Work & Social Computing, pages 169–182.
Mayhew, D. J. (1999). The usability engineering lifecycle:
a practitioner’s handbook for user interface design.
Morgan Kaufmann.
McCurdy, M., Connors, C., Pyrzak, G., Kanefsky, B., and
Vera, A. (2006). Breaking the Fidelity Barrier - An
Examination of our Current Characterization of Pro-
totypes and an Example of a Mixed-Fidelity Success.
Proceedings of the International Conference on Hu-
man Factors in Computing Systems (CHI’06), pages
1233–1242.
Mok, B. K.-J., Sirkin, D., Sibi, S., Miller, D. B., and Ju,
W. (2015). Understanding Driver-Automated Vehi-
cle Interactions Through Wizard of Oz Design Impro-
visation. Proceedings of the 8th International Driv-
ing Symposium on Human Factors in Driver Assess-
ment, Training, and Vehicle Design: driving assess-
ment 2015, pages 380–386.
Peres, A. L., Silva, T. S. D., Silva, F. S., Soares, F. F., Car-
valho, C. R. M. D., and Meira, S. R. D. L. (2014).
Agileux model: Towards a reference model on inte-
grating ux in developing software using agile method-
ologies. In Proceedings of the 2014 Agile Conference,
AGILE ’14, pages 61–63, Washington, DC, USA.
IEEE Computer Society.
Pettersson, I., Lachner, F., Frison, A.-K., Riener, A., and
Butz, A. (2018). A Bermuda Triangle?: A Review
of Method Application and Triangulation in User Ex-
perience Evaluation. In Proceedings of the 2018 CHI
Conference on Human Factors in Computing Systems,
CHI ’18, New York, NY, USA. ACM.
R
¨
odel, C., Stadler, S., Meschtscherjakov, A., and Tscheligi,
M. (2014). Towards autonomous cars: The effect of
autonomy levels on acceptance and user experience.
In Proceedings of the 6th International Conference
on Automotive User Interfaces and Interactive Vehic-
ular Applications, AutomotiveUI ’14, pages 1–8, New
York, NY, USA. ACM.
Sefelin, R., Tscheligi, M., and Giller, V. (2003). Paper pro-
totyping - what is it good for? CHI ’03 extended ab-
stracts on Human factors in computing systems - CHI
’03, page 778.
Stoffregen, T. A., Bardy, B. G., Smart, L. J., and Pagulayan,
R. J. (2003). On the nature and evaluation of fidelity in
virtual environments: Applications, Implications, and
Human Performance, pages 111–128. Lawrence Erl-
baum Associates, Inc.
Vermeeren, A. P. O. S., Law, E. L.-C., Roto, V., Obrist,
M., Hoonhout, J., and V
¨
a
¨
an
¨
anen-Vainio-Mattila, K.
(2010). User experience evaluation methods: Cur-
rent state and development needs. In Proceedings of
the 6th Nordic Conference on Human-Computer Inter-
action: Extending Boundaries, NordiCHI ’10, pages
521–530, New York, NY, USA. ACM.
Walker, M., Takayama, L., and Landay, J. A. (2002). High-
Fidelity or Low-Fidelity, Paper or Computer? Choos-
ing Attributes when Testing Web Prototypes. Proceed-
ings of the Human Factors and Ergonomics Society
Annual Meeting, 46(5):661–665.
Zaman, B. and Shrimpton-Smith, T. (2006). The facereader:
Measuring instant fun of use. In Proceedings of the
4th Nordic conference on Human-computer interac-
tion: changing roles, pages 457–460. ACM.
Zarour, M. and Alharbi, M. (2017). User experience frame-
work that combines aspects , dimensions , and mea-
surement methods. Cogent Engineering, 4(1):1–25.
CHIRA 2019 - 3rd International Conference on Computer-Human Interaction Research and Applications
136
