
Which EEG Electrodes Should Be Considered for Alertness
Assessment?
Agnieszka Wolska
1a
, Dariusz Sawicki
2b
, Marcin Kołodziej
2c
, Mariusz Wisełka
1d
and
Kamila Nowak
1
1
Central Institute for Labour Protection - National Research Institute (CIOP-PIB), Warsaw, Poland
2
Warsaw University of Technology, Institute of Theory of Electrical Engineering,
Measurements and Information Systems, Warsaw, Poland
Keywords: EEG, Alertness, Exposure to Light, Alpha and Beta Ranges, Electrodes Selection for Analysis.
Abstract: The analysis of EEG signal is one of the objective methods used in alertness assessment. Many publications
confirm the correct assessment of alertness level based on the analysis of selected brain waves. EEG
registration is a difficult task; one of the important problems is the necessity to choose which EEG electrode
to download the signal for analysis. The authors use different electrodes, often without justifying the choice.
Equally often, the only justification is to say that the analyzed signal was the strongest among those available,
or the least contaminated with artifacts. The aim of the article is to try to answer the question: signals which
electrodes (channels) should be included in the alertness assessment. 33 participants took part in the
experiment. Blue and red light was used to stimulate alertness. The impact of such light is documented in
many publications. Alertness changes due to specific color of light were evaluated – the changes of alpha and
beta bands were analyzed. Statistical analysis has shown that for alertness assessment the following electrodes
should be considered: C3 and FC1 for alpha band and F3 and FP1 – for beta band signals.
1 INTRODUCTION
Apart from the visual response to light (light enables
us to see), the non-visual response to light (melatonin
suppression, core body temperature regulation,
alertness and cognition, circadian clock changes) has
been examined in detail since early 2000, when a new
photoreceptor - intrinsically photosensitive retinal
ganglion cell (ipRGc) containing the melanopsin had
been discovered. The non-visual response depends on
the light wavelength and intensity (irradiance level at
the eye), time and duration of exposure. It was
scientifically proven that light of particular
wavelengths is able to affect human health,
physiological and psychological behavior and
wellbeing (Bellia et al., 2011, Wolska et al, 2018,
Łaszewska et al., 2017, Sahin et al., 2014, Cajochen
et al., 2005, 2007, 2010). Many studies confirmed that
exposure to blue or red light increases the level of
a
https://orcid.org/0000-0003-3912-605X
b
https://orcid.org/0000-0003-3990-0121
c
https://orcid.org/0000-0003-2856-7298
d
https://orcid.org/0000-0002-7145-6457
alertness (Figueiro et al., 2009, 2016, Figueiro & Rea,
2010, Plitnick et al., 2010, Sahin & Figueiro, 2013,
Okamoto et al., 2014, Łaszewska et al., 2017,
Scheuermaier et al, 2018, Iskra-Golec et al , 2017,
Phipps-Nelson at al, 2009).
Maintaining a high level of alertness is a very
important factor on many workstations, especially
where the human error could result in occupational
accident or threat to life or health of many people. The
new knowledge of the dual role of light contributed
in numerous studies concerning influence light on
alertness level. Among the methods of objective
alertness assessment, EEG signal analysis seems to be
the most frequent used and relatively easy to use.
From the EEG signal it is possible to differentiate
bands: alpha (8-12 Hz), beta (13-30 Hz), delta (0.5-4
Hz), and theta (4.5-8 Hz) using fast Fourier transform.
The EEG signal is closely related to the activity of the
person. As the activity increases, the EEG shifts to
higher dominating frequency and lower amplitude.
40
Wolska, A., Sawicki, D., Kołodziej, M., Wisełka, M. and Nowak, K.
Which EEG Electrodes Should Be Considered for Alertness Assessment?.
DOI: 10.5220/0008168600400049
In Proceedings of the 3rd International Conference on Computer-Human Interaction Research and Applications (CHIRA 2019), pages 40-49
ISBN: 978-989-758-376-6
Copyright
c
2019 by SCITEPRESS – Science and Technology Publications, Lda. All rights reserved

(Malmivuo and Plonsey, 1995). In the awaking state
(and with the eyes open) theta and alpha waves
practically does not exist or their amplitudes are
minimal (Sahin and Figueiro, 2013, Baek and Min,
2015, Klimesch, 2012, Okamoto, 2014, Sawicki et
al., 2016). The increase of their amplitude in the
awaking state is interpreted as the decrease of
alertness and vice versa. Additionally sometimes
beta, and delta bands are also taken into account in
studies on alertness.
However, a unified or standardized method of
analyzing the EEG signal for this purpose does not
exist. The differences concern both the EEG
registration (EEG equipment, number and placement
of electrodes, type of electrodes etc.) and analysis of
EEG signal for the alertness assessment (procedure of
raw signal filtering – pre-processing, artifacts
removing method, digital processing of cleaned
signal, mathematical interpretation of recorded time
series, spectral analysis, and selection of the
electrodes for the analysis etc.). As it was mentioned
before, for the purpose of assessing alertness after
exposure to particular light usually two or three EEG
bands are considered. Alpha, theta and beta (Lavoie
et al., 2003, Figueiro et al., 2009, Plitnick et al., 2010,
Sahin at al., 2013, Yokoi et al., 2003), alpha, theta and
delta (Phipps-Nelson et al., 2009, Iskra-Golec et al.,
2017), alpha and theta (Sawicki et al., 2016), alpha
and beta (Scheuermaier et al., 2018). However some
studies on vigilant attention and sleeping considered
all bands and even for particular frequencies of those
bands (Chellappa et al, 2017).
And even the same equipment for EEG
registration and placement of electrodes according to
the International 10-20 system is used and the same
frequency ranges are analysed – the brain sites for
analysis (what corresponds with particular electrodes
placement on the scalp) are often different. Based on
many studies on EEG registration for alertness level
assessment some examples of electrodes sets could be
specified:
midline central: Fz, Cz, Pz and Oz (Łaszewska et
al., 2017, Yokoi at al., 2003, Figueiro, 2009);
motor cortex: C3 and C4 (Lavoie et al., 2003);
frontal and occipital from midline central: Fz and
Oz (Donskaya et al., 2012);
anterior temporal lobes (T3, T4), parietal lobe (P3,
P4), occipital lobe (O1, O2) (Phipps-Nelson et
al.,2009);
motor cortex (C3, C4), midline central (Fz, Cz, Pz
and Oz) (Scheuermaier et al., 2018);
motor cortex (C3, C4), parietal lobe (P3, P4),
occipital lobe (O1, O2) and frontal lobe (F3, F4)
(Chellappa et al., 2017);
left frontal lobe (Fp1, F7, F3), right frontal lobe
(Fp2, F4, F8), motor cortex (C3, Cz, C4), left
temporal lobe (T3 , T5), right temporal lobe (T4,
T6), anterior temporal lobes (T3, T4), posterior
temporal lobes (T5, T6), parietal lobe (P3, Pz, P4),
occipital lobe (O1, O2), and midline central (Fz,
Cz, Pz) (Iskra-Golec et al., 2017).
Besides, sometimes the selection of electrodes is
simply based on the strongest signal (the electrodes
which provide the higher signal for particular band,
regardless of their placement on the scalp). The
significant effect of the registration channel
(electrodes) on alpha, theta and beta power was stated
by Figueiro (Figueiro et al., 2009). It means that
electrodes selected for the final analysis could
influence the interpretation of alertness. There is no
knowledge about how the selection of particular
electrodes influences the interpretation of alertness
level based on particular bands of EEG signal. It
would be interesting to find out which electrodes
(channels) seem to be best correlated with changes of
alertness level.
The aim of the article is to answer the question: is
it possible to indicate EEG electrodes for signal
processing and alertness interpretation based on alpha
and beta bands in experiments with exposure to blue
and red light? This paper presents the proposition of
electrodes selection for alertness assessment based on
results obtained during the study carried out using the
32 electrodes EEG registration with exposure to blue
and red light.
2 EXPERIMENT
2.1 Participants
Thirty three right-handed male volunteers, aged 20-
30 years (mean age 23,4, SD=2,12 years) participated
in the study: 17 of extreme morning chronotype and
16 of extreme evening chronotype, identified using
Composite Scale of Morningness – CSM (Smith et al.,
1989, Jankowski, 2015). All participants were paid
and the following exclusion criteria were applied:
sleep or mental health problems, color blindness,
glasses to work with a computer. The experimental
protocol was reviewed and approved by the Senate
Committee of Research Ethics of Józef Piłsudski
University of Physical Education in Warsaw.
Informed written consent was obtained from each
participant.
Which EEG Electrodes Should Be Considered for Alertness Assessment?
41
2.2 Light Exposure
The experiment was conducted in a windowless, air-
conditioned laboratory room of white walls, with
general indirect white LED lighting operated by
lighting control system. The general lighting was
used for dim light conditions i.e. < 5 lx at the eyes.
Additionally two desk LED luminaires, specially
designed for exposure to blue and red light, were
positioned, according to Alkozei et al. (Alkozei et al.,
2016), at 80 cm distance from the participant’s
nasion, with each light cantered at a 45 degree angle
from midline. The established illuminance level for
exposure was 40 lx both for red (630 nm) and blue
light (465 nm). The technical aspects of light
exposure are provided in (Wolska et al., 2018). The
study was carried out during the winter season.
2.3 Procedure
The experimental session started respectively at 7:30
am for morning chronotype and at 11:00 am for
evening chronotype, similarly to study of Maierova
(Maierova et al., 2016). The subjects were asked to
maintain a fixed regular plan sleep, lasting at least 7
hours during the week preceding the start of the
experiment. Every participant took part in two
experiments, each with exposure to different light.
The session order was counterbalanced for each
individual, to avoid the impact of familiarizing with
the procedure on results. One week interval between
the experiments was established (Wolska et al.,
2018). During each experiment participants
underwent 30 min under dim light (< 5 lx), 20 min
behavioral tests with EEG registration (Resting 1,
GoNoGo 1 and n-back 1), 30 min under blue or red
light exposure (no tests and EEG registration
performed), 70 min behavioral tests with EEG
registration (Resting 2, GoNoGo 2, n-back 2,
GoNoGo 3, n-back 3, GoNoGo 4, n-back 4, Resting
3). All EEG registrations were performed under dim-
light. The resting state (plus symbol (“+”) presented
on the screen for 3 minutes together with EEG
registration) was executed three times:
(1) after dim light and just before exposure to blue or
red light,
(2) just after exposure to particular light (acute
alerting effect) and
(3) 70 minutes after exposure (sustained acute
alerting effect).
2.4 EEG Registration
EEG measurements were taken using 256- channel
g.Hlamp amplifier (Guger Technologies, Graz,
Austria). Signal was recorded from 32 electrodes
paced according to the 10-20 International system
(Figure 1). All impedances were kept below 30kΩ
during the whole recording session. A Simulink
model (running under Matlab 2014a) was used to
control the registration of the signal. It consisted of
the building block provided by the manufacturer of
the system (Guger Technologies, Graz, Austria)
(Wolska et al., 2018).
3 DATA ANALYSIS
EEG recordings were taken from 32 electrodes and
then analyzed in order to assess the changes in
alertness level: “short term”: before exposure (1) and
after exposure to light (2), “long term”: before
exposure (1) and after exposure (3). This article
focused on changes for alpha and beta frequency
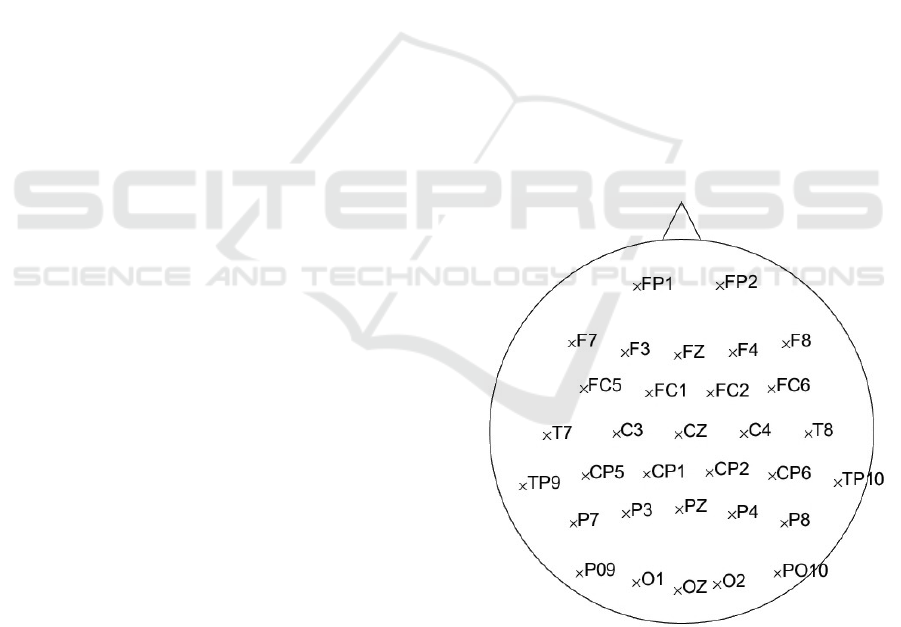
bands on all 32 electrodes – the layout in Figure 1.
The alertness level assessment based on changes in
energy in alpha and beta bands is based on the
following assumptions: the higher energy in alpha
band the lower level of alertness, the higher energy in
beta band the higher alertness level.
Figure 1: The layout of 32 electrodes used in the
experiment.
3.1 Preprocessing
The EEG recordings were filtered using the same
processing method for each registration. Band pass
FIR filtration was applied in order to eliminate
CHIRA 2019 - 3rd International Conference on Computer-Human Interaction Research and Applications
42

frequencies higher than 32 Hz and lower than 0.01 Hz
for all 32 channels. This had been done to ensure that
neither occasional electrical grid impact and higher
frequencies harmonics nor low frequencies events are
included in signal. Furthermore recordings were
visually checked for artifacts (due to blinking,
movements etc.) and manually marked and removed.
In case of presence of multiple artifacts in signal
interpolation (based on 2 neighboring – closest
channels) was applied. Maximum of 4 channels were
interpolated and in case of 5 or more channels
significantly affected by artifacts data set was marked
as rejected from further analysis. At the end Infinite
Component Analysis (ICA) was performed for each
data set individually. After filtration each data set was
analyzed.
3.2 Feature Extraction
The initially prepared signal was digitally processed.
To remove signals outside the alpha and beta bands
and then estimate the energy in those bands, a 4th
order lowpass Butterworth filter was applied.
Afterwards signal was divided into 5 seconds
windows. The number of windows depended on the
correctly recorded registration time (after artifacts
removal). As a result, 9 to 30 5-second windows were
obtained, which corresponds to obtaining 9 to 30
element sample sets for individual bands (alpha and
beta). For each window of signal the energy was
calculated using the variance calculation – this way
power analysis was performed. This digital
processing procedure was applied for each
participant, for each electrode of the recorded signal
and for interaction with two colours of light (red and
blue). Considering the fact, that:
three independent signal registrations were
carried out (resting state (1), (2) and (3)) for each
experimental session,
33 subjects were examined (morning chronotype
– with assigned codes: R01 - R17, evening
chronotype – with assigned codes: W01 - W16),
the interaction of two color of light was used,
signal was registered on 32 electrodes,
EEG signal energy was calculated in two
independent alpha and beta bands,
3x33x2x32x2=12672 sets of 9 to 30 element signal
samples were obtained.
3.3 Statistical Analysis
The energy samples sets were subjected to further
statistical analysis. For each set of samples (before
exposure (1), after exposure (2) and after exposure
(3)) the mean values of energy (M1, M2, M3) and
standard deviation (STD1, STD2, STD3) were
calculated. Statistics were calculated using the
Student's t-test. The Student's t-test compares pairs of
sets between different registrations. Two types of
comparisons were made: between the registration of
resting 1 (R1) and 2 (R2) and between the
registrations resting 1 (R1) and 3 (R3) - marked as
R12 and R13 respectively. The null hypothesis H0
was assumed that the means in the compared sets of
signal samples of the analyzed resting states do not
differ statistically significant (no effect of light on
energy values) and the alternative hypothesis Ha, that
the means in the compared sets of samples differ
significantly (effect of light on energy values). The
significance level of rejecting the null hypothesis was
assumed as α=0.1. If the value of the test statistic
(Student's t-value) falls in the rejection region the null
hypothesis H0 is rejected in favor of the alternative
hypothesis Ha. The statistical analysis was carried out
using the Matlab environment (2018a). The built-in
functions mean, std, ttest2 were used for statistical
calculations.
An exemplary set of results for testing the mean
energy values of a resting signal for one electrode Oz
is presented in Table 1. Taking into account the
results of Student's t-tests, a “resultant” measure of
significance of a given difference (H12: between (1)
and (2), H13: between (1) and (3)) was introduced.
The following values for that measure were assumed:
1 – statistically significant difference, 0 – not
significant difference. T12, T13 are the values of t-
Student’s statistics t, p12, p13 are the statistical
significances.
The results of the sum of measures H12 and H13
(assigned as HS12 and HS13) indicate that after
exposure to blue light there were statistically
significant changes in energy recorded on the
electrode Oz between resting state (R1) and (R2) in 9
subjects and between resting state (R1) and (R3) in 10
subjects with evening chronotype.
The above presented analysis allows selecting the
electrodes on which the energy differences
statistically significant in the alpha or beta bands
between the R12 and R13 resting states occured most
often. For this purpose, for each electrode, for each
band and each difference (R12 and R13) a sum of
“resultant” measures of significance H12 and H13
was calculated (as HS12 and HS13 respectively) and
presented in Table 1. The higher the measure HS12
or HS13 of the individual electrode, the more the
differences in the energy of the analyzed signals of a
given electrode were statistically significant. Because
Which EEG Electrodes Should Be Considered for Alertness Assessment?
43
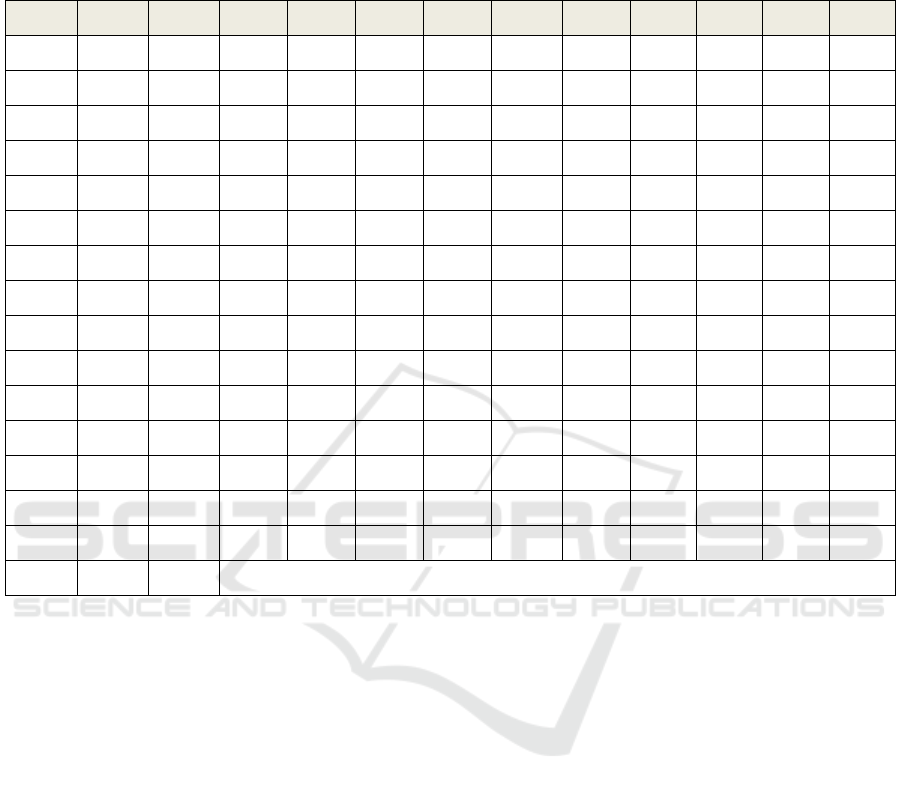
Table 1: An exemplary set of energy results obtained for the Oz electrode and alpha band (evening chronotype W and blue
light N). M1, M2, M3 – the value of energy in [V
2
]. STD1, STD2, STD3 – standard deviations. T12, T13 are the values of
t-Student’s statistics t, p12, p13 are the statistical significances. The significance level of rejecting the null hypothesis was
assumed as α=0.1. If p12<α , H12=1, otherwise H12=0, for p13 and H13 in the same way.
Subject H12 H13 M1 M2 M3 STD1 STD2 STD3 T12 T13 p12 p13
W01N 0 1 2.575 69.132 0.879 0.703 301.779 0.223 -1.011 10.298 0.318 0.001
W02N 1 1 1.812 2.459 1.612 0.392 1.812 0.231 -1.780 1.748 0.081 0.089
W03N 1 1 1.472 2.163 2.245 0.340 0.523 0.428 -5.779 -6.509 0.000 0.001
W04N 0 1 65.068 59.924 40.203 21.023 15.757 24.512 0.959 3.433 0.343 0.001
W05N 0 0 11.046 15.037 9.535 4.743 12.679 2.744 -1.271 1.240 0.211 0.223
W06N 1 1 15.398 11.023 11.689 3.855 3.330 3.553 4.285 3.779 0.000 0.000
W07N 1 0 1.508 3.239 1.494 0.369 1.021 0.333 -7.877 0.142 0.000 0.888
W08N 1 1 7.496 11.464 4.779 2.152 3.984 1.339 -4.639 5.462 0.000 0.001
W09N 1 0 29.627 20.426 22.842 15.384 8.437 8.974 2.582 1.660 0.013 0.104
W10N 0 0 3.154 2.992 3.052 0.802 0.690 1.420 0.667 0.329 0.508 0.743
W11N 1 0 2.073 2.434 2.256 0.380 0.682 0.305 -2.230 -1.302 0.031 0.202
W12N 1 1 46.288 60.325 61.529 12.119 16.229 14.805 -3.155 -3.916 0.003 0.001
W13N 0 1 3.855 3.292 5.616 1.983 0.687 2.340 0.866 -2.640 0.394 0.012
W15N 0 1 6.737 5.940 14.288 3.418 3.874 7.502 0.726 -4.695 0.472 0.001
W16N 1 1 5.834 4.705 3.087 2.477 2.085 1.242 1.794 5.103 0.079 0.001
Sum HS12= 9 HS13=10 -
the analyzed differences R12 and R13 are associated
with stimulation of light of a specific color, the
analysis allows selecting the electrodes on which the
response to stimulation with a specific color is the
strongest.
4 RESULTS AND DISCUSSION
The influence of blue and red light on energy
significant changes in alpha and beta bands was
observed. Only statistically significant cases of the
influence of light on energy were analyzed. It is worth
noting that the significance of the interaction of light
with signals from specific electrodes was confirmed
by the Student's t-test in all considered groups, i.e.:
the interaction of blue light (N) in the morning and
evening chronotype, the interaction of red light (C) in
the morning (R) and evening (W) chronotype. The
number of cases of significant changes in energy
(both between R12 and R13 resting states) on
individual electrodes in alpha and beta band is
presented in Table 2. The highest values of
HS12+HS13 measure were marked in red color (for
red light exposure) and blue color (for blue light
exposure) in Table 2. Also the electrodes for which
the highest values of that measure were found have
been marked in green color (for alpha band) and in
violet color (for beta band).
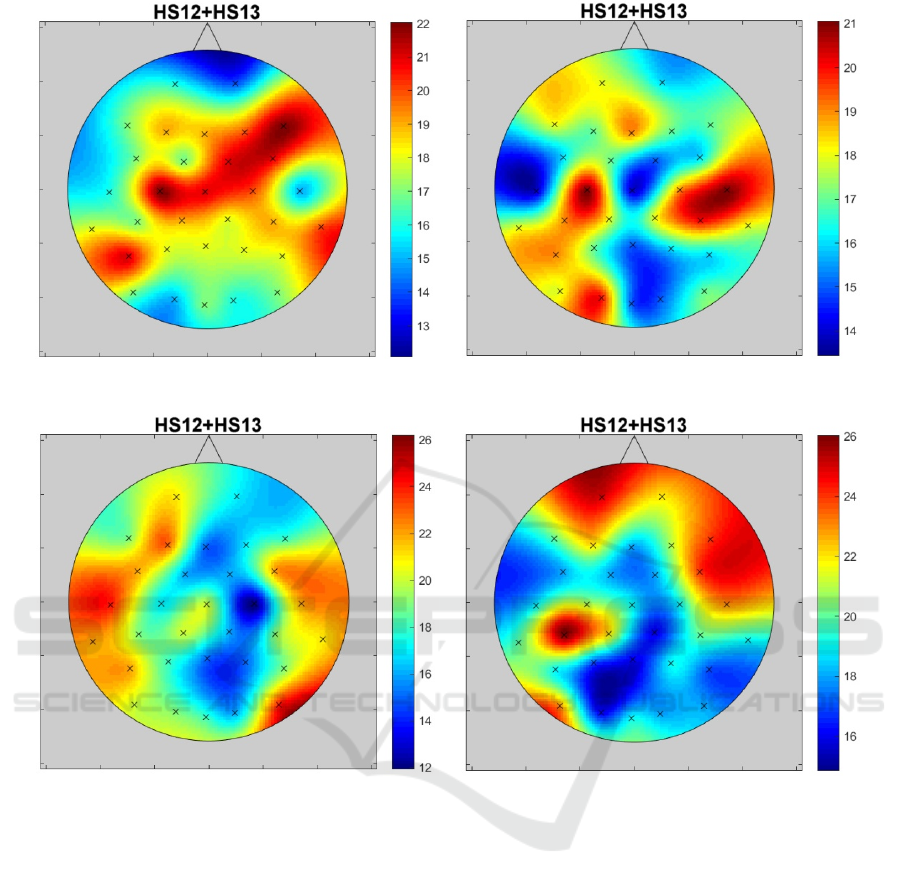
The difference between signal channels
(electrodes) response to blue and red color in alpha
and beta bands has been found. The visualizations of
the number of significant differences (HS12 + HS13)
in alpha and beta bands on a scalp are shown as the
impact maps in Figure 2 after blue light exposure and
in Figure 3 after red light. When analyzing impact
maps for both chronotype groups, it should be noted
that these maps are different. This means that it is
difficult to indicate one universal electrode for all
groups.
The impact maps presented in Figures 2 and 3 are
clearly asymmetrical. The maximum HS12+HS13 for
alpha bands (both for red and blue light) is shifted
from the central midline to the left motor cortex area.
CHIRA 2019 - 3rd International Conference on Computer-Human Interaction Research and Applications
44
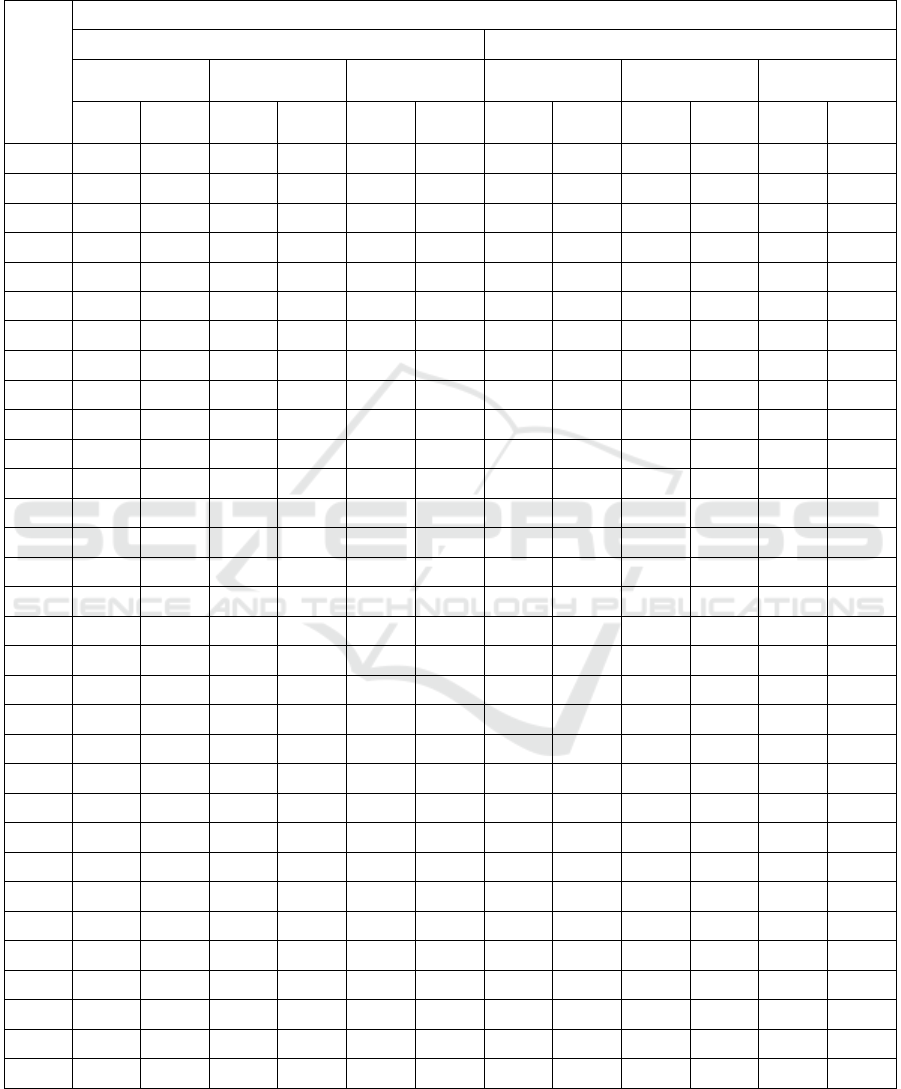
Table 2: The sum of HS12 and HS13 measures for individual electrodes for both color lights stimulation among evening and
morning chronotypes, and for the whole group. The highest values of HS12+HS13 measure were marked in red color (for red
light exposure) and blue color (for blue light exposure). The electrodes for which the highest values of that measure were
found have been marked in green color (for alpha band) and in violet color (for beta band).
Electrode
HS12+HS13
Alpha band Beta band
Morning
chronot
yp
e
Evening
chronot
yp
e
Morning+evening
chronot
yp
e
Morning
chronot
yp
e
Evening
chronot
yp
e
Morning+evening
chronot
yp
e
Red
li
g
ht
Blue
li
g
ht
Red
li
g
ht
Blue
li
g
ht
Red
li
g
ht
Blue
li
g
ht
Red
li
g
ht
Blue
li
g
ht
Red
li
g
ht
Blue
li
g
ht
Red
li
g
ht
Blue
li
g
ht
C3 22 17 21 19 43 36 17 21 21 17 38 38
C4 20 19 19 20 39 39 12 15 19 19 31 34
CP1 19 19 18 12 37 31 20 17 22 18 42 35
CP2 18 18 18 15 36 33 16 18 16 15 32 33
CP5 17 20 19 17 36 37 19 22 26 18 45 40
CP6 19 17 20 19 39 36 19 23 20 19 39 42
CZ 21 18 14 15 35 33 20 22 19 18 39 40
F3 19 17 17 21 36 38 23 24 22 22 45 46
F4 20 21 17 17 37 38 17 20 21 19 38 39
F7 17 21 18 12 35 33 19 21 20 20 39 41
F8 22 22 17 13 39 35 18 24 24 20 42 44
FC1 17 23 17 20 34 43 16 24 18 19 34 43
FC2 21 20 15 19 36 39 16 18 18 18 34 36
FC5 17 19 16 17 33 36 22 24 18 19 40 43
FC6 21 22 16 12 37 34 22 22 24 17 46 39
FP1 16 18 18 16 34 34 21 26 25 23 46 49
FP2 14 19 16 16 30 35 17 22 22 19 39 41
FZ 19 19 19 18 38 37 15 22 18 23 33 45
O1 15 19 20 19 35 38 19 22 16 22 35 44
O2 16 20 15 19 31 39 16 22 18 18 34 40
OZ 17 22 15 19 32 41 18 22 19 18 37 40
P3 18 17 17 16 35 33 18 18 17 17 35 35
P4 18 18 16 17 34 35 15 20 19 16 34 36
P7 21 19 19 19 40 38 22 22 19 21 41 43
P8 18 17 16 20 34 37 19 25 17 21 36 46
P09 17 17 18 14 35 31 20 22 23 22 43 44
PO10 17 17 17 15 34 32 24 22 18 20 42 42
PZ 18 20 15 14 33 34 15 17 16 16 31 33
T7 16 19 14 14 30 33 24 25 19 18 43 43
T8 15 18 21 12 36 30 22 22 23 19 45 41
TP9 18 18 18 17 36 35 22 21 20 21 42 42
TP10 20 20 18 16 38 36 21 20 19 18 40 38
Which EEG Electrodes Should Be Considered for Alertness Assessment?
45
All participants in the study were right-handed.
However, it is difficult to draw conclusions about
lateralization of brain function influence on the brain
wave effects, although statistically confirmed cases
are considered. There were no studies carried out on
a group of left-handed. However, this indicates the
need to continue research with particular emphasis on
this aspect.
Considering the influence of visual stimuli on
alpha waves, O1 and O2 electrodes are often
indicated as the most appropriate for recording such
waves. In none of the presented results has this been
confirmed. Moreover, both for W and R chronotypes
and red light, and R chronotype and blue light, the O1
and O2 electrodes were those where the values of
HS12+HS13 measure were relatively small. Only in
the case of W chronotype and blue light exposure
values of that measure were above average.
Analyzing the presented results it would be
possible to propose the use of C3 electrode to assess
the interaction of red light and the FC1 electrode to
assess the interaction with blue light. These
electrodes are located very close together on the
scalp. Perhaps a good solution would be to use the
average signal from electrodes C3 and FC1 for
alertness assessment with blue light interaction. It
would be worthwhile to continue the tests by
analyzing the signals of other electrodes in this area
(C3, FC1). An interesting solution would be to take
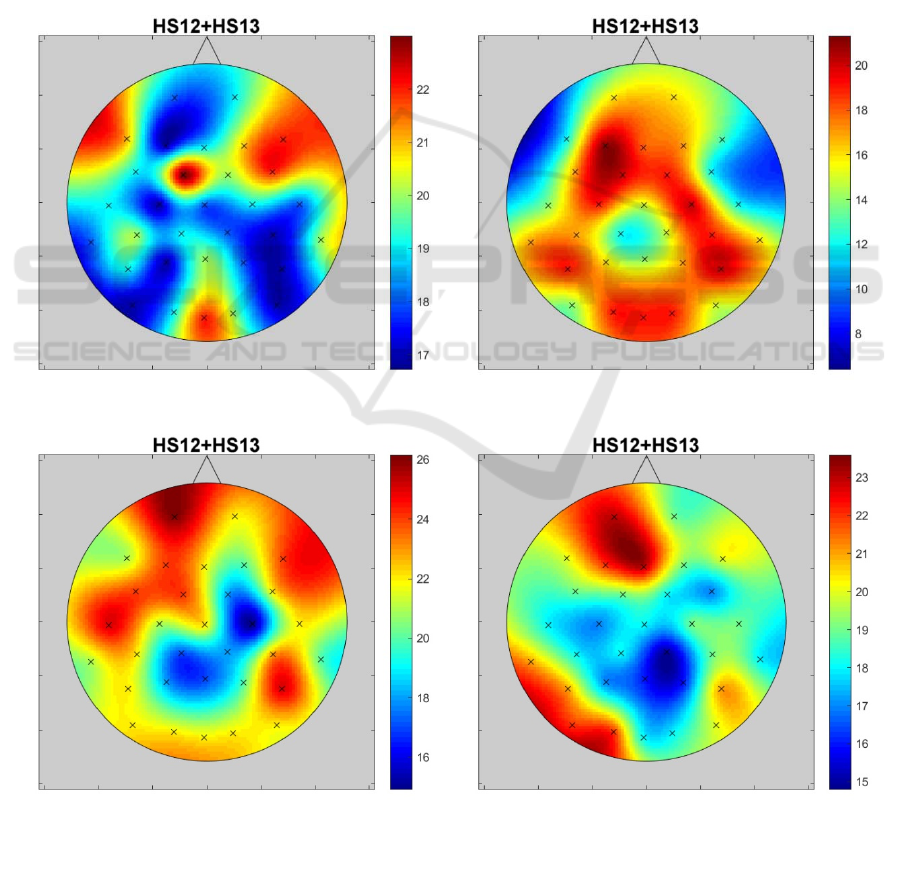
Morning chronotype, alpha Evening chronotype, alpha
Morning chronotype, beta Evening chronotype, beta
Figure 2: The distribution of significant differences (HS12 + HS13) number in alpha and beta bands on a scalp after exposure.
CHIRA 2019 - 3rd International Conference on Computer-Human Interaction Research and Applications
46
Morning chronotype, alpha Evening chronotype, alpha
Morning chronotype, beta Evening chronotype, beta
Figure 3: The distribution of significant differences (HS12 + HS13) number in alpha and beta bands on a scalp after exposure
to red light.
into account the signals from the EEG registration
with a larger number of electrodes.
Beta band is less frequently used in alertness
analysis based on EEG registration. However, the
analysis of the presented results shows that the
maximum of significance measures HS12+HS13 for
beta waves on specific electrodes are higher than the
for alpha band. For beta waves, the electrodes from
the area around central midline do not give high
HS12+HS13 and thus seems not to be the best to the
alertness analysis caused by different colors of light.
The highest significance measures HS12+HS13 were
noted for the electrodes at the area of left frontal lobe
(F3 and FP1), both for red and blue light. That’s why
it seems reasonable to propose the use of F3 and FP1
electrodes to assess the interaction of red light and
blue light. HS12+HS13 on these electrodes are the
highest for all participants (both R and W chronotype)
and for interaction with red and blue light.
5 CONCLUSIONS
The conducted study has shown that electrodes can be
selected to assess alertness on the basis of EEG signal
analysis. In the current research, the researchers used
different approaches to the selection of electrodes.
Reasonable reasons are signal strength or its purity
(no interference or artifacts). However, signals not on
all electrodes are equally related to the effect of light
on alertness. It is worth attempting to additional
signal clearing in a situation where we can use an
Which EEG Electrodes Should Be Considered for Alertness Assessment?
47

electrode that collects brain waves from the area
strongly associated with the impact of the appropriate
stimulus. Research has shown that the selection of
electrodes can be made in a way that gives a higher
statistical significance of the impact. At the same
time, it is worth paying attention to the fact, that
presented in this article study is one of the first studies
of this type (if not the first one at all). Similar research
should be continued.
It is worth analyzing others, additional factors that
can affect the significance of the interaction - and thus
the selection of electrodes for signal analysis. In the
presented study, the extreme chronotypes were taken
into account. It turned out that this has a significant
impact - the interaction maps for different
chronotypes are different (Figures 3 and 4). Only
right-handed participants took part in the study. It
seems that from the point of view of the slightly
different functioning of the brain dependent on
lateralization, this is one of those factors that is worth
additional research. Attention should be paid to the
fact that while the influence of blue light on alertness
is documented in many articles, the influence of red
light is confirmed in a much smaller number of
publications. This is mainly due to the well-
documented impact of melatonin level on alertness
and the documented ability to influence light on
melatonin production.
The study described here shows that the effect on
brain waves of blue and red light is similar. What
once again confirms the possibility of interaction with
red light on alertness, although through a mechanism
other than melatonin production control.
ACKNOWLEDGEMENTS
This paper has been based on the results of a research
task carried out within the scope of the fourth stage of
the National Programme "Improvement of safety and
working conditions" partly supported in 2017–2019 -
-- within the scope of research and development ---
by the Ministry of Science and Higher Education /
National Centre for Research and Development. The
Central Institute for Labour Protection -- National
Research Institute (CIOP-PIB) is the Programme's
main co-ordinator.
REFERENCES
Alkozei, A., Smith, R., Pisner, D.A., Vanuk, J.R., Berryhill,
S.M., Fridman, A., Shane, B.R., Knight, S.A., Killgore,
W.D.S., 2016. Exposure to blue light increases
subsequent functional activation of the prefrontal
cortex during performance of a working memory task.
Sleep, vol 39 (9), 1671-1680.
http://dx.doi.org/10.5665/sleep.6090
Baek, H. Min, B.K., 2015. Blue light aids in coping with
the post-lunch dip: an EEG study. Ergonomics, 58(5),
803-810.
Bellia, L., Bisegna, F., Spada, G., 2011. Lighting in indoor
environments: Visual and non-visual effects of light
sources with different spectral power distributions.
Build Environ 46, 1984-1992. doi:
10.1016/j.buildenv.201.04.007
Cajochen, C., Munch, M., Kobialka, S., Krauchi, K.,
Steiner, R., Oelhafen, P., Eizr-Justice, A., 2005. High
sensitivity of human melatonin, alertness,
thermoregulation and heart rate to short wavelength
light. J Clin Endocrinol Metab, 90, 1311-1316.
Cajochen, C., 2007. Alerting effects of light. Sleep Med
Rev., 11, 453-464.
Cajochen, C., Chellappa, S., Schmidt, C., 2010. What keeps
us awake? The role of clocks and hourglasses, light, and
melatonin. Int Rev Neurobiol, 93, 57-90.
Chellappa S.L., Steiner R., Blattner P., Oelhafen P.,
Cajochen C. (2017) Sex differences in light sensitivity
impact on brightness perception, vigilant attention and
sleep in humans? Scientific Reports, 7: 14215, 1-9.
Donskaya, O.G., Verevkin, E.G., Putilov, A.A., 2012. The
first and second principal components of the EEG
spectrum as the correlates of sleepiness. Somnologie,
16, 69-79. Doi. 10.1007/s11818-012-0561-1.
Figueiro, M.G., 2013. Non-Visual Lighting Effects and
Their Impact on Health and Well-Being. In
Encyclopedia of Color Science and Technology.
Springer Science+Business Media New York doi:
10.1007/978-3-642-27851-8_118-4, 1-11.
Figueiro, M.G., Bierman, A., Plitnick, B., Rea, M.S., 2009.
Preliminary evidence that both blue and red light can
induce alertness at night. BMC Neurosci, 10. 10:105.
DOI: 10.1186/1471-2202-10-105
Figueiro, M.G., Rea, M.S., 2010. The effects of red and blue
light on circadian variations in cortisol, alpha amylase
and melatonin. Int J Endocrinol., Volume 2010, Article
ID 829351, 9 pages. doi:10.1155/2010/829351.
Figueiro, M.G., Sahin, L., Wood, B., Plitnick, B., 2016.
Light at night and measures of alertness and
performance: implications for shift workers. Biol Res
Nurs.. 18(1), 90-100. doi:10.1177/10998004155728 73.
Iskra-Golec, I., Golonka, I., Wyczesany, M., Smith, L.,
Siemiginowska, P., Watroba, J., 2017. Daytime effect
of monochromatic blue light on EEG activity depends
on duration and timing of exposure in young men.
Advances in Cognitive Psychology, 13(3), 241-247. doi:
10.5709/acp-0224-0.
Jankowski, K.S., 2105. Composite Scale of Morningness:
psychometric properties, validity with Munich
ChronoType Questionnare and age/sex differences in
Poland. Eur Psychiatry, 30, 166-171. doi:
10.1016/j.eurpsy.2014.01.004.
Klimesch, W., 2012. Alpha-band oscillations, attention, and
controlled access to stored information. Trends Cogn
CHIRA 2019 - 3rd International Conference on Computer-Human Interaction Research and Applications
48

Sci. 16(12), 606-617.
Lavoie, S., Paquet, J., Selamoui, B. Rufiange, M., Dumont,
M., 2003. Vigilance levels during and after bright light
exposure in the first half of the night. Chronobiol Int,
20(6), 1019-1038. doi: 10.1081/CBI-120025534.
Łaszewska, K., Goroncy, A., Weber, P., Pracki, T., Tafil-
Klawe, M., Pracka, D., Złomańczuk, P., 2017. Daytime
acute non-visual alerting response in brain activity
occurs as a result of short- and long wavelengths of
light. Journal of psychophysiology.
https://doi.org/10.1027/0269-8803/a000199.
Maierova, L., Borisuit, A., Scartezzini, J.L., Jaeggi, S.M.,
Schmidt, C., Münch, M., 2016. Diurnal variations of
hormonal secretion, alertness and cognition in extreme
chronotypes under different lighting conditions.
Nature. Scientific Reports, 1-10. doi:
10.1038/srep33591.
Malmivuo, J., Plonsey, R., 1995. Bioelectromagnetism.
Electroencephalography (chapter 13). In
Bioelectromagnetism – Principles and Applications of
Bioelectric and Biomagnetis Fields. Oxford University
Press. 363-374.
Okamoto, Y., Rea, M.S., Figueiro, M.G., 2014. Temporal
dynamics of EEG activity during short and long
wavelength light exposures in the early morning. BMC
Res Notes,7: 113, 1-6.
Phipps-Nelson, J., Redman, J.R., Schlangen, L.J.,
Rajaratnam, S.M., 2009. Blue light exposure reduces
objective measures of sleepiness during prolonged
night time performance testing. Chronobiol Int. 26(5):
891-912. doi: 10.1080/07420520903044364.
Plitnick, B., Figueiro, M.G., Wood, B., Rea, M.S., 2010.
The effects of red and blue light on alertness and mood
at night. Lighting Res. Technol, 42(4), 449-458. doi:
10.1177/1477153509360887
Sahin, L. and Figueiro, M.G., 2013. Alerting effects of
short-wavelengths (blue) and long – wavelengths (red)
lights in the afternoon. Physiol Behav. 116-117(5),
DOI:10.1016/j.physbeh.2013.03.014-7.
Sawicki, D., Wolska, A., Rosłon, P., Ordysiński, S., 2016.
New EEG Measure of the Alertness Analyzed by
Emotiv EPOC in a Real Working Environment. In
Proc. of the 4th International Congress on
Neurotechnology, Electronics and Informatics,
NEUROTECHNIX 2016, Porto, Portugal, 7-8 Nov.
2016, 35-42. https://doi.org/10.5220/0006041200
350042.
Scheuermaier, K., Munch, M., Ronda, J.M., Duffy, J.F.,
2018. Improved cognitive morning performance in
healthy older adults following blue – enriched light
exposure on the previous evening. Behav Brain Res.
348, 267-275, https://doi.org/10.1016/j.bbr.2018.04.021.
Smith, C.S., Reilly, C., Midkiff, K., 1989. Evaluation of
three circadian rhythm questionnaires with suggestion
for an improved measure of morningness. J Appl
Psychol., 75. 728-738.
Wolska, A., Sawicki, D., Nowak, K. Wiselka, M.,
Kołodziej, M., 2018. Method of acute alertness level
evaluation after exposure to blue and red light (based
on EEG): Technical aspects. In Proc. of the 6th
International Congress on Neurotechnology,
Electronics and Informatics, NEUROTECHNIX 2018,
Sevile, Spain,. 2018, 53-60. doi:
10.5220/0006922500530060.
Yokoi, M., Aoki, K., Shiomura, Y., Iwanga, K., Katsuura,
T., 2003. Effect of bright light on EEG activities and
subjective sleepiness to mental task during nocturnal
sleep deprivation. J. Physiol Anthropol Appl Human
Sci. 22, 257-263.
Which EEG Electrodes Should Be Considered for Alertness Assessment?
49
