
ME2: A Scalable Modular Meta-heuristic for Multi-modal
Multi-dimension Optimization
Mohiul Islam, Nawwaf Kharma, Vaibhav Sultan, Xiaojing Yang, Mohamed Mohamed
and Kalpesh Sultan
Department of Electrical & Computer Engineering, Concordia University, Montreal, Canada
Keywords:
Evolutionary Computation, Evolutionary Algorithms, Genetic Algorithms, Simulated Annealing, Particle
Swarm Optimization, Covariance Matrix Adaptation Evolution Strategy, Multi-dimension Optimization,
Multi-modal Optimization, Parallel Scalable Optimization.
Abstract:
Map, Explore & Exploit (ME2) is a scalable meta-heuristic for problems in the field of multi-modal, multi-
dimension optimization. It has a modular design with three phases, as reflected by its name. Its first phase
(Map) generates a set of samples that is mostly uniformly distributed over the search space. The second phase
(Explore) explores the neighbourhood of each sample point using an evolutionary strategy, to find a good -
not necessarily optimal - set of neighbours. The third phase (Exploit) optimizes the results of the second
phase. This final phase applies a simple gradient descent algorithm to find the local optima for each and all
of the neighbourhoods, with the objective of finding a/the global optima of the whole space. The performance
of ME2 is compared, on a fair basis, with the performance of benchmark optimization algorithms: Genetic
Algorithms, Particle Swarm Optimization, Simulated Annealing and Covariance Matrix Adaptation Evolution
Strategy. In most test cases it finds the global optima earlier than the other algorithms. It also scales-up,
without loss of performance, to higher dimensions. Due to the distributed nature of ME2’s second and third
phase, it can be comprehensively parallelized. The search & optimization process during these two phases can
be applied to each sample point independently of all the others. A multi-threaded version of ME2 was written
and compared to its single-threaded version, resulting in a near-linear speed-up as a function of the number of
cores employed.
1 INTRODUCTION
Optimization is a demanding field with a multitude of
industrial applications. Optimization problems range
from engineering design applications to logistics, and
from scheduling applications to food production, just
to mention a few (B
¨
ack et al., 2013). For multi-modal
multi-dimension optimization problems evolutionary
methods are most relevant and effective instead of
methods which are purely analytic.
In the following paragraphs we discuss the evo-
lutionary methods that are currently the standard in
the field of optimization. There after we present a
new modular algorithm framework for optimization,
consisting of three step: Map (2.1), Explore (2.2) and
Exploit (2.3) (ME2). Following a detail description
of this algorithm and each of its steps we present
its comparison (3) results and analysis (5) with other
standard algorithms using benchmark optimization
problems. We conclude by presenting how ME2 can
be scaled using multi-threaded implementation in a
multi-core system (5.4).
Genetic Algorithm (GA). First conceived by John
Holland as a means for studying adaptive behaviour
(Holland, 1992), Genetic Algorithms have come to
have a wide set of applications. If a problem can have
a genetic representation via binary, integer or floating-
point parameters, different variation operators can be
applied to a population of solutions which, together
with selection pressure, evolves the population to-
wards greater average fitness, over a number of gen-
erations. Variation operators in GA can range from
single/multi point mutation to one/N-point-crossover.
For each evolutionary generation of GA, parent selec-
tion can also vary from fitness proportionate to direct
ranking based on fitness. Child selection also has its
diverse methods.
196
Islam, M., Kharma, N., Sultan, V., Yang, X., Mohamed, M. and Sultan, K.
ME2: A Scalable Modular Meta-heuristic for Multi-modal Multi-dimension Optimization.
DOI: 10.5220/0008169001960204
In Proceedings of the 11th International Joint Conference on Computational Intelligence (IJCCI 2019), pages 196-204
ISBN: 978-989-758-384-1
Copyright
c
2019 by SCITEPRESS – Science and Technology Publications, Lda. All rights reserved

Particle Swarm Optimization (PSO). Introduced
by Kennedy and Eberhart (Kennedy and Eberhart,
1995) in 1995, Particle Swarm Optimization (PSO)
is another population based stochastic search and op-
timization procedure (Kiranyaz et al., 2015). The
swarm intelligence paradigm emerged from studies of
the collective behaviour and social characteristics of
organized, decentralized and complex systems known
as swarms. Belonging to this paradigm, PSO was in-
spired by the behaviour of bird flocks, where the goal
is to converge to a global optimum of some multidi-
mensional and possibly non-linear function or system.
Simulated Annealing (SA). Inspired by annealing
in metallurgy, Simulated Annealing was first intro-
duced by Metropolis (Metropolis et al., 1953). This
method is a Monte Carlo-based technique that gener-
ates a sequence of states of the solid. It is the key for
achieving the optimal ground state, which is the basis
of the annealing as an optimization method (Kiranyaz
et al., 2015).
SA along with other EA are sometimes called
meta-heuristics, which make few or no assumptions
about the problem being optimized and can thus
search for a global optimum over a large set of can-
didate solutions. But as their major difference, SA is
not population based and is also not based on ”sur-
vival of the fittest” philosophy. Suboptimal solutions
in SA are sometimes tolerated for the sake of avoiding
a local optimum.
Covariance Matrix Adaptation Evolution Strategy
(CMA-ES). CMA-ES is currently considered as the
‘state of the art’ in evolutionary computation which
has been adopted in many research labs and industrial
environments around the world (Hansen, 2007). Its
approach to the evolutionary search space is by esti-
mating a covariance matrix on convex-quadratic func-
tion, similar to the inverse Hessian. It is considered to
be highly competitive for local optimization (Hansen
and Ostermeier, 2001) and also for global optimiza-
tion (Hansen and Ostermeier, 2001; Hansen, 2009).
2 MAP EXPLORE EXPLOIT
(ME2) ALGORITHM
Similar to GA, PSO, SA and CMA-ES, Map Explore
& Exploit (ME2) is a meta-heuristic for multi-modal
multi-dimension optimization problems. True to its
name, the ME2 algorithm has three steps in its pro-
cess. The first step is where the landscape of the fit-
ness function is randomly mapped using a uniform
distribution (figure 1(a)). In its second step of explo-
ration, an evolutionary strategy is applied to search
the local neighbourhood of each of the sample points,
to choose their local suboptimal fitness (figure 1(b)).
Finally the local suboptimal is exploited by applying
steepest gradient descent to reach each sample’s local
optima (figure 1(c)). These steps of ME2 are modu-
lar, as each of them independently, can use other suit-
able algorithms with possibly better performance, as
long as the alternative algorithm has the proper aim
for the specific search phase (e.g., exploration or ex-
ploitation).
Algorithm 1: Map Explore Exploit Algorithm.
1: procedure ME2(dimension)
2: noO f Samples ←25
3: noO f Neighbour ← 25
4: f actor ← 10
5: over f actor ← f actor ∗noO f Samples
6: samples ←MAP(dimension, over f actor)
7: lower ← lower limit of fitness function
8: upper ← upper limit of fitness function
9: for s ← 0 to noO f Samples do
10: EX PLORE(samples[s])
11: end for
12: for s ← 0 to noO f Samples do
13: EX PLOIT (samples[s], s)
14: end for
return Point from samples with the best fitness
15: end procedure
2.1 Map
The first step of ME2 begins by generating a set
of points spanning the whole search space. Based
on sample size, set at the start of the algorithm, an
overFactor is defined. Hence, uniformly random dis-
tributed points are generated between the upper and
lower limits of each dimension. The total number
of points are equal to the overFactor which equals
f actor ∗noO f Samples, where f actor = 10. A sam-
ple selection is made from this list of over-factors by
iterating over 10 points at a time and choosing the one
with the best fitness among the ten. The value 10 was
selected randomly, but later kept as such as it has an
impact in total number of evaluations. In this way the
final list of samples is selected. This is the size of
the population. Algorithm 2 describes this process in
detail.
2.2 Explore
The objective of the exploration phase of ME2
(algorithm 3) is to search the local neighbourhood of
each sample point generated from the mapping phase
ME2: A Scalable Modular Meta-heuristic for Multi-modal Multi-dimension Optimization
197

(a) Step 1 Map (b) Step 2 Explore. Iteration 100 (c) Step 3 Exploit. Iteration 200
Figure 1: ME2 execution steps. The above figure shows the three phases of ME2 and the state of the sample points at different
iterations of the algorithm. The plotted function is Ackley (Ackley, 1987). The plot shows the inverse of the Ackley function
so the sample points are visible. Figure 1(a) shows the initial step of mapping. Figure 1(b) shows the steps of neighbourhood
exploration at iteration 100. Figure 1(c) shows the final phase after completion of exploitation where points can be observed
at the global optimum.
Algorithm 2: Step 1: Map.
1: procedure MAP(dimension,over f actor)
2: for f ← 0 to over f actor do
3: for d ← 0 to dimension do
4: completeMap[ f ][d] ← uniform random between upper and
lower
5: end for
6: end for
7: s ←0
8: for f ← 0 to over f actor do
9: samples[s] ← best fitness point between completeMap[ f ] to
completeMap[ f + f actor]
10: s ←s + 1
11: f ← f + f actor
12: end for
return samples
13: end procedure
(sec. 2.1). The algorithm iterates through each sam-
ple point, searching its neighbourhood and replacing
the initial point with its best possible neighbour. Due
to ME2’s modular design, any algorithm that has the
same objective of local neighbourhood search can be
applied during this phase. In our case we used the
DR2 evolutionary strategy.
DR2. In ME2, we applied an evolutionary strategy
which uses a derandomized scheme of mutative step-
size control (Ostermeier et al., 1994). This adapta-
tion concept ’uses information accumulated from the
preceding generations, with an exponential fading of
old information, instead of using information from the
current generation only’. Also termed as DR2 evolu-
tion strategy, this algorithm creates offspring by mu-
tation, which is parametrized by a global step size δ
and local step sizes δ
δ
δ
scal
∈ R
n
(B
¨
ack et al., 2013).
x
0
= x + δ ·δ
δ
δ
scal
⊗z where z = N(0,I) (1)
Algorithm 3: Step 2: Explore.
1: procedure EXPLORE(sample)
2: d ← dimension
3: β ←
p
1/d
4: c ←
p
1/d
5: ζ
ζ
ζ ← {0, ...0}
6: δ ← 1
7: δ
δ
δ ← {1, ...1}
T
8: noO f Generation ←0
9: while noO f Generation < 150 do
10: neighFitnsArr[noO f Neighbors] ← null
11: for n ← 0 to noO f Neighbors −1 do
12: for i ← 0 to d −1 do
13: z
i
← N(0,I)
14: newNeigh ←sample[i] + δ ·δ
δ
δ ⊗z
i
15: if newNeigh within upper and lower then
16: localNeighs[n][i] ← newNeigh
17: end if
18: end for
19: bestLocalNeigh ← best fitness localNeighs[n]
20: neighFitnsArr[n] ← f itness(bestLocalNeigh)
21: end for
22: newBestNeigh ← fitness proportionate selection on
neighFitnsArr
23: if f itness(bestOfAllNeigh) > f itness(newBestNeigh) then
24: bestOfAllNeigh ← newBestNeigh
25: end if
26: ζ
ζ
ζ ← (1 −c) ·ζ
ζ
ζ + c/δ ·(bestOfAllNeigh −sample) ⊗δ
δ
δ
−1
27: δ ← δ ·(exp(
kζ
ζ
ζk
√
d·
q
c
2−c
−1 +
1
5d
))
β
28: δ
δ
δ ←δ
δ
δ ⊗(
|ζ
ζ
ζ
d
|
q
c
2c
+
7
20
)
1/d
29: noO f Generation ←noO f Generation + 1
30: end while
return sample ← bestOfAllNeigh
31: end procedure
DR2 takes into consideration the most successful
mutation of the current and all previous generations.
The vector ζ
ζ
ζ ∈R
n
is used for this accumulation, using
a factor c ∈ (0, 1] to control the weight of previous
generations relative to the current one.
ECTA 2019 - 11th International Conference on Evolutionary Computation Theory and Applications
198

ζ
ζ
ζ
0
= (1 −c) ·ζ
ζ
ζ + c ·z
sel
(2)
The step sizes δ and δ
δ
δ
scal
are adapted based on the
updated mutation path ζ
ζ
ζ
0
.
δ
0
= δ ·(exp(
kζ
ζ
ζ
0
k
√
n
q
c
2−c
−1 +
1
5n
))
β
(3)
δ
0
δ
0
δ
0
scal
i
= δ
δ
δ
scal
i
·(
|ζ
ζ
ζ
0
i
|
q
c
2−c
+
7
20
)
β
scal
∀i ∈ 1,...,n (4)
The parameter c and the exponents β and β
scal
are
expressed as follows,
β =
p
1/n; β
scal
= 1/n; c =
p
1/n (5)
The algorithm for explore (algorithm 3) starts by
initializing the parameters c,β,ζ
ζ
ζ and δ. It then iterates
over a noO f Generation which in our experiments is
set to 150. In each generation, the algorithm initial-
izes a neighFitnsArr which stores the fitness values of
all the neighbours. This array is later used in fitness
proportionate selection of the best neighbour. The
noO f Neighbours parameter, initially set to 25 in our
experiments, is the number of neighbours generated
in each generation. Using equation 1, new neighbours
are generated and evaluated while the fittest neigh-
bour is stored in the neighFitnsArr array. After ex-
iting the inner loop of noO f Neighbours, fitness pro-
portionate selection is applied to the set of best lo-
cal neighbours stored in neighFitnsArr. The selected
neighbour is compared to the current best neighbour
and replaces it if and only if it has greater fitness.
Hence, parameters ζ
ζ
ζ,δ and δ
δ
δ
scal
are updated using
equations 2, 3 and 4. This completes the execution of
one generation. This process repeats for 150 genera-
tions, at the end of which the fittest neighbour among
all the generations takes the place of the original sam-
ple point. This point is then used as the starting point
for the third stage of optimization: Exploit.
2.3 Exploit
In this final phase, a simple gradient descent algo-
rithm is applied to each of the points, to guide it to
its local optimum. The number of generations in this
phase is set to 50. For each generation of each sam-
ple, the algorithm finds the gradient with the steepest
descent, by making a small step forward in one di-
rection and comparing the new point’s fitness to the
previous one. During those small steps, the algorithm
also makes sure the upper and lower limits of the fit-
ness function are not breached. At the conclusion of
this phase, it is hoped that the algorithm would have
found an optimal point, within a small local neigh-
bourhood of every starting point, inherited from the
exploration phase.
Algorithm 4: Step 3: Exploit.
1: procedure EXPLOIT(sample, sIndx)
2: noO f Generation ←0
3: sigma ← 1
4: gradien ← null
5: delta ← 0.001
6: while noO f Generation < 50 do
7: tSample ← sample
8: tSample1 ← sample
9: for i ← 0 to d −1 do
10: delta ← delta ∗sigma[sIndx][i]
11: tSample[i] ← tSample[i] + delta
12: tSample1[i] ← tSample1[i] + delta
13: gradien[i] ←
f itness(tSample1)−fitness(tSample)
2·delta
14: sigma[sIndx][i] ← 0.5
15: end for
16: for i ← 0 to d −1 do
17: tSample[i] ← tSample[i] + sigma[sIndx][i] ∗gradien[i]
18: if (tSample[i] > upper) or (tSample[i] < lower) then
19: tSample[i] ← sample[i]
20: sigma[sIndx][i] ← sigma[sIndx][i]/2
21: end if
22: end for
23: if f itness(tSample) >= f itness(sample) then
24: tSample ← sample
25: for i ← 0 to d −1 do
26: sigma[sIndx][i] ← sigma[sIndx][i]/2
27: end for
28: continue
29: end if
30: sample ← tSample
31: noO f Generation ←noO f Generation + 1
32: end while
return sample
33: end procedure
During exploitation, we chose to apply a simple
method: gradient descent (Kiranyaz et al., 2015). As
previously mentioned, ME2 is modular. So any al-
gorithm capable of finding local optima can poten-
tially replace the gradient descent algorithm we used
for this paper. Whether an alternative algorithm will
perform better or worse is a matter for empirical test-
ing.
3 COMPARISON
The empirical testing of ME2 was performed in com-
parison to four other optimization algorithms. Ge-
netic Algorithms (GA), Particle Swarm Optimization
(PSO), Simulated Annealing (SA) and Covariance
Matrix Adaptation Evolution Strategy (CMA-ES) are
benchmark algorithms in the field of optimization.
ME2: A Scalable Modular Meta-heuristic for Multi-modal Multi-dimension Optimization
199
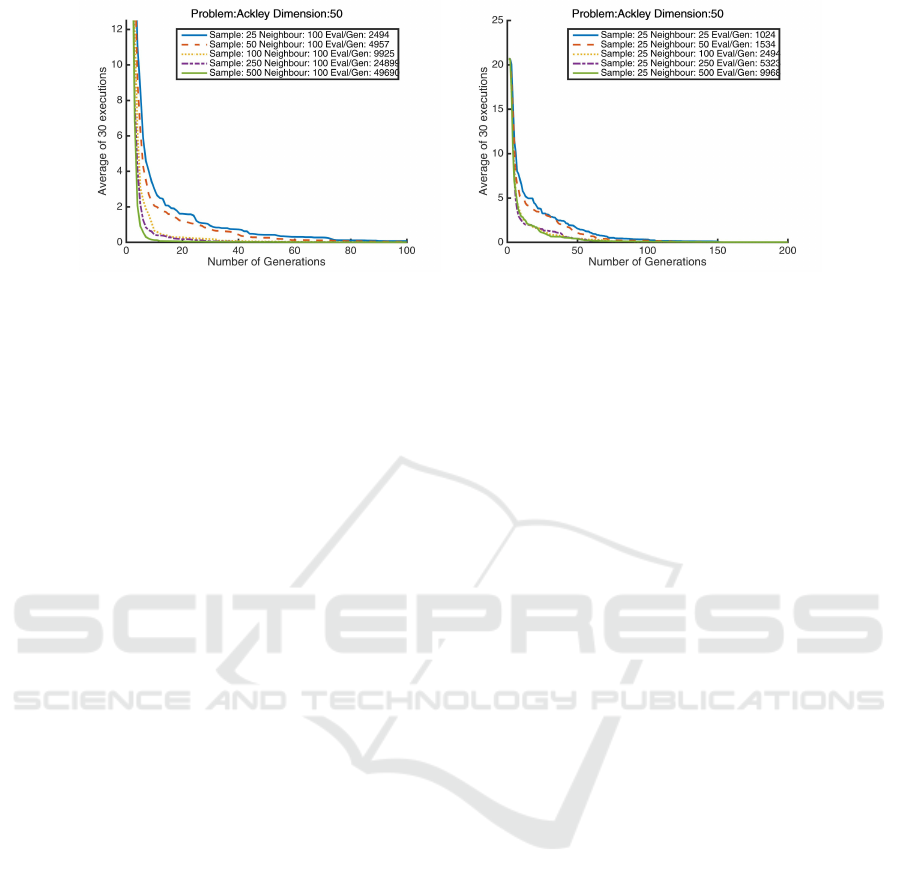
(a) Varying Sample Parameter (b) Varying Neighbourhood Parameter
Figure 2: Varying Parameters: In these figures the x-axis represents the number of generations, while the y-axis represents the
average fitness of 30 runs. As the sample size is increased in 2(a) number of evaluations keep increasing at a high rate, while
improving performance. Figure 2(b) exhibits a situation where the size of the neighbourhood is increased. This improves the
performance of the algorithm as well as the number of evaluations.
We use a standard implementation library named ECJ
(Evolutionary Computation in Java) (Luke, 1998) to
generate the results for the four comparison algo-
rithms (Luke, 2017). ECJ has a complete implemen-
tation of GA, PSO and SA along with most of the
benchmark test functions. For GA and PSO the al-
gorithm implementation is in its original form. The
parameters for these algorithms are also optimized
for the test functions in this library. A list of all the
parameters for all the algorithms used in our tests is
presented in table 2. Source code implementation of
ME2 and ECJ extensions done for this work can be
found at (Islam, 2019).
The results for CMA-ES were gathered from
the implementation by its inventor Nikolaus Hansen,
available at: Inria ( l’institut national de recherche
d
´
edi
´
e aux sciences du num
´
erique) (Hansen, 2007).
The default parameter for initial mean was updated
to a random point within the limits presented in table
1.
4 EXPERIMENTS
The first set of experiments were performed to com-
pare different customizations of ME2, varying two of
its most important parameters, sampleSize (used for
mapping sec. 2.1) and noO f Neighbours (used for ex-
ploring sec. 2.2). After finding the impact of vary-
ing these two parameters, the next step is to compare
ME2 with the four other optimization algorithms. All
executions of ME2 in our experiments are performed
30 times, with the graphs showing the evolution of
average fitness over time.
5 RESULTS AND ANALYSIS
5.1 Parameter Optimization
ME2’s two most important parameters are sampleSize
and noO f Neighbours, both of which have a signifi-
cant impact on its performance. Figure 2 contains the
graph comparing these two parameters. By observing
figure 2(a) we notice, that increasing the number of
samples, increases the number of evaluations signifi-
cantly. This has a direct impact on the performance
of the algorithm, as it results in a reduction in the
number of generations necessary for good optimiza-
tion results. For the experiments in figure 2(a), the
other parameters (such as noO f Neighbours) remain
fixed.
The second parameter that was varied is the
noO f Neighbours in figure 2(b). In this case, it was
observed that as the number of neighbours increase,
the performance of the algorithm improves. This em-
pirical relationship was expected, as increasing the
number of neighbours, increases the algorithm’s abil-
ity to perform denser exploration of a local neighbour-
hood. Increasing the number of neighbours requires
an increase in the number of evaluations, impacting
computational cost.
5.2 Results of Various Dimensions
Here we compare the performance of ME2 with other
optimization algorithms in the field (GA, PSO, SA
and CMA-ES). From the list of benchmark optimiza-
tion problems, a selection was made of problems that
present multi-modal fitness landscapes and can be
ECTA 2019 - 11th International Conference on Evolutionary Computation Theory and Applications
200
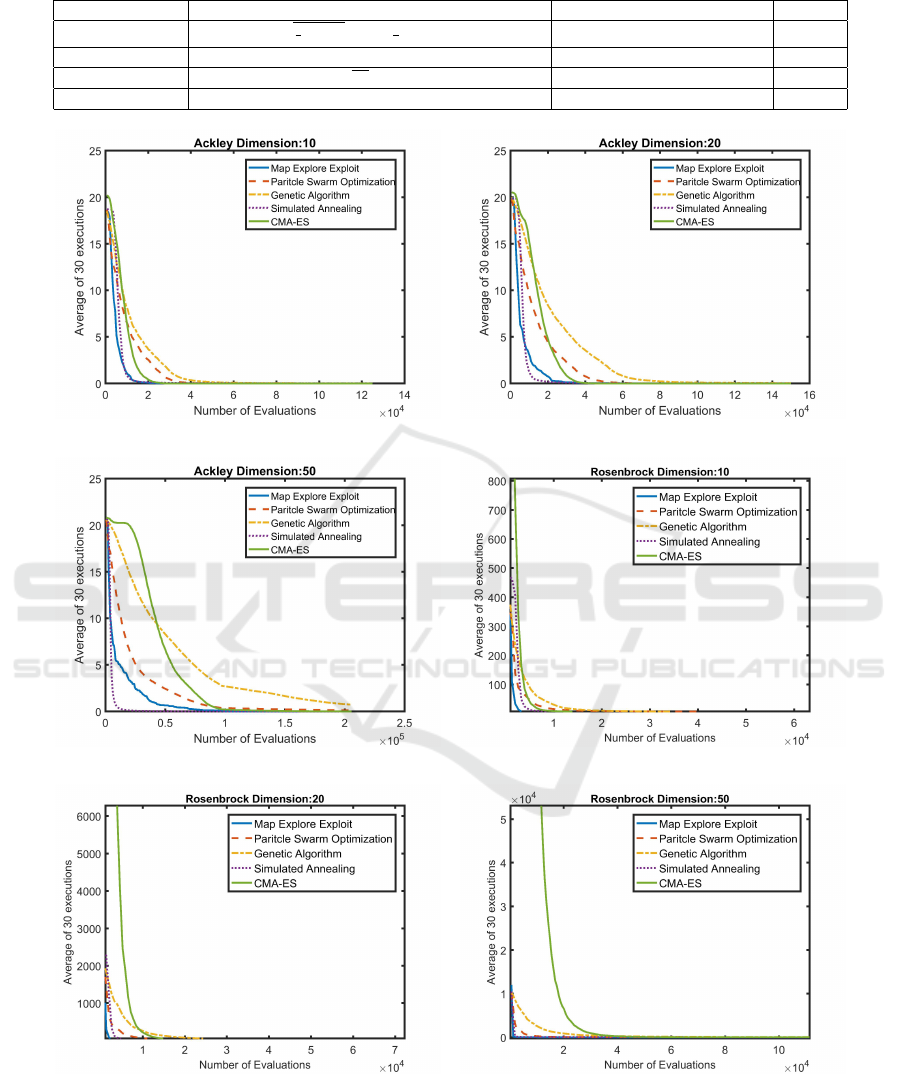
Table 1: Optimization Test Functions.
Name/Ref Function Global Minima Limits
(Ackley, 1987) −20exp(−0.2
q
1
d
∑
d
i=1
x
2
i
) −exp(
1
d
∑
d
i=1
cos(2πx
i
)) + 20 + e f (0,···,0) = 0 ±32.768
(Rosenbrock, 1960)
∑
d−1
i=1
(100(x
2
i
−x
i+1
)
2
+ (1 −x
i
)
2
) f (1,···,1) = 0 ±2.048
(Schwefel, 1981)
∑
d
i=1
(−x
i
sin(
p
|x
i
|)) +418.982887 ·d f (420.968746,···420.968746) = 0 ±512.03
(Rastrigin, 1974) 10d +
∑
d
i=1
(x
2
i
−10cos(2πx
i
)) f (0,···,0) = 0 ±5.12
(a) Ackley 10 dimension (b) Ackley 20 dimension
(c) Ackley 50 dimension (d) Rosenbrock 10 dimension
(e) Rosenbrock 20 dimension (f) Rosenbrock 50 dimension
Figure 3: Average fitness comparison between Map Explore Exploit (ME2), Genetic Algorithm (GA), Particle Swarm Opti-
mization (PSO), Simulated Annealing (SA) and Covariance Matrix Adaptation Evolution Strategy (CMA-ES) for test prob-
lems: Ackley (Ackley, 1987) and Rosenbrock (Rosenbrock, 1960). Test problem input vector dimensions vary between 10
to 50. The x-axis represents the number of evaluations, while the y-axis represents average fitness over 30 runs. It can be
observed that in almost all cases ME2 outperforms GA, PSO, SA and CMA-ES.
ME2: A Scalable Modular Meta-heuristic for Multi-modal Multi-dimension Optimization
201
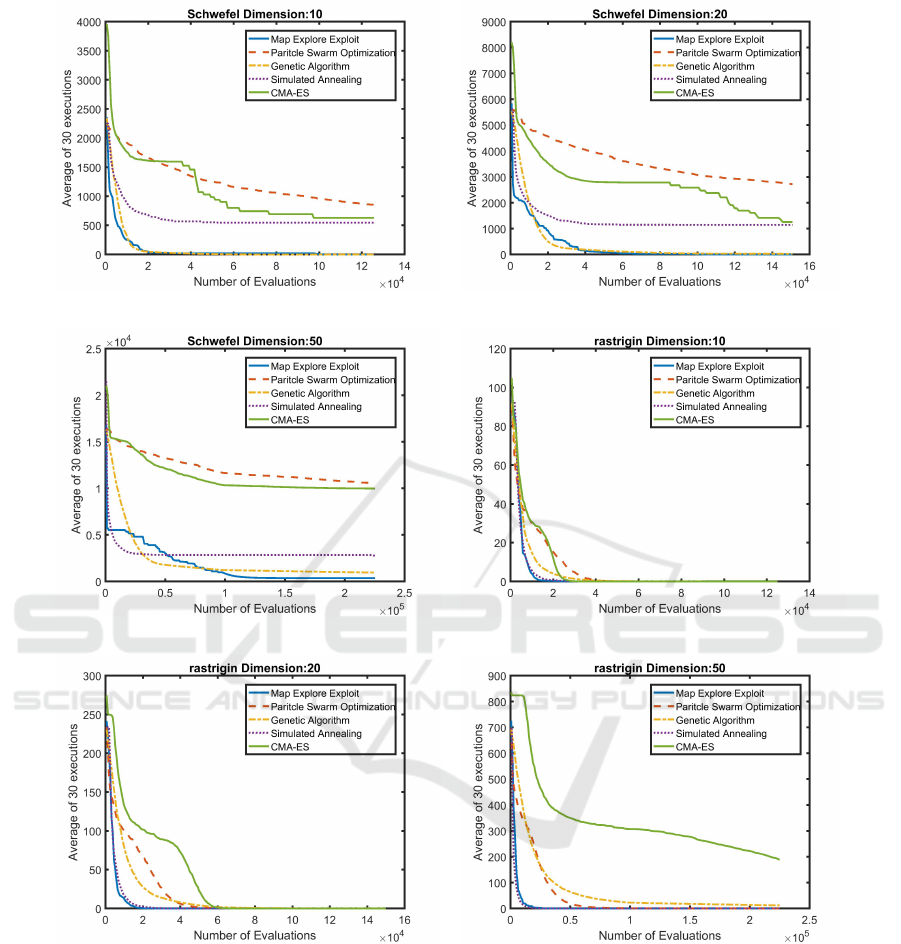
(a) Schwefel 10 dimension (b) Schwefel 20 dimension
(c) Schwefel 50 dimension (d) Rastrigin 10 dimension
(e) Rastrigin 20 dimension (f) Rastrigin 50 dimension
Figure 4: Average fitness comparison between Map Explore Exploit (ME2), Genetic Algorithm (GA), Particle Swarm Opti-
mization (PSO), Simulated Annealing (SA) and Covariance Matrix Adaptation Evolution Strategy (CMA-ES) for test prob-
lems: Schwefel (Schwefel, 1981) and Rastrigin (Rastrigin, 1974). Test problem input vector dimensions vary between 10
to 50. The x-axis represents the number of evaluations, while the y-axis represents average fitness over 30 runs. It can be
observed that in almost all cases ME2 outperforms GA, PSO, SA and CMA-ES.
scaled up to any number of dimensions. Table 1 con-
tains details of these test functions. Figure 3 con-
tains comparison results for dimensions 10 to 50 of
the widely used optimization test functions: Ackley
(Ackley, 1987) and Rosenbrock (Rosenbrock, 1960).
Figure 4 presents comparison results for the test prob-
lems Schwefel (Schwefel, 1981) and Rastrigin (Rast-
rigin, 1974) for dimensions 10 to 50.
To have a fair comparison between ME2, GA,
PSO and CMA-ES, we equalized their number of
evaluations per generation. Table 3 contains the num-
ber of evaluations used per generation for each of
ECTA 2019 - 11th International Conference on Evolutionary Computation Theory and Applications
202

Table 2: Algorithm Parameters.
Algorithm Parameters
Map Explore
Exploit
Sample Size 25
Neighbour Size 25
No. of Generation: Explore 150
No. of Generation: Exploit 50
Genetic
Algorithm
Tournament Size 2
Mutation Probability 0.01
Mutation Type Gaussian
Mutation Standard Deviation 1.0
Particle Swarm
Optimization
Velocity Coefficient 0.7
Personal Coefficient 0.4
Informant Coefficient 0.4
Global Coefficient 0.0
Neighbour Size 10
Simulated
Annealing
Generations 100000
Population 1
Temperature 3000
Mutation Probability 0.017
Mutation Standard Dev. 0.89
Mutation Distribution Index 21
CMA-ES
No. of Generation 200
Initial Mean Random
Standard Deviation 2
Table 3: Number of Evaluations per Generation.
Dimension
Population or
No. of Evaluations
per Generation
No. of
Evaluations
ME2 GA, PSO, CMA-ES SA
10 625 625 500
20 750 750 500
50 1029 1050 1000
these algorithms. For ME2, both the sample size and
number of neighbours was set to 25 (Table 2). For
GA, PSO and CMA-ES, the number of evaluations
per generation is equal to the population size. For
both of these, each individual is evaluated once per
generation. After executing ME2 first, the population
size of GA, PSO and of CMA-ES was set to be equal
to ME2’s number of evaluations per generation.
Having a fair comparison with SA is difficult as
SA uses only one individual per generation, and its
number of evaluations per generation is also one. To
present a fair comparison (figure 3 and 4) the x-axis
represents the number of evaluations, rather than the
number of generations, from the start of evolution.
The y-axis represents the average fitness of 30 runs.
5.3 Analysis
A close analysis of the results in figure 3 and 4, re-
veals that ME2 returns better performance than GA,
PSO and CMA-ES in almost all cases. Also con-
sidering Ackley-20d (3(b)), Ackley-50d (3(c)) and
Schwefel-50d (4(c)) as exceptions, the performance
of ME2 is better or the same as that of SA. Therefore,
one can fairly conclude that ME2 is the best overall
optimizer, over the specific set of test functions and
dimensions, than the set of comparison algorithms.
Algorithm 5: Multi Threaded ME2 Algorithm.
1: procedure ME2 MT(dimension)
2: noO f Samples ←25
3: noO f Neighbour ← 25
4: f actor ← 10
5: over f actor ← f actor ∗noO f Samples
6: samples ←MAP(dimension, over f actor)
7: lower ← lower limit of fitness function
8: upper ← upper limit of fitness function
9: for s ← 0 to noO f Samples do
10: Start new thread, t for samples[s]
11: Join thread t with the main process
12: execute EXPLORE(samples[s]) in thread t
13: execute EXPLOIT (samples[s],s) in thread t
14: end for
return Point from samples with the best fitness
15: end procedure
5.4 Scalability
In addition to modularity and competitive perfor-
mance, the other core advantage of ME2 is its ability
to speed-up its execution, considerably, via parallel
processing. The steps of explore and exploit are per-
formed by ME2 for each point independently of all
other points in the population. So given sufficient re-
sources, one can potentially explore around and max-
imally exploit each point using the resources of one
real/virtual processing node, without having to com-
municate with any of the other nodes. Our implemen-
tation of ME2 is done using Java, for which we used
Java threads for a multi-threaded implementation. Us-
ing a multi core system, we executed both single and
multi-threaded versions, and calculated speed-up in
terms of execution time. In figure 5 speed-up is de-
fined as f
s
/ f
t
, where f
s
is the execution time for the
single-threaded version while f
t
is the execution time
for the multi-threaded version. For the multi-threaded
implementation each sample point runs explore and
exploit on a single thread. So with a sampleSize of
48, there will be 48 parallel threads, running in paral-
lel during exploration and then again during exploita-
tion. For the single threaded implementation, all the
operations on all the points are executed in serial fash-
ion. The results show that overall execution time de-
creased by nearly 7 times as we increased the number
of cores from 3 to 24. It is also worth noting that there
is an approximately linear increase in the speed of ex-
ecution as a function of increasing computing nodes.
Algorithm 5 describes the multi threaded implemen-
tation of ME2.
ME2: A Scalable Modular Meta-heuristic for Multi-modal Multi-dimension Optimization
203
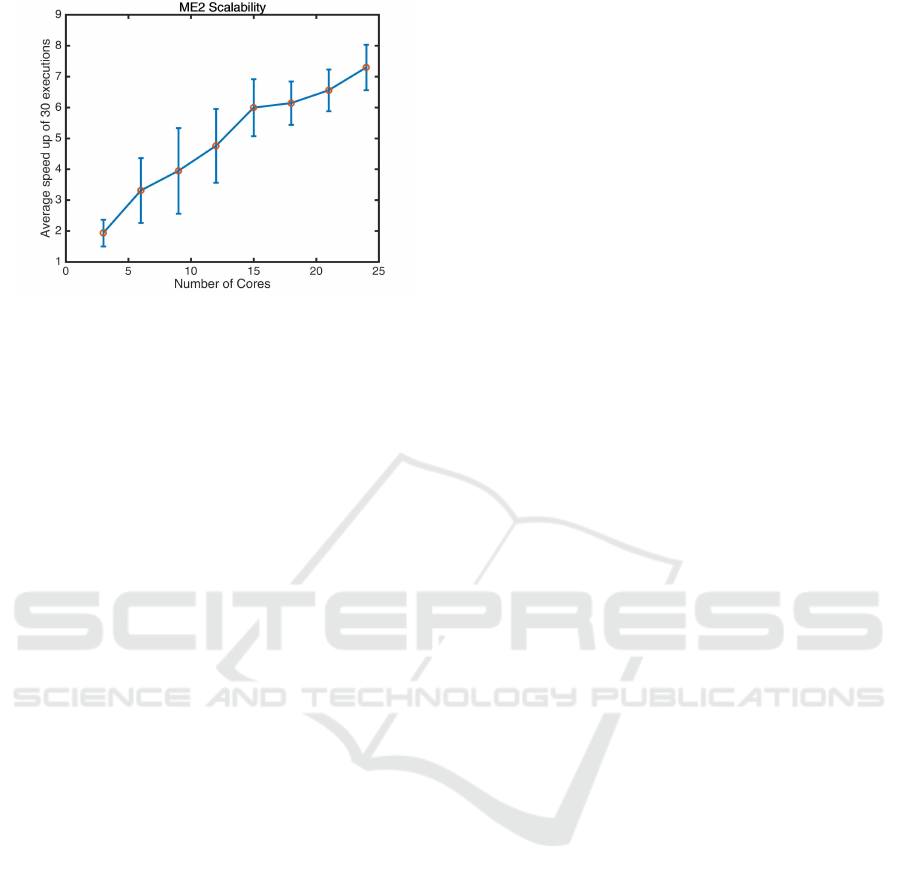
Figure 5: ME2 Scalability using multiple cores. The x-axis
of this graph represents the number of cores employed, from
3 to 24. The Y-axis represents the speed-up of execution
time between single and multi-threaded ME2 implementa-
tions. The multi-threaded implementation of ME2 speeds-
up execution by nearly 7 folds when using 24 cores.
6 CONCLUSION
Map Explore & Exploit is a modular and scal-
able meta-heuristic, suitable for multi-modal multi-
dimension optimization, with better or similar per-
formance to other well-known search & optimization
algorithms. We present the methodology of ME2 in
detail, starting with Map and moving on to Explore
and Exploit. We compare ME2 to GA, PSO, SA and
CMA-ES. The comparison was carried out using sev-
eral scalable benchmark functions. ME2’s competi-
tive results are shown for dimensions 10, 20 and 50.
In addition, we demonstrate the computational scal-
ability of ME2 by comparing a single-threaded ver-
sion and a multiple-threaded one, running in a multi-
core processing environment. The results confirm
that ME2, due to the distributed nature of its last
two phases, is highly scalable. Multi-threaded ME2’s
running time decreases in a near-linear fashion, as
the number of processing nodes increases. Finally,
ME2’s tri-modular architecture allows researchers to
test other - potentially better - algorithms for each
search phase, as long as a proper fitness function is
defined for (the conclusion of) each phase. Exploring
that potential is our next research objective.
REFERENCES
Ackley, D. (1987). A Connectionist Machine for Genetic
Hillclimbing, volume SECS28 of The Kluwer Inter-
national Series in Engineering and Computer Science.
Kluwer Academic Publishers, Boston.
B
¨
ack, T., Foussette, C., and Krause, P. (2013). Contem-
porary Evolution Strategies. Springer-Verlag Berlin
Heidelberg.
Hansen, N. (2007). The cma evolution strategy.
http://cma.gforge.inria.fr/index.html.
Hansen, N. (2009). Benchmarking a BI-population CMA-
ES on the BBOB-2009 function testbed. In Workshop
Proceedings of the GECCO Genetic and Evolutionary
Computation Conference, pages 2389–2395. ACM.
Hansen, N. and Ostermeier, A. (2001). Completely deran-
domized self-adaptation in evolution strategies. Evo-
lutionary Computation, 9(2):159–195.
Holland, J. H. (1992). Adaptation in natural and artificial
systems. MIT Press, Cambridge, MA, USA.
Islam, M. (2019). Me2: Map explore & exploit. version
1.0. https://github.com/mohiul/ME2-Map-Explore-
Exploit/releases.
Kennedy, J. and Eberhart, R. (1995). Particle swarm opti-
mization. In Proceedings of ICNN’95 - International
Conference on Neural Networks, volume 4, pages
1942–1948 vol.4.
Kiranyaz, S., Ince, T., and Gabbouj, M. (2015). Multidi-
mensional Particle Swarm Optimization for Machine
Learning and Pattern Recognition. Springer Publish-
ing Company, Incorporated, 1st edition.
Luke, S. (1998). ECJ evolutionary com-
putation library. Available for free at
http://cs.gmu.edu/∼eclab/projects/ecj/.
Luke, S. (2017). Ecj then and now. In Proceedings
of the Genetic and Evolutionary Computation Con-
ference Companion, GECCO ’17, pages 1223–1230,
New York, NY, USA. ACM.
Metropolis, N., Rosenbluth, A. W., Rosenbluth, M. N.,
Teller, A. H., and Teller, E. (1953). Equation of state
calculations by fast computing machines. The Journal
of Chemical Physics, 21(6):1087–1092.
Ostermeier, A., Gawelczyk, A., and Hansen, N. (1994).
Step-size adaptation based on non-local use of selec-
tion information. In Davidor, Y., Schwefel, H.-P., and
M
¨
anner, R., editors, Parallel Problem Solving from
Nature — PPSN III, pages 189–198, Berlin, Heidel-
berg. Springer Berlin Heidelberg.
Rastrigin, L. A. (1974). Systems of extremal control.
Nauka.
Rosenbrock, H. H. (1960). An automatic method for finding
the greatest or least value of a function. The Computer
Journal, 3(3):175–184.
Schwefel, H.-P. (1981). Numerical Optimization of Com-
puter Models. John Wiley & Sons, Inc., New York,
NY, USA.
ECTA 2019 - 11th International Conference on Evolutionary Computation Theory and Applications
204
