
Estimation of Physical Activity Level and Ambient Condition
Thresholds for Respiratory Health using Smartphone Sensors
Chinazunwa Uwaoma
1
, Gunjan Mansingh
2
, William Pepper
1
, Wenshi Lu
1
and Siyu Xiang
1
1
Center for Information Systems & Technology, Claremont Graduate University, 130 E 9
th
Street, Claremont, CA, U.S.A.
2
Department of Computing, The University of the West Indies, Mona, Kingston 7, Jamaica
gunjan.mansingh@uwimona.edu.jm
Keywords: Physical Activity, Smartphone, Respiratory Health, Signal Magnitude Area, Ambient Conditions.
Abstract: While physical activity has been described as a primary prevention against chronic diseases, strenuous
physical exertion under adverse ambient conditions has also been reported as a major contributor to
exacerbation of chronic respiratory conditions. Maintaining a balance by monitoring the type and the level of
physical activities of affected individuals, could help in reducing the cost and burden of managing respiratory
ailments. This paper explores the potentiality of motion sensors in Smartphones to estimate physical activity
thresholds that could trigger symptoms of exercise-induced respiratory conditions (EiRCs). The focus is on
the extraction of measurements from the embedded motion sensors to determine the activity level and the
type of activity that is tolerable to individual’s respiratory health. The calculations are based on the correlation
between Signal Magnitude Area (SMA) and Energy Expenditure (EE). We also consider the effect of changes
in the ambient conditions – temperature and humidity, as contributing factors to respiratory distress during
physical exercise. Real-time data collected from healthy individuals were used to demonstrate the potentiality
of a mobile phone as a tool to regulate the level of physical activities of individuals with EiRCs. We describe
a practical situation where the experimental outcomes can be applied to promote good respiratory health.
1 INTRODUCTION
The importance of physical activity in promoting
good health cannot be overemphasized.
Rehabilitation therapy for most chronic diseases in
recent times, focuses on physical activity training
protocols with proven efficacy. Nevertheless, high
intensity exercise performed in unfavourable
environments is also known to be a common trigger
of respiratory conditions such as exercise-induced
asthma (EIA), exercise-induced bronchoconstriction
or bronchospasm (EIB), exercise-induced rhinitis
(EIR), and vocal cord dysfunction (VCD) as reported
in these studies (Nielsen et al., 2013; Sinha and
David, 2003). There is a limited capacity to which the
respiratory system can adapt to strenuous physical
training. The phenomena that affect maximum
pulmonary functioning include bronchoconstriction
which occurs in the intrathoracic airways and the
obstruction of the upper airways (extrathoracic)
during intense exercise (Bussotti et al., 2014). And
despite the many benefits of regular physical
exercise, it is paradoxical to note that those
considered to be “highly fit individuals” are more
susceptible to respiratory limitation or distress. This
technically implies that chronic exercise training
results in “faulty adaptation of the lung components”
which negatively affects the respiratory system
(Bussotti et al., 2014, 48). Where such situation
persists, the increased burden and cost of managing
these conditions impact the limited health facilities,
coupled with shortages of health professionals
particularly in remote areas (Braman, 2006; Seto et
al., 2009; Surana et al., 2008). Hence, the need to
maintain a right balance by applying preventive
strategies through consistent monitoring of the level
of exercise and the prevailing ambient conditions that
could predispose such ailments. Remarkably, recent
study has proposed new architecture and protocol to
enhance continuous eHealth monitoring of chronic
illnesses (Lloret et al., 2017).
Though several research efforts have
concentrated on the use of accelerometer sensors for
activity recognition and EE measurements, not so
much attention has been given to the type and the
level of physical activity appropriate for specific
health conditions. This paper focuses on leveraging
measurements from motion sensors in smartphones to
Uwaoma, C., Mansingh, G., Pepper, W., Lu, W. and Xiang, S.
Estimation of Physical Activity Level and Ambient Condition Thresholds for Respiratory Health using Smartphone Sensors.
DOI: 10.5220/0008170001130120
In Proceedings of the 9th International Conference on Pervasive and Embedded Computing and Communication Systems (PECCS 2019), pages 113-120
ISBN: 978-989-758-385-8
Copyright
c
2019 by SCITEPRESS – Science and Technology Publications, Lda. All rights reserved
113

determine the activity threshold suitable for persons
living with EiRCs. We also discuss how variations in
environmental condition can affect physical activity
level and respiratory health of persons with EiRCs. The
key contributions provided by this study are as follows:
(i) Given that smartphones as presently configured
are not able to measure oxygen consumption directly,
we explore and extend the relationship between SMA
and EE to determine the level of physical activity of an
individual in real-time. We consider our approach
more convenient and practically simple as it uses only
measurements from smartphone motion sensors
compared to other methods in previous studies which
require using external sensors and gadgets to estimate
energy expenditure with the attendant practical
limitations.
(ii) We include real-time cross measurement of
variations in the ambient conditions which are noted to
have significant impact on the level of engagement in
physical exercise by persons with EiRCs.
2 RELATED WORK
Rigorous physical activity has been observed as a
major contributor to asthma exacerbation (Bussotti et
al., 2014). It has been observed that asthmatics with
chronic conditions manifest signs of an asthma attack
during exercise (Del Giacco et al., 2015). However,
there are many people without asthma who develop
symptoms only during such exercises like sporting
activities. Milgrom and Taussig (1999) also report that
EIA has higher prevalence among children and young
adults because of their inclinations to participate in
vigorous activities. Though rare, fatal events such as
unexpected death during sports reportedly occur more
frequently among younger professional athletes than
the older ones (Bussotti et al., 2014). A fact sheet from
Minnesota Centre for Health Statistics (2004)
corroborates these reports where the statistics has it that
about 33% of identified school related asthma deaths
between 1990 and 2002 occurred during sporting
events or Physical Education (PE) Class.
Symptoms of VCD and rhinitis also worsen with
highly intensive physical activities performed under
adverse environmental conditions (Bussotti et al.,
2014). It is important to emphasize here that the
severity of EiRCs is related to the type and duration of
the physical exertion, as well as the prevailing ambient
conditions under which such exercises or activities are
performed. Studies in (Bussotti et al., 2014; Del Giacco
et al., 2015), observe that persons with EiRCs have
airways that are very sensitive to changes in
temperature, humidity, and altitude.
Nonetheless, medical experts have advised that
respiratory conditions arising from intense physical
activities, should not be a justification to deny people
an active and healthy lifestyle. Affected individuals
can equally participate in sports competitions if such
conditions are properly managed and controlled
(Milgrom and Taussig, 1999; Bussotti et al., 2014; Del
Giacco et al., 2015). The management and treatment of
respiratory disorders arising during exercise can
benefit from real-time and continuous monitoring;
given the social, emotional and economic impact of
these health conditions on active and competitive
individuals as well as the general populace (Bussotti,
Marco, and Marchese 2014; Randolph 1997;
Newsham et al. 2002; Keles, 2002).
Studies in recent times employ accelerometer-
based measurements for recognition and classification
of various physical activities that can provide vital
information about individual’s health and functional
ability (Casamassima et al., 2014; Kwapisz et al., 2011;
Chung et al., 2008). Some researchers have also
worked on the use of wearable sensors and heart rate
monitors for activity recognition and EE estimation
during non-steady states and transitions (Altini et al.,
2015; Park et al.,2017). In our study, linear motion
extracted from the accelerometer measurement is used
to determine the patient’s level of exercise or physical
activity. We also included other motion sensors
(gyroscope and digital compass) facilitated by a sensor
fusion technique; to generate more intelligent and
useful information such as postural changes which may
not be provided by using only accelerometer sensor in
real-time scenarios. In addition, we used the embedded
hygrometer and thermometer in smartphone to record
changes in ambient conditions which could contribute
to respiratory distress during intense physical activity.
By placing the mobile phone securely and strategically
on the body trunk, the monitoring system transforms
the device motion to body motion. Recordings from
smartphone sensors are computed and analyzed to
measure deviation from the normal baseline of
measured quantities.
3 MEASUREMENTS FROM
SMARTPHONE SENSORS
3.1 Monitoring Physical Activity Level
Monitoring physical activity is recommended as a
therapy or rehabilitation approach for persons
recovering from cardiac and other related diseases
(Kwapisz et al. 2011; Chung et al., 2008). Authors in
PECCS 2019 - 9th International Conference on Pervasive and Embedded Computing and Communication Systems
114

(Karunanithi et al., 2009) observed that assessment of
physical activity of the patient is often by self-
reporting, diary, and a 6-minute walk test (6MWT)
mostly performed at the hospital exercise clinic or
laboratories, using the traditional measure of
Metabolic Equivalent Task (MET). Karunanithi et al.
(2009) however, proposed an alternative approach to
measure physical activity for a home-based care of
convalescing patients, where they used MET
estimates derived from accelerometer monitors for
assessing patients’ 6MWT.
The advantages of using an accelerometer sensor
for objective measurement and estimation of energy
cost by movement intensity include its small size,
portability, and low power utilization. In (Karunanithi
et al., 2009), the authors demonstrate that MET can
be derived from accelerometer data which has a high
linear correlation (r
2
= 0.88) with energy expenditure
derived from simultaneous measurement of oxygen
consumption (VO
2
) via conventional gas analyzer.
The accelerometer measurement is defined by the
signal magnitude area (SMA) in equation (1) while
the oxygen consumption is measured by the breath
gas analysis. The relationship between the two
quantities is shown in equation (2) (Karunanithi et al.,
2009).
SMA =
∫
(𝐴𝑐𝑐𝑋
(
𝑡
)
+ 𝐴𝑐𝑐𝑌
(𝑡)
+ 𝐴𝑐𝑐𝑍
(𝑡)
)
(1)
VO
2
= 1.1 * SMA + 5.7
(2)
MET values are estimated from the regression
model by averaging the acceleration measurement
and oxygen consumption over a period of time. The
intensity of physical activities ranges from sedentary
(≤ 1.5 METs) to vigorous (> 6 METs). 1 MET is
equivalent to oxygen uptake while sitting "quietly"
(Chuang et al., 2013; Compendium of Physical
Activities, 2018).
In our study, the basic metric used in modelling
the physical activity level is the movement intensity
which measures the instantaneous movement
obtained from acceleration signals of the
smartphone’s built-in accelerometer. However, since
the measurement is to be obtained over a given
interval rather than momentary, we considered SMA
which provides an approximate measurement of
energy cost. SMA has been extensively used in
previous studies for two purposes – tracking or
predicting energy expenditure and discriminating
between active and resting states (Chung et al., 2008;
Karunanithi et al., 2009). We adopted the SMA
metric for the categorization of the physical activity
levels because studies have shown that it has a high
Figure 1: Linear regression and correlation of extrapolated
EE values from SMA measurements in the study.
linear correlation with metabolic rate (MET value),
which is widely accepted as a standard measure for
movement intensity and energy expenditure (Chuang
et al., 2013). Table 1 shows empirically estimated
SMA values based on this relationship as documented
in Compendium of Physical Activities (2018). The
correlation between EE and SMA values obtained
from our study is shown in Figure 1. This is a
replication of the study outcome in (Karunanithi et
al., 2009).
Monitoring the level of physical activity of
persons with EiRCs becomes necessary due to the
fundamental role played by vigorous exercise in the
inflammation of the lung airways (Del Giacco et al.,
2015), which largely contributes to the exacerbation
of these conditions. Consistent monitoring of the
physical activity level of the affected persons
particularly during adverse weather conditions, will
help them maintain their active lifestyle and to also
participate in top sporting competitions. Interestingly,
moderate exercise is being recommended “as a
potential therapeutic tool” for persons with EiRCs
(Del Giacco et al., 2015).
Table 1: Empirically Estimated SMA Values.
SMA
Range
Designated
Activity Level
Examples of Activity
Type
0.0 - 1.50
Sedentary
Sitting, Standing,
Lying
1.51 – 9.0
Low
Walking, Yoga,
Shopping, etc.
9.1-18.0
Moderate
Jogging, Hiking,
Climbing Stair Case,
Callisthenics, etc.
Above
18.0
Vigorous
Bicycling, Running,
Treadmill, etc.
y = 1.3247x
R² = 0.8876
0
10
20
30
40
50
60
0 10 20 30 40 50
Energy Expenditure (EE)
Signal Magnitude Area (SMA)
Linear Regression Plot of SMA and EE Quantities
Estimation of Physical Activity Level and Ambient Condition Thresholds for Respiratory Health using Smartphone Sensors
115
3.2 Capturing Ambient Data
Typical circumstances that can accentuate respiratory
distress during vigorous exercise are the type and
level of physical activity as well as the prevailing
environmental conditions. It has been reported that
changes in ambient temperature and relative humidity
affect the health of persons with EiRCs. Ideal ambient
temperature and relative humidity for respiratory
health is rated between: 69
o
F and 79
o
F – temperature;
and 35% and 50% - relative humidity (Venta, n.d;
BREATHE- the lung association, n.d).
Breathing in cold and dry air during heavy
exercise poses a risk for the development of
symptoms of EiRCs (Bussotti et al., 2014; Del Giacco
et al., 2015). Embedded ambient sensors in modern
mobile phones now provide direct measurement of
changes in ambient temperature and humidity. Such
information can be used to determine conducive
weather for engaging in vigorous and prolonged
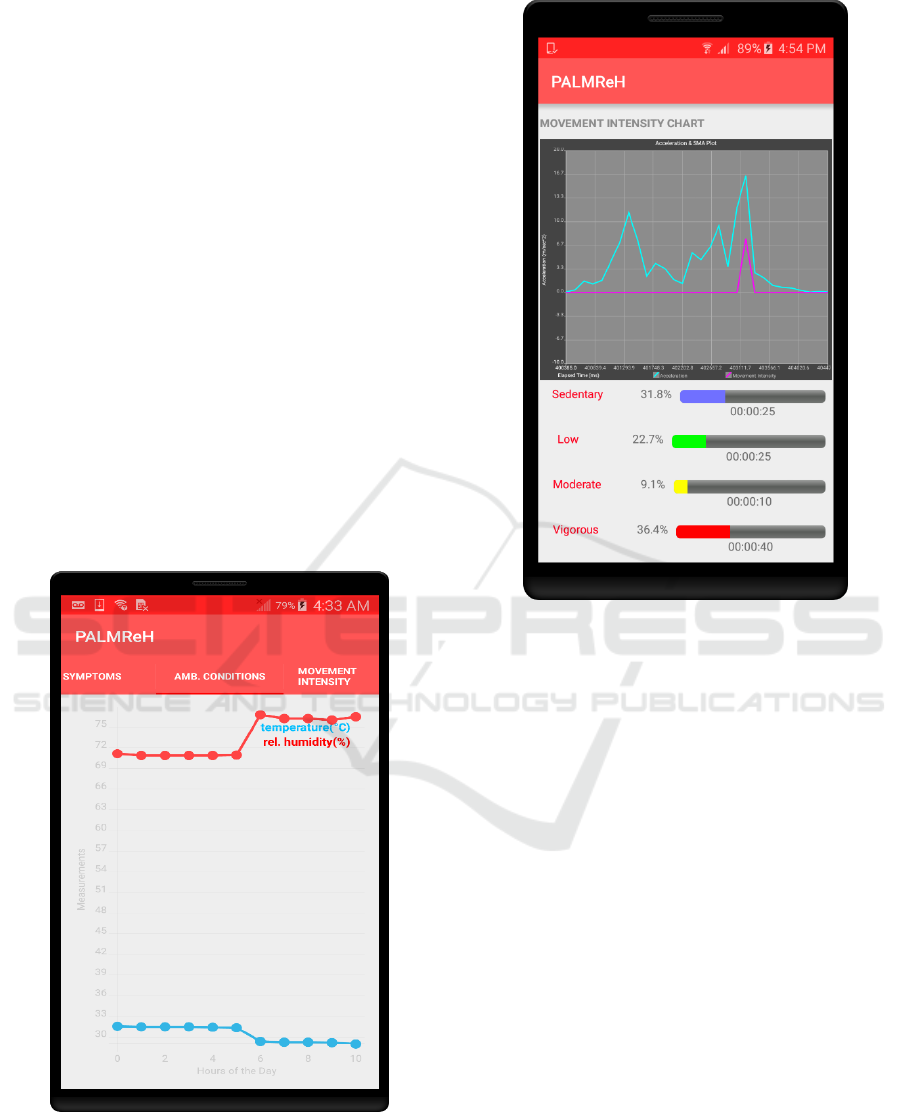
physical training. In our study, the real-time capturing
of ambient condition – temperature and relative
humidity on a smartphone is displayed on the chart in
Figure 2.
Figure 2: Measurements of ambient temperature and
relative humidity captured by the monitoring device.
Figure 3: Real-time detection and classification of physical
activity levels by the monitoring device.
4 EXPERIMENTAL OUTCOMES
In this section, we describe the implementation of the
physical activity monitoring on a smartphone. Two
quantities of interest in the activity recognition are
estimated using the motion sensors. These quantities
are posture change obtained from the orientation
measurement and activity level provided by the linear
motion parameter. The architecture and the analytical
models for these two quantities are described in our
previous work (Uwaoma and Mansingh, 2014;
Uwaoma and Mansingh, 2018b). The linear
movement is represented by the readings of the three
accelerometer axes as follows:
z-axis: captures forward movement;
y-axis: captures upward/downward
movement and
x-axis: captures horizontal movement.
PECCS 2019 - 9th International Conference on Pervasive and Embedded Computing and Communication Systems
116

Table 2: Samples of recorded SMA values extrapolated to
EE equivalent with designated Activity Levels.
SMA (ms
-2
)
EE (VO
2
)
Activity Level
0.986008
6.784609
Sedentary
1.94435
7.838785
Sedentary
0.879925
6.667917
Sedentary
15.5243
22.77673
Moderate
40.58631
50.34494
Vigorous
26.91364
35.305
Vigorous
21.22344
29.04579
Vigorous
2.663409
8.62975
Low
0.935883
6.729471
Sedentary
2.273131
8.200444
Low
3.30391
9.3343
Low
2.463069
8.409376
Low
2.772076
8.749284
Low
1.191858
7.011044
Sedentary
0.69416
6.463576
Sedentary
0.795958
6.575553
Sedentary
2.134268
8.047695
Low
2.250499
8.175549
Low
1.116092
6.927701
Sedentary
2.974935
8.972429
Low
2.019332
7.921265
Low
0.973806
6.771186
Sedentary
1.028279
6.831107
Sedentary
0.338428
6.072271
Sedentary
0.39571
6.135281
Sedentary
0.464635
6.211099
Sedentary
1.649994
7.514993
Low
2.114025
8.025427
Low
In the experimental test that was performed on the
Android platform, we used equation (1) for
calculating the SMA values based on the periodical
readings on each of the accelerometer’s axes. The
sampling period was 5000ms which produced 25
samples based on the DELAY_NORMAL
accelerometer sampling rate for android devices. To
eliminate the low frequency noise and drifts
associated with accelerometer sensor due to its
gravity component, a high-pass filter was applied to
extract the linear acceleration which was the quantity
used to compute the SMA values. Table 2 shows
samples of SMA values recorded in real time.
For posture change, the orientation or attitude
data is measured in degrees (between 0
o
and 180
o
)
which is derived from the fused orientation data of the
three sensors- gyroscope, accelerometer and
magnetometer. Evaluating the posture of the trunk
after the user has undergone a burst of energetic or
vigorous exercise helps to ascertain if there are
remarkable degree of posture variations in terms of
the user bending forward or tilting sideways in order
to get sufficient air in the event of airway obstruction.
The activity level recognition algorithms have been
implemented in real life as shown in Figures 3 and 4.
The y-axis in Figure 3 displays the acceleration
measured in meter per second squared (ms
-2
), while
the x-axis displays time in milliseconds. The line plot
in magenta represents the SMA for a given period.
Below is a pseudocode implemented in Android
program code used to generate the information
displayed in Figure 3:
Set up a counter for each activity
level detected
Initialize each of the counters to zero
Initialize the total duration in
(ms)for each activity level to zero
Define the sample_period (Android
sampling rate for DELAY_NORMAL is
assumed here)
Set the current activity level to an
empty string
Compute the SMA value for each sampling
period
//Compare the SMA values with the
defined ranges for each activity level
if (SMA value > 0.0 and <= 1.5):
Increment sedentary_counter
sedentary_total_duration =
sedentary_counter * sample_period
Convert sedentary_total_duration
to (HH:MM:SS)
Set current_activity_level to
“Sedentary”
else if (SMA value > 1.5 and <= 9.0):
Increment low_counter
low_total_duration = low_counter *
sample_period
Convert low_total_duration to
(HH:MM:SS)
Set current_activity_level to
“Low”
else if (SMA value > 9.0 and <= 18.00):
Increment moderate_counter
moderate_total_duration =
moderate_counter * sample_period
Convert moderate_total_duration to
(HH:MM:SS)
Set current_activity_level to
“Moderate”
Estimation of Physical Activity Level and Ambient Condition Thresholds for Respiratory Health using Smartphone Sensors
117
else if (SMA value > 18.00):
Increment vigorous_counter
vigorous_total_duration =
vigorous_counter * sample_period
Convert vigorous_total_duration to
(HH:MM:SS)
Set current_activity_level to
“Vigorous”
Return current_activity_level
EiRCs such as EIA and EIB are associated with
shortness of breath. For instance, it has been observed
that person experiencing asthma distress tends to lean
forward in an effort to get sufficient air into the lungs;
which invariably makes the person assume an
inclined position (Uwaoma and Mansingh, 2018b;
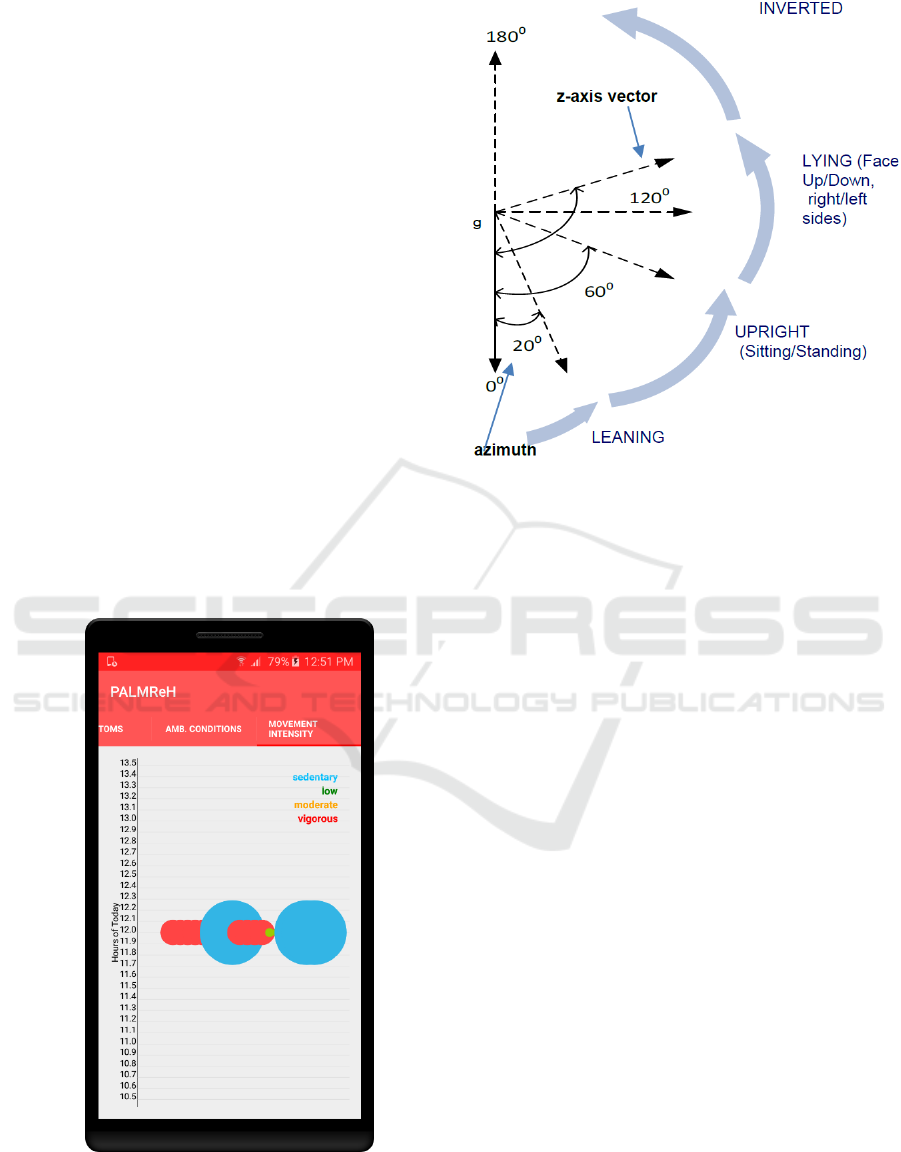
WebMD, n.d.).The implementation of the algorithm
for postural changes is yet to be tested in real-time;
however, we modelled the outcomes graphically as
shown in Figure 5. In the model we used the z- axis
orientation or tilt angle from the sensor fusion to
classify bodily position into four categories:
Upright position
Leaning
Lying
Inverted
Figure 4: A bubble chart displaying the intensity aggregate
of each activity level at given hours of the day.
Figure 5: Graphical Modelling of Postural Change.
5 SITUATIONAL APPLICATION
OF THE PRELIMINARY
RESULTS
Here we illustrate a typical practical situation where
the preliminary results from the experimental tests
can be applied. Asthma persistence and severity are
reported to be associated with weight gain in both the
paediatric and adult population. (Boulet and
Cormiers, 2007, American Lung Association, 2016).
Given a scenario where an individual has been
diagnosed with obesity and one of the recommended
therapies by the physician is regular body exercise;
yet, this individual is also diagnosed with a
respiratory condition – EIA. Two questions that beg
for answers are: Would the patient discountenance the
recommended therapy so as to avoid aggravating the
respiratory condition? or would the patient engage in
prolong body training despite his respiratory
condition so as to lose weight as fast possible? The
answer to both questions is NO. How to maintain a
balance between the two options is where continuous
monitoring of the individual’s level of physical
activity comes into play.
Using the proposed framework, the monitoring
device can identify the type and level of physical
activity, posture changes, as well variations in the
ambient conditions that are not conducive for the
individual’s respiratory condition, and then signal
warnings for the person to take necessary actions to
PECCS 2019 - 9th International Conference on Pervasive and Embedded Computing and Communication Systems
118

avert exacerbation of his or her condition.
Comprehensive details on how the monitoring tool
would work to provide such vital information is
described in (Uwaoma and Mansingh, 2018a).
6 CONCLUSIONS
In this study, we described a framework for
determining physical activity threshold for
respiratory health, particularly for persons living with
EiRCs. We demonstrate how smartphones can be
configured to provide a user with vital information
with respect to his activity level while engaging in a
physical exercise as well as changes in ambient
conditions that may contribute to the exacerbation of
respiratory distress during physical activity. The
major advances include the ability of the proposed
system to concurrently capture the two measurements
emphasized here – physical activity level and
variations in the environmental parameters,
benchmarked on standard measures in the study
domain. To the best of our knowledge, we are yet to
find related work that have considered this approach.
However, the focus was on maintaining a balance
between engaging in regular physical exercises and
managing respiratory ailments that may result from
such exercises. This is an on-going study and in our
future work, we hope to incorporate measurements
like respiratory rate which is a known useful metric
for determining a person’s respiratory health status.
REFERENCES
Altini, M., Penders, J. and Amft, O., 2015. Estimating
Oxygen Uptake During Non-Steady-State Activities
and Transitions Using Wearable Sensors. IEEE Journal
of Biomedical and Health Informatics, 20(2), 469-475.
American Lung Association, 2016. The Link between
Asthma and Weight, viewed 20 May 2019.
https://www.lung.org/about-us/blog/2016/07/the-link-
between-asthma-weight.html.
Boulet, L.P. and Cormiers, A.D., 2007. The link between
obesity and asthma: a Canadian perspective. Canadian
Respiratory Journal, 14(4), 217-220.
Braman, S. S., 2006. The Global Burden of Asthma. Chest
Journal 130(suppl_1), 4S-12S.
BREATHE - the lung association. n.d. Heat and Humidity,
viewed 20 May 2019. https://www.lung.ca/news/
expert-opinions/pollution/heat-and-humidity.
Bussotti, M., Di Marco, S. and Marchese, G., 2014.
Respiratory Disorders in Endurance Athletes–How
Much Do They Really Have to Endure? Open Access
Journal of Sports Medicine 5, 47-63.
Casamassima, F., Ferrari, A., Milosevic, B., Ginis, P.,
Farella, E. and Rocchi, L., 2014. A Wearable System
for Gait Training in Subjects with Parkinson’s Disease.
Sensors, 14(4), 6229-6246.
Chuang, F.C., Yang, Y.T.C. and Wang, J.S., 2013.
Accelerometer-based Energy Expenditure Estimation
Methods and Performance Comparison. In
Proceedings of the 2nd International Conference on
Advances in Computer Science and Engineering (CSE
2013), Atlantis Press. 99-103.
Chung, W.Y., Purwar, A. and Sharma, A., 2008. Frequency
Domain Approach for Activity Classification Using
Accelerometer. In Proceedings of the 30th Annual
International Conference - Engineering in Medicine
and Biology Society (EMBS 2008), IEEE. 1120-1123.
Compendium of Physical Activities. 2011, viewed 05
January 2018. https://sites.google.com/site/
compendiumofphysicalactivities.
Del Giacco, S.R., Firinu, D., Bjermer, L. and Carlsen, K.H.,
2015. Exercise and Asthma: An Overview. European
Clinical Respiratory Journal, 2(1), 27984.
Karunanithi, M., Bidargaddi, N. and Sarela, A., 2009.
Determination of 6-minute Walk Test Using
Accelerometer-Based Ambulatory Monitoring Device
for the Assessment of Patient’s Progress in Cardiac
Rehabilitation. In World Congress on Medical Physics
and Biomedical Engineering, Springer, Berlin
Heidelberg. 540-542.
Keleş, N. 2002. Treating Allergic Rhinitis in the Athlete.
Rhinology 40(4), 211-214.
Kwapisz, J.R., Weiss, G.M. and Moore, S.A., 2011.
Activity Recognition Using Cell Phone
Accelerometers. ACM SigKDD Explorations
Newsletter, 12(2), 74-82.
Lloret, J., Parra, L., Taha, M. and Tomás, J., 2017. An
Architecture and Protocol for Smart Continuous
eHealth Monitoring Using 5G. Computer Networks,
129, 340-351.
Milgrom, H. and Taussig, L.M., 1999. Keeping Children
with Exercise-Induced Asthma Active. Paediatrics
104(3), e38- e38.
Minnesota Center for Health Statistics. 2004, viewed 19
May 2015. http://www.health.state.mn.us/
asthma/documents/pppresent/pehebasics.ppt.
Newsham, K.R., Klaben, B.K., Miller, V.J. and Saunders,
J.E., 2002. Paradoxical Vocal-Cord Dysfunction:
Management in Athletes. Journal of Athletic Training
37(3), 325.
Nielsen, E. W., Hull, J.H., and Backer V. 2013. High
Prevalence of Exercise-Induced Laryngeal Obstruction
in Athletes. Medicine and Science in Sports and
Exercise, 45(11), 2030-2035.
Park, H., Dong, S.Y., Lee, M. and Youn, I., 2017. The Role
of Heart-Rate Variability Parameters in Activity
Recognition and Energy-Expenditure Estimation Using
Wearable Sensors. Sensors, 17(7), 1698
Seto, E.Y., Giani, A., Shia, V., Wang, C., Yan, P., Yang,
A.Y., Jerrett, M. and Bajcsy, R., 2009. A Wireless
Body Sensor Network for the Prevention and
Management of Asthma. In Proceedings of IEEE
Estimation of Physical Activity Level and Ambient Condition Thresholds for Respiratory Health using Smartphone Sensors
119

International Symposium on Industrial Embedded
Systems (SIES'09), IEEE. 120-123.
Sinha, T. and David, A.K. 2003. Recognition and
Management of Exercise-Induced Bronchospasm.
American Family Physician, 67(4), 769-774.
Surana, S., Patra, R., Nedevschi, S. and Brewer, E., 2008.
Deploying a Rural Wireless Telemedicine System:
Experiences in Sustainability. Computer 41(6), 48-56.
Uwaoma, C. and Mansingh, G., 2014. Using Embedded
Sensors in Smartphones to Monitor and Detect Early
Symptoms of Exercise-induced Asthma. In Sensornets.
145-150.
Uwaoma, C. and Mansingh, G., 2018a. Certainty Modeling
of a Decision Support System for Mobile Monitoring of
Exercise-induced Respiratory Conditions. In
Proceedings of the 51st Hawaii International
Conference on System Sciences. 2958-2966.
Uwaoma, C. and Mansingh, G., 2018b. Proposing A
Decision Support System for Automated Mobile
Asthma Monitoring in Remote Areas. Information
Technology for Development, 24(2),301-314.
Venta. n.d. What Is an Ideal Air Humidity Level for Health?
viewed 20 May 2019. https://venta-usa.com/ideal-
humidity-level.
WebMD. n.d. Signs of a Pending Asthma Attack, viewed
09 May 2015. http://www.webmd.com/asthma/
asthma-symptoms-7/slideshow-asthma-attack.
PECCS 2019 - 9th International Conference on Pervasive and Embedded Computing and Communication Systems
120
