
Discussion-skill Analytics with Acoustic, Linguistic and
Psychophysiological Data
Katashi Nagao
1
, Kosuke Okamoto
1
, Shimeng Peng
1
and Shigeki Ohira
2
1
Graduate School of Informatics, Nagoya University, Nagoya, Japan
2
Information Technology Center, Nagoya University, Nagoya, Japan
Keywords: Evaluation of Discussion Skills, Discussion Mining, Machine Learning, Learning Analytics.
Abstract: In this paper, we propose a system for improving the discussion skills of participants in a meeting by
automatically evaluating statements in the meeting and effectively feeding back the results of the evaluation
to them. To evaluate the skills automatically, the system uses both acoustic features and linguistic features of
statements. It evaluates the way a person speaks, such as their “voice size,” on the basis of the acoustic features,
and it also evaluates the contents of a statement, such as the “consistency of context,” on the basis of linguistic
features. These features can be obtained from meeting minutes. Since it is difficult to evaluate the semantic
contents of statements such as the “consistency of context,” we build a machine learning model that uses the
features of minutes such as speaker attributes and the relationship of statements. In addition, we argue that
participants’ heart rate (HR) data can be used to effectively evaluate their cognitive performance, specifically
the performance in a discussion that consists of several Q&A segments (question-and-answer pairs). We
collect HR data during a discussion in real time and generate machine-learning models for evaluation. We
confirmed that the proposed method is effective for evaluating the discussion skills of meeting participants.
1 INTRODUCTION
One of the most familiar types of intellectual and
creative activities is discussion at meetings. There is
great significance in analyzing discussion in a
scientific way and evaluating the participants’
discussion skills.
Discussion skills are complex abilities, and it is
difficult at present to be clearly defined as “the ability
to do …” Therefore, it is not appropriate to evaluate
with a single indicator. However, based on some
objective data, it is possible to promote skill
improvement by giving feedback to the subject. This
research is one of the case studies.
We propose and implement a method for
evaluating the discussion ability of students in
meetings in a university laboratory setting. There are
roughly three kinds of evaluation methods:
(1) One based on acoustic information, that is, the
manner of speaking.
(2) One based on language information, that is, the
contents of speech.
(3) One based on mental state, that is, a speaker’s
psychophysiological information, such as heart rate.
Method (1) evaluates the appropriateness of
utterances in a discussion by using the acoustic
characteristics of speech. The characteristics are
automatically evaluated in real time and fed back to
speakers during a meeting. For example, we measure
the voice size (loudness), voice intonation, speech
speed, fluency, tempo, and other vocal aspects of a
speaker and automatically evaluate the acoustic
appropriateness of the statements. If anything is
determined to be inappropriate, the system provides
feedback to the speaker in several ways, such as with
a message popping up on a screen. Method (2)
analyzes linguistic characteristics in consideration of
context. For example, we estimate the consistency of
the context of statements by using machine learning
techniques. Then, the linguistic appropriateness of the
statements is automatically evaluated. Method (3)
estimates the degree of self-confidence of speech by
measuring the heart rate while speakers participate in
question-and-answer sessions. In addition, we check
whether there is a correlation between the degree of
confidence and the appropriateness of statements.
Then, we evaluate the mental appropriateness of the
statements.
We believe that carefully examining these three
methods over a period of time will result in a more
Nagao, K., Okamoto, K., Peng, S. and Ohira, S.
Discussion-skill Analytics with Acoustic, Linguistic and Psychophysiological Data.
DOI: 10.5220/0008332304090418
In Proceedings of the 11th International Joint Conference on Knowledge Discovery, Knowledge Engineering and Knowledge Management (IC3K 2019), pages 409-418
ISBN: 978-989-758-382-7
Copyright
c
2019 by SCITEPRESS – Science and Technology Publications, Lda. All rights reserved
409
detailed analysis that helps us focus on more
appropriate training for students.
Students’ improvement in discussion ability is
evaluated in subsequent training. Discussion-skill
training is carried out through a repeat cycle that
consists of notifying a person of a problem and giving
advice via e-mail prior to a meeting, evaluating
statements during the meeting, and the person
reflecting and making improvements after the
meeting.
2 DISCUSSION MINING
Seminar-style meetings that are regularly held at
university laboratories are places where exchanges of
opinions on research occur. Many comments on
future work are included in the meeting records.
However, as discussions at meetings are generally not
recorded in detail, it is difficult to use them for
discovering useful knowledge. Our laboratory
developed and uses a discussion mining (DM) system
that records the content of face-to-face meetings
while providing metadata (Nagao et al., 2004).
Looking back on the challenges presented in remarks
is essential for setting new goals in activities, but their
existence may be buried in many other remarks in the
minutes.
In our laboratory at Nagoya University, we have
used this DM system to record detailed meetings in
the laboratory for over 10 years. The system enables
all participants to cooperate together to create and use
structured minutes. It is not fully automated, i.e., a
secretary manually writes down the contents of
speech, and each speaker tags his/her speech.
Therefore, we can generate data with high accuracy.
The meeting style supported by the DM system is
one in which a presenter explains a topic while
displaying slides, and Q&A with the meeting
participants is either conducted during or at the end of
the presentation.
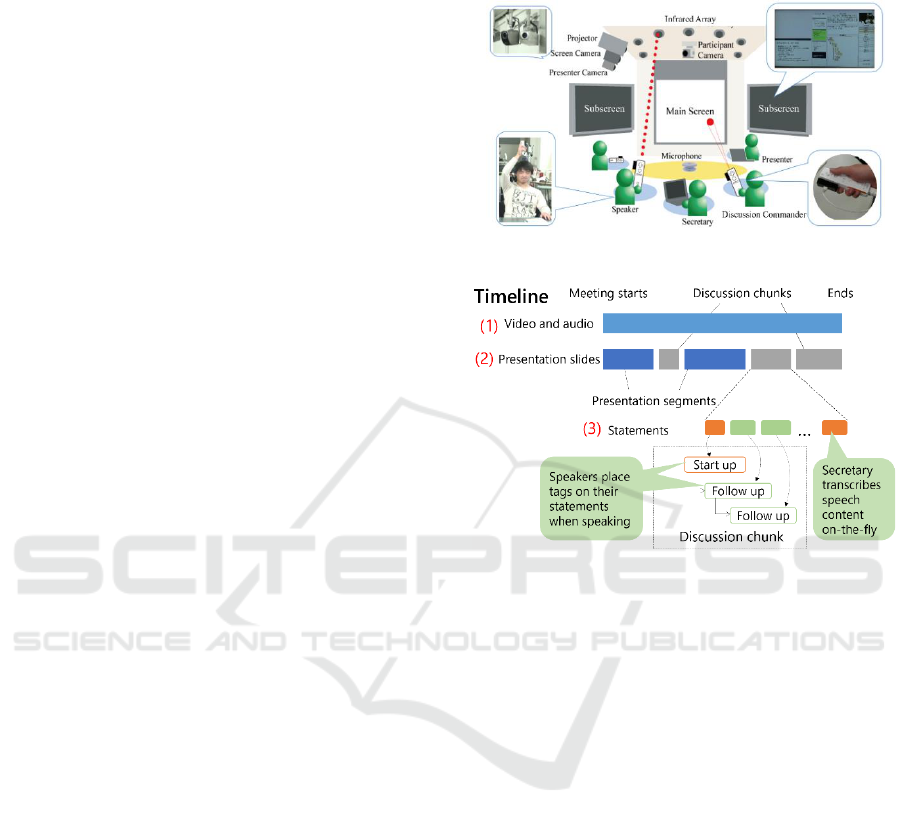
Specifically, using multiple cameras and a
microphone installed in a discussion room, as shown
in Figure 1, and a presenter/secretary tool we created,
we record discussion content. In the center of the
discussion room, there is also a main screen that
displays presentation materials and demonstration
videos, and on both sides, there are subscreens for
displaying information on and images of the
participants who are currently speaking.
The DM system records slide presentations and
Q&A sessions including participants while
segmenting them in time. As a result, content
(discussion content), as shown in Figure 2, is
recorded and generated.
Figure 1: Overview of discussion mining system.
Figure 2: Structured discussion content.
Every participant inputs metadata about his/her
speech by using a dedicated device that is called a
“discussion commander,” as shown in the lower right
of Figure 1. Participants who specifically ask
questions or make comments on new topics assign
start-up tags to their statements. Also, if they want to
speak in more detail on topics related to the
immediately preceding statement, they provide a
follow-up tag. Furthermore, the system records
pointer coordinates, the location of figures and texts
in a slide, and information on a button pressed to
indicate that one is for or against a statement during a
presentation and Q&A session. Information marked
on important statements is also recorded.
We also developed a system for searching and
viewing recorded data. In this system for browsing
discussion content, a user can search the contents of
an agenda from a date and participant information,
view past discussions similar to the ongoing debate,
and effectively visualize the state of a discussion.
In addition, we also focus on pointing and
“referring to” behaviors during meetings. Speakers
usually refer to something when making a statement,
e.g., “this opinion is based on the previous comment”
or “this is about this part of the slide” (while pointing
KDIR 2019 - 11th International Conference on Knowledge Discovery and Information Retrieval
410

to an image or text in the slide). We assume that a
statement with a reference to an object in a slide is
strongly related to the topic corresponding to the
object. We also assume that two statements during
which the speakers point to the same object are about
the same topic. Therefore, we concluded that
acquiring and recording information on pointing to
objects in a slide would facilitate topic segmentation
and lead to more precise semantic structuring of
discussions. We call an object pointed to in
presentation material a “visual referent.” We thus
developed a system for pointing to and selecting
objects in slides that uses the discussion commander
mentioned earlier and created a mechanism for
acquiring and recording information on pointing to
objects in relation to participants’ statements.
This system can also extract any part of a figure
in a slide and refer to it. In addition, selected or
extracted image objects can be moved and magnified
by using the discussion commander.
3 DISCUSSION-SKILL
EVALUATION
As explained in the previous section, the DM system
we developed records the statements of each
participant during a meeting as the discussion
content, including video/audio data and text minutes.
Therefore, we can automatically evaluate statements
on the basis of their acoustic features and linguistic
features.
In addition, considering that the discussion
process is a type of cognitive activity, which could
result in changes in certain psychophysiological data,
such as heart rate (HR) variability (HRV), several
studies have proven that HR is an important index of
the autonomic nervous system regulation of the
cardiovascular system (Camm et al., 1996).
Therefore, there has been increasing focus on
observing the correlation between HR data and
cognitive activities. A study on measuring the HR
during three cognitive tasks (Luque-Casado et al.,
2013) revealed the affection of cognitive processing
on HRV. The stress level also has been assessed
during Trier social stress test tasks, a type of cognitive
activity, by using HR and HRV metrics (Pereira et al.,
2017). Judging from the large amount of evidence
presented, we argue that the HR data of the
participants of a meeting can be used to effectively
evaluate the answer-quality of Q&A segments, which
is helpful in improving participants’ discussion skills
(Peng and Nagao 2018).
3.1 Acoustics-based Method
At a meeting, participants need to discuss a topic,
analyze the meaning of other people’s statements, and
communicate their argument in an easy-to-
understand manner. “Voice size,” “speech speed,”
“pause,” “conciseness” etc. are mentioned as ways of
making speaking easy-to-understand (Kurihara et al.,
2007). On the basis of this, we set eight evaluation
indicators based on acoustic features and based on
linguistic features.
The indicators that are used to evaluate only
acoustic features are as follows.
A. Voice Size: voice should be large enough for a
speaker to be heard, while it is better for it to not be
too emotional and too big. Therefore, we measure and
evaluate the volume [dB] of each statement being
uttered.
B. Voice Intonation: speech without intonation is a
factor that makes a listener bored. We measure the
height of a voice in a statement (fundamental
frequency F0, described later) [Hz] and evaluate the
statement with high standard deviation values used to
indicate a good evaluation.
C. Speech Speed: a statement will be hard to hear if
it is too fast or too slow. Therefore, if the speech
speed [the number of syllables per hour (syllable is
described later)] is within an appropriate range, it is
evaluated as good.
D. Fluency: speech with a lot of silence and
disfluency is difficult to understand. A good
evaluation is given to statements with few filled
pauses (vowel extensions), such as “eh” during
speaking and few periods of silence of more than two
seconds.
E. Tempo: it seems easy to understand speech when
emphasized parts are clear. It is effective when
statements are not monotone, such as when a person
speaks slowly a part that they want to emphasize and
sets a pause before the emphasized part. Therefore,
the tempo of a statement is evaluated on the basis of
the standard deviation of the speech speed and the
number of “pauses” (“pause” is defined as a period of
silence of less than 2 seconds).
Here, the fundamental frequency (generally
written as F0) is a value expressing the periodicity of
sound, which is the acoustic feature quantity that
governs the pitch of sound. There is periodicity in
voiced sound (vibrating of the vocal cord), so the
reciprocal of that period (basic period) is the
fundamental frequency.
F0 is a very important index that considers the
intonation of voice, but its accurate extraction is very
difficult for the following reasons: (1) a speech
Discussion-skill Analytics with Acoustic, Linguistic and Psychophysiological Data
411

waveform is a quasiperiodic signal (due to the
quasiperiodicity of vocal fold vibration), and
periodicity is not clear, (2) speech is mixed with
noise, and (3) the range of change in F0 in voiced
sounds is difficult to limit because the range is wide.
Accurately extracting F0 is very difficult. Therefore,
several estimation methods have been proposed. An
acoustic analysis program called “Speech Signal
Processing Toolkit” (SPTK) was released (http://sp-
tk.sourceforge.net/), in which an algorithm called
“pitch extraction” is implemented to estimate F0.
In addition, the syllable used to calculate the
speech speed is a type of segmental unit that separates
consecutive voices and is a group of sounds heard.
Typically, it is a voice (group of voices) consisting of
one vowel and its vowel alone or with one or more
consonants before and after the vowel. In the case of
Japanese, syllables may use a segmental unit called a
“mora” (beat) that does not necessarily agree with the
syllable. Strictly speaking, the mora is used instead of
a syllable. The main difference between a syllable and
mora is that a long vowel, geminate consonant, and
syllabic nasal are integrated with the preceding vowel
in the case of a syllable, but, in the case of the mora,
it is one mora.
3.2 Linguistics-based Method
Next, evaluation indicators based on linguistic
features are as follows.
F. Conciseness: it is easier to understand a statement
if it is concise. Therefore, for the sake of evaluating
conciseness, we compare the number of syllables of
statements (strictly mora) in a meeting obtained by
speech recognition and the number of syllables of the
corresponding statements in the minutes of the
meeting. Since a secretary describes the content of the
statements in a summary, if the number of syllables
of the statements and number of syllables of the
corresponding statements of the minutes are close, the
statements can be regarded as concise.
G. Relevance to Topic: statements should be
relevant with the subject of discussion as much as
possible. If the content of follow-up statements has
much in common with the content of a topic-raising
statement, i.e., start-up statement, the statements can
be regarded as relevant with the theme. Therefore, by
evaluating the degree of relevance with start-up
statements (described later), the relevance of
statements is evaluated.
H. Consistency of Context: follow-up statements
need to be coherent or consistent with their parent
statements. In other words, the content of a follow-up
statement and the content of its parent statement must
be semantically related, so it is important to evaluate
the degree of consistency. We use a machine learning
technique to judge whether a statement is consistent
and decide the evaluation value on the basis of the
judgment. The technique is described later.
We calculate the degree of relevance between
statements in the following way. First, we calculate
the term frequency (TF)-inverse document frequency
(IDF) values of words in each statement by using the
following formula.
Here,
is the number of occurrences of word
in document
.
is a summation of the
number of occurrences of all words in document
(T is the set of all words).
is the number of all
documents, and
is the number of
documents that contain word
.
IDF works as a kind of general language filter. If
words (generic words) appear in many documents,
their IDF values decrease. If words appear only in
specific documents, their IDF values rise.
Using the TF-IDF value with each statement of one
meeting as one document, we weight the word t with
the following formula to obtain the degree of
relevance.
For words that appear commonly in two
documents, add that value, subtract the value for
words that appear only on one document, and sum
over all the words. Let this value be the degree of
relevance between statements.
Additionally, it can be said that inconsistent
statements in a discussion are statements that describe
topics that are different from topics up to that point.
Therefore, we need to consider how to categorize
follow-up statements as statements deviating from
topics or not. Logistic regression analysis is used for
this classification. In this case, we calculate a
probability value that measures how much a
statement deviates from a topic and use this value to
evaluate the consistency of the statement. For this
purpose, in addition to the linguistic features obtained
from the minutes, we use the meta-information given
in the minutes. The features used in this method are
as follows.
(1) Features based on linguistic features of
statements
- Relevance to parent statement
- Number of sentences of statements
- Number of characters of statements
KDIR 2019 - 11th International Conference on Knowledge Discovery and Information Retrieval
412
- Morpheme unigram and morpheme bigram
- Presence of subject word and referring word
- Entity grid
(2) Features based on meta-information attached to
the minutes
- Whether a speaker is a student, whether it is a
presenter
- Whether the speaker of the parent statement is the
presenter
- Presence of marking/agreement/disagreement
buttons
- Depth from the root in a tree structure (i.e.,
discussion chunk)
- Whether the visual referent of the parent statement
matches that of the target statement
- Presence or absence of slide use during speaking
- Time at which speaking is reserved
- Presence or absence of different statements in a time
series between the parent statement and the target
statement
- Alternating of questioners
For morphemes and morpheme pairs that appear
during speech, the number of occurrences of nouns,
verbs, adjectives, auxiliary verbs, and morpheme
pairs is calculated with a preliminary survey. We use
those that exceed a certain value for the morpheme
unigram and bigram features. Also, since there is a
report that states that an entity grid is effective for
evaluating text consistency (Barzilay and Lapata
2008), we applied it to evaluate the transition in
themes and used the transition probability of a certain
syntactic role of the grid for the feature. The selected
syntactic role is directly related to topic transition.
The alternating of questioners, which is the last
feature, means whether a questioner is different from
that of the preceding statement pair when considering
a participant’s question and presenter’s response as a
statement pair.
We implemented the above method and
conducted an experiment on discriminating
inconsistent statements. As a data set, we used 53
minutes (discussion content) of a seminar in our
laboratory (number of statements: 3,553). However,
since start-up statements were not subject to this case,
follow-up statements (number of statements: 2,490)
were subject to discrimination. As correct-answer
data (teacher signals), we manually decided whether
a certain statement lacked consistency and gave the
attribute of inconsistency to the statement. 202
follow-up statements were determined to be lacking
in consistency.
To evaluate the proposed method, a case in which
learning was carried out without using features based
on the meta-information of the minutes was taken as
a comparative method. For the evaluation, we used
the precision, recall, and F1 score, which is a
harmonic mean of these two values, and also carried
out a 10-fold cross validation.
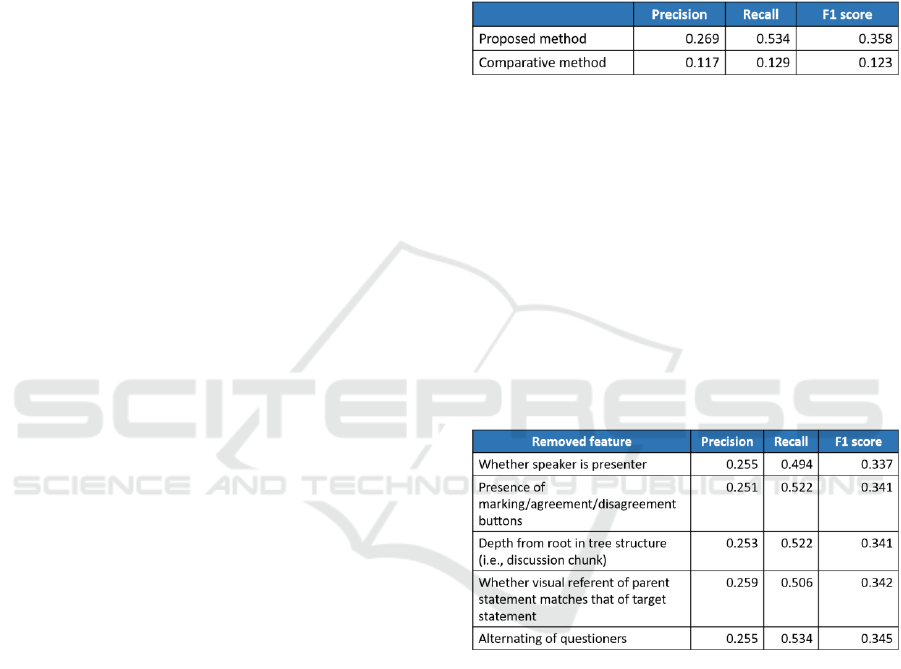
The results of this experiment are shown in Table
1.
Table 1: Experimental results for consistency judgment.
The results of judging consistency with the
method we proposed were higher than the case where
the feature information given to the minutes was not
used, for each precision, recall, and F1 score. The
advantage of the proposed method was confirmed.
In addition, when classification learning by
removing each feature of the meta-information of the
minutes, the precision, recall, and F1 score decreased
for all the features, and the used features described
above were confirmed to be effective. Table 2 shows
the results of the top five cases where the F1 score
dropped greatly.
Table 2: Feature contribution to learned model.
3.3 Psychophysiology-based Method
Smart watches, such as Apple Watch, the Fitbit series,
and Microsoft Bands, contain wearable sensors to
accurately detect users’ biological data, such as HR
and blood pressure. Such non-invasive detection
makes it possible to link users’ biological information
with their daily activities. Iakovakis and
Hadjileontiadis (2016) used Microsoft Band 2 to
acquire the HR data of users to predict their body
postures. In our study, we used Apple Watch to
collect participants’ HR data on the basis of our DM
system and to visualize the data during discussions.
Through the Health Kit framework on Apple Watch,
which we asked participants to wear on their left wrist
Discussion-skill Analytics with Acoustic, Linguistic and Psychophysiological Data
413
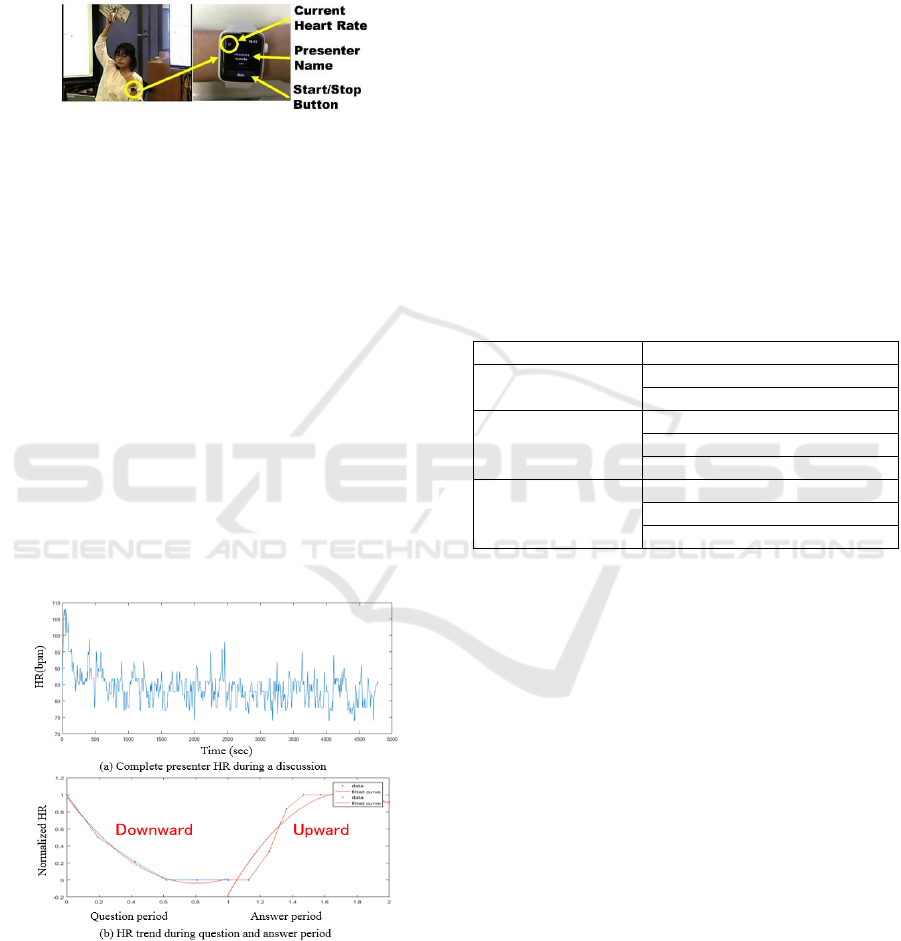
during discussions, participants’ HR data were
acquired almost in real time in 5–7 sec intervals, as
shown in Figure 3. The collected HR and participants’
information is displayed on the Apple Watch screen
as well as synchronously presented on an HR
browser.
Figure 3: HR acquisition system.
To automatically evaluate the discussion
performance, we started from analyzing the answer-
quality of Q&A segments, which are the most
important constituent components generated around a
discussion topic. Our goal was to validate our
argument that the HR of discussion participants can
be used to effectively evaluate the answer-quality of
Q&A segments during discussions.
All HR information of participants during their
discussions is displayed in a graph, shown in Figure
4 (a), that presents a participant’s complete HR
detected per minute throughout a discussion. The HR
segments in each Q&A segment were then extracted
and displayed in a graph, shown in Figure 4 (b), which
shows HR data during a question period (blue line)
and answer period (orange line). We then computed
18 HR and HRV features from all Q&A segments as
well as the question and answer periods separately.
Figure 4: HR acquisition system.
The HR and HRV features include mean, standard
deviation (std.), and root mean square successive
difference (RMSSD) from these two periods
(question and answer periods), and these metrics have
been proven to be important for understanding HRV
differences under cognitive activities (Wang et al.
2009). The trends in the HR of these two periods are
also computed by calculating the difference between
two adjacent HR points. If the number of positive
differences was more than the negative ones, we
assumed that the HR period showed an upward trend;
if not, it showed a downward trend, as shown in the
Figure 4 (b). We used a quadratic curve (red line) to
more clearly present the HR trend. We can see that
HR during the question period showed a downward
trend and upward trend during the answer period.
We also divided the HR data of these two periods
into nine ranges: less than 60 bpm, 60–70 bpm, 71–
80 bpm, 81–90 bpm, 91–100 bpm, 101–110 bpm,
111–120 bpm, 121–130 bpm, and more than 130
bpm. The mean and std. were calculated to describe
the HR appearance-frequency distribution in each
range. Table 3 summarizes these 18 features.
Table 3: HR and HRV features.
HR period
HR and HRV features
Both periods
mean, std., RMSSD, trend,
freq. all mean, freq. all std.
Question period
mean, std., RMSSD, trend,
freq. question mean,
freq. question std.
Answer period
mean, std., RMSSD, trend,
freq. answer mean,
freq. answer std.
We collected discussion data from 9 presenters
from 9 lab-seminar discussions held over a period of
4 months. Twelve undergraduate and graduate
students and 3 professors made up the participants.
The discussions were carried out following the
presenters’ research reports, with the participants
asking questions related to the discussion topic that
were then answered by the presenters. There were 117
complete Q&A segments extracted from these 9
discussions, and the answer-quality of these Q&A
segments was evaluated by the participants who
asked the questions by giving a score based on a five-
point scale: 1 = very poor, 2 = poor, 3 = acceptable, 4
= good, 5 = very good. We obtained 66 high-quality
answers with scores from 4–5 and 51 low-quality
answers with scores from 1–3.
We adopted three machine learning models,
logistic regression (LR), support vector machine
(SVM), and random forest (RF), to carry out binary
classification of the Q&A segments’ answer quality.
About 80% of Q&A segments were randomly
selected as a training data set and the remaining 20%
as a test data set.
KDIR 2019 - 11th International Conference on Knowledge Discovery and Information Retrieval
414
For the LR model, we obtained a 0.790 F1 score
by using an eight-feature candidate subset and an F1
score of 0.740 by using a seven-feature candidate
subset; therefore, we used the eight-feature subset to
train our LR model. We obtained an F1 score of 0.805
for the SVM model with 10 HR and HRV features we
selected in advance. For the RF model, when there
were 36 trees (submodels of RF) and 19 terminal
nodes on each tree, we obtained the highest F1 score
of 0.87. In this case, we chose an eight-feature subset.
Table 4 lists the evaluation results for each model.
Table 4: Evaluation results of each learning model.
Evaluation model
F1 score
Logistic Regression (LR)
0.790
Support Vector Machine (SVM)
0.805
Random Forest (RF)
0.870
Comparing the F1 scores of each model, the RF
model exhibited superior evaluation performance
compared with the LR and SVM models. Considering
all three models, the HRV data of participants showed
an outstanding performance in evaluating Q&A
segments’ answer quality. Meanwhile, we focused on
seven HRV features: all mean, answer trend, all
RMSSD, freq. answer std., answer std., question
trend, and all trend, which exhibited the largest effect
on all three models.
Our evaluation method automatically evaluates all
statements of meeting participants by using the
evaluation indicators mentioned above. Let the
weighted average value of the value of each indicator
be the evaluation of one statement, and let the sum of
the evaluation values of all statements of a participant
be the numerical value expressing that participant’s
speaking ability in discussions at a meeting. By
looking at the changes for each discussion in each
meeting, participants will be able to judge whether
their discussion skills are rising or stagnating.
4 FEEDBACKS OF EVALUATION
The evaluation indicators as described in the previous
section are indices for measuring participants’
discussion ability, but, of course, they should be used
not only for measurement but also for extending their
ability. One way to do this is to visualize the results
in an easy-to-understand manner and feed them back
to the participants at just the right time.
Participants should make an effort to raise their
discussion ability. For that purpose, the system we
developed evaluates their statements during a
meeting, points out the problems, and encourages
improvement. There are various ways to point this
out. One is to display a message on the main screen
during or shortly after speaking or to display icons
next to the name of each participant in the member
table of the sub-screen. There is another way to
display feedback including somewhat detailed
information, that is, with the icons and their
descriptions shown on the tablets used by all the
participants.
We previously implemented a mail notification
mechanism in order to let participants know that the
minutes were completed and accessible. Apart from
that, this time, we added a mechanism to notify
participants of the result of evaluating the statements
at the last meeting and the points to be paid attention
to in the next meeting by e-mail.
4.1 Real-time Feedback
The evaluation indicators using the acoustic features
described in the previous section can be used to
automatically calculate the evaluation values and
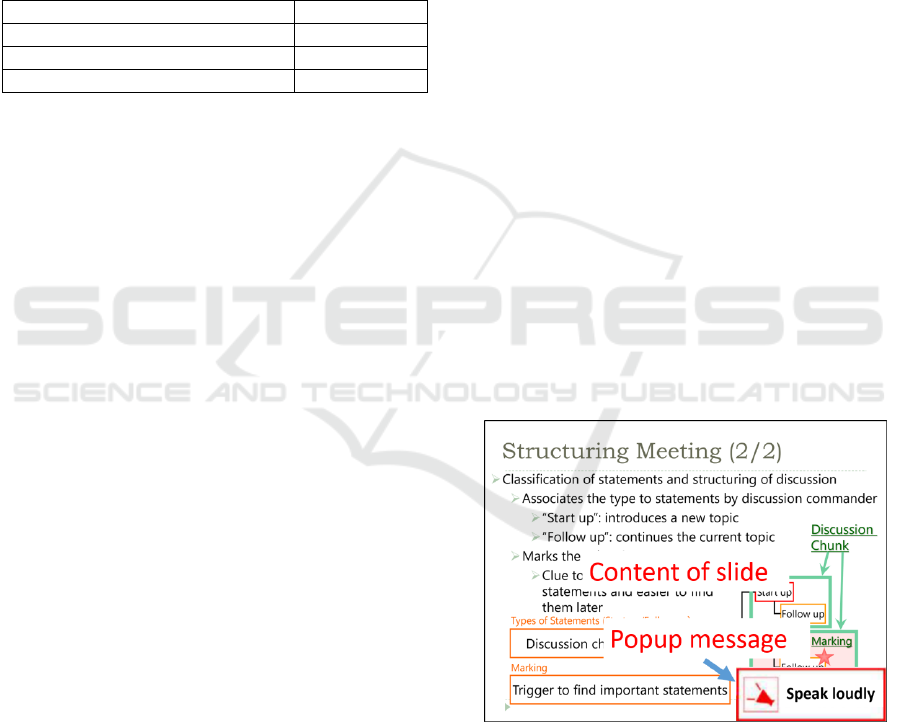
feedback during a meeting. Specifically, they are used
to evaluate in real time the “voice size,” “voice
intonation,” and “speech speed,” and when a value is
lower than a certain threshold value, that is, a “bad”
evaluation value, the system pops up a warning
message immediately on the main screen (normally
displaying presentation slides) as shown at the bottom
right of Figure 5. This display will be hidden after 2
seconds.
Figure 5: Feedback message appearing on main screen.
To measure the effect of this simplest direct
feedback on participants, we evaluated the
participants’ “voice size,” “voice intonation,” and
“speech speed” at five meetings. The results of
examining the change in evaluation values are shown
in Table 5. For “voice size,” the message to be
displayed differs depending on whether the
Discussion-skill Analytics with Acoustic, Linguistic and Psychophysiological Data
415
evaluation value is smaller or smaller than a reference
value. “Speech speed” may be faster or slower than
the reference value, but in the preliminary
experiments, it was extremely rare for it to be slower
than the reference value, and it was overwhelmingly
faster in the faster case. Only when the evaluation
value was larger than the reference value was the
message displayed.
Table 5: Experimental results of effects of feedback on
main screen.
4.2 Mail-based Feedback
Although it seems that there is an immediate effect
from the feedback of evaluation results during the
meeting, it may be difficult for participants to
continue speaking at the next meeting as they may be
conscious of their weaknesses pointed out last time.
That is because participants are not always trying to
improve their discussion skills, and they have to pay
attention to other issues to be considered among
meetings, e.g., achieving tasks.
For this reason, a mechanism for reminding
students of the problems in statements made at the last
meeting is required. Of course, if a student reviews
the minutes, he or she can reconfirm the evaluation
results of the statements as well as the contents of the
previous meeting, but it is unlikely that he/she will
frequently review the minutes unless the agenda is
very important.
Therefore, we implemented a mechanism for
notifying participants of the result of evaluating
statements made at the last meeting and the points to
be paid attention to in the next meeting by e-mail. An
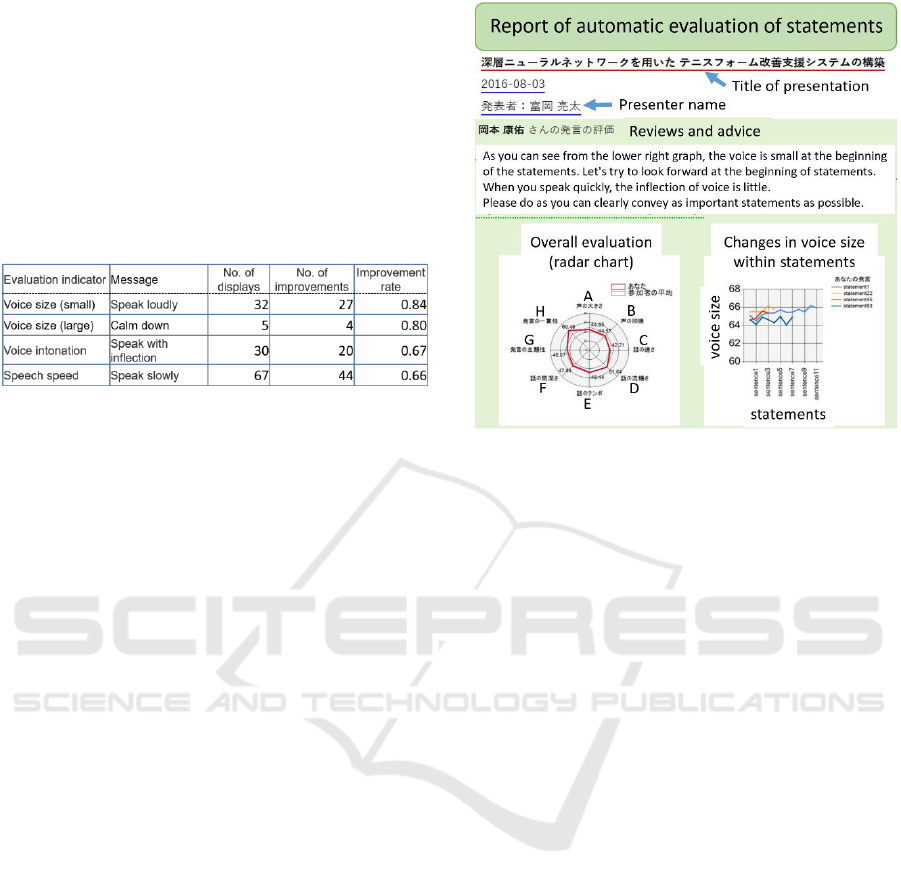
example of a notification mail is shown in Figure 6.
This is called “HTML mail,” and the receiver can
display the contents, including images and links to
Web pages, in the mail application. The sentences and
graphs shown in Figure 6 were automatically
generated on the basis of discussion data. Compared
with the evaluation results of the previous meetings,
the mail contains commentary on the items that show
little improvement while referring to the data.
Figure 6: Example of notification mail.
4.3 Generating Reviews and Advice
To generate reviews and advice, the degree of
deviation from the mean evaluation value of a
participant’s whole statements is used as a score. Our
proposed mechanism compares scores and considers
the indicators with lower scores as discussion skills
that should be improved on by the participants, and it
generates a review/advice text that encourages them.
The review/advice content consists of meeting
information, sentences representing evaluation, and
graphs, as shown in Figure 6. The meeting
information describes the title of the meeting, the date
and time, and the presenter. Also, a comprehensive
evaluation and an individual evaluation
corresponding to a sentence to be presented are
graphically displayed.
The review/advice text is created by generating
sentences for each evaluation indicator and
combining those sentences. Each sentence element is
weighted, and a sentence having the maximum
overall weight is generated under the constraint of the
length of the total text.
An overview of the evaluation of the statements
can be seen in the graph (radar chart) of the
comprehensive evaluation. However, to improve
participants’ discussion skills, more specific factors
need to be presented. For this purpose, the evaluation
results for indicators are analyzed on the basis of time
and relationship to other indicators. Specifically, the
analysis is performed by taking into consideration the
relevance to other evaluations, such as the time
division, for example, a small voice at the beginning
KDIR 2019 - 11th International Conference on Knowledge Discovery and Information Retrieval
416
of statement or no intonation when the voice is large.
The sentences are generated on the basis of a more
situated evaluation.
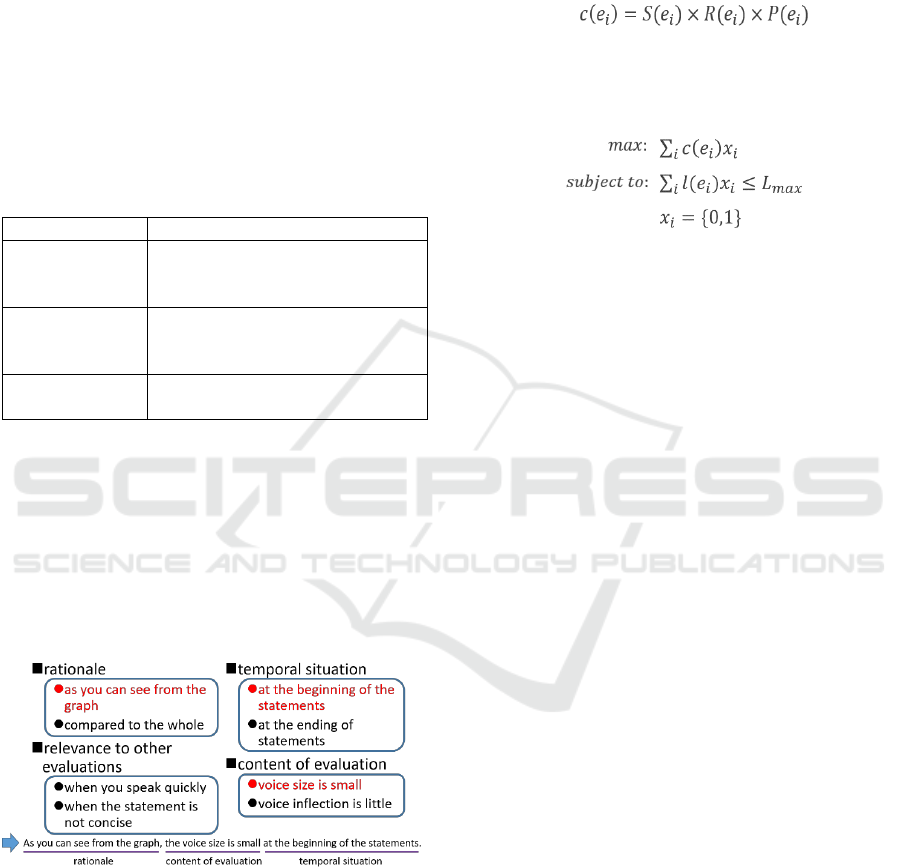
The text of the review/advice is composed of three
types of sentences, as shown in Table 6. Factual
sentences describe the evaluation results and inform
participants of the current situation. Advice sentences
describe methods for improving on bad evaluation
results for discussion skills. Encouragement
sentences motivate participants to improve their
discussion skills by describing the importance of the
evaluation indicators to be improved on and by
encouraging the participants to improve.
Table 6: Sentence element per sentence type.
Sentence type
Sentence element
Factual
rationale, temporal situation,
relevance to other evaluations,
content of evaluation
Advice
temporal situation,
relevance to other evaluations,
advice
Encouragement
importance of indicator,
excitation
A sentence is composed of several sentence
elements. An example of a generated factual sentence
is shown in Figure 7. Sentence elements are selected
one by one from the rationale, temporal situation,
relevance to other evaluations, and content of
evaluation indicated in red. Sentence elements are
selected at this time on the basis of the weighting of
the sentence element and the maximum length
constraint of the total review/advice text.
Figure 7: Example of factual sentence generation.
The review/advice text should describe the
evaluation indicators with low values and increase the
weight of sentence elements related to the results. If
the same sentence elements are repeatedly selected,
the effect of the review may be diminished, so we
reduce the weight of sentence elements that have
already been presented.
On the basis of the above consideration, the weight
of a sentence element
can be expressed as
follows by using the score
of
, the degree of
the relevance
between an evaluation indicator
and sentence element, and a value indicating a past
presentation state
.
The generation mechanism solves the following
integer programming problem with the maximum
length
of the total review/advice text and
selects sentence elements as the solution
of the
problem.
Here,
is the character string length of a
sentence element
.
5 REMAINING ISSUES
To train the discussion ability, it is necessary to
record evaluation results over a considerably long
span of time. Changes in short-term evaluation results
are effective as a clue to evaluating and improving the
performance of the developed system, but this will
not be enough to judge whether a person certainly has
improved their discussion ability. This is similar to
the fact that local optimal solutions do not necessarily
become true optimal solutions when optimizing the
parameters of machine learning models.
It is often said that human education takes time.
We think that discussion skills as well as basic
academic ability need to be firmly acquired over the
long term. To that end, we believe that we must have
a clear guide that becomes a signpost. Without good,
clear, and factual guidance, people will lose
confidence in themselves. The system for acquiring
and evaluating data that we developed is useful for
clarifying what can be done to improve what kind of
ability. We believe that “evidence-based education”
(Nagao et al. 2017) will be possible with such a
mechanism.
We believe that discussion ability is a
fundamental and important skill that human beings
use to perform intellectual activities. Improving this
ability is a task that can be said to be essential for
many people. However, if visible growth does not
appear, people will get bored with such training. We
are planning to introduce gamification techniques to
solve this problem.
Discussion-skill Analytics with Acoustic, Linguistic and Psychophysiological Data
417

6 CONCLUDING REMARKS
We proposed a method for automatically evaluating
statements and a feedback system for the purpose of
improving the discussion skills of participants at
meetings. For automatically evaluating statements,
we set five evaluation indicators based on acoustic
features: voice size, voice intonation, speech speed,
fluency, and tempo. We also set three evaluation
indicators based on linguistic features: conciseness,
relevance to topic, and consistency of context.
We also argued that participants’ heart rate (HR)
data should be taken advantage of to effectively
evaluate the answer-quality of Q&A segments in
discussions. We developed a system for acquiring
heart rates on the basis of a discussion mining (DM)
system with the help of a non-invasive device, i.e.,
Apple Watch, worn by participants. To verify our
argument, we generated 3 binary classification
models for evaluation, logistic regression, support
vector machine, and random forest, and selected the
7 most meaningful features out of all 18 HR and HR
variability features.
Next, we analyzed the result of automatically
evaluating discussion skills and proposed a
mechanism for generating review and advice text
using sentences and graphs on the basis of the values
of indicators of discussion ability. In the analysis on
automatic evaluation, temporal situation, relevance to
other evaluations, and comparison with past results
were considered. Also, to encourage participants to
improve their discussion skills, sentences in
review/advice text were categorized into three types:
factual sentences, advice sentences, and
encouragement sentences. We also collected the
sentence elements of these sentences, and the
review/advice generation mechanism set weights to
them in consideration of the relationships between the
evaluation indicators and the sentence elements and
the past presentation situation. The mechanism
generates sentences so as to maximize the weight of
the elements. The generated sentences and graphs are
optimum for improving discussion skills. We
confirmed that the review/advice text can express the
evaluation results appropriately and is effective for
improving the discussion skills of participants.
Future tasks include long-term participant-based
experiments on evaluating discussion skills and on
training and on extending the training process to
motivate students to continue training on the basis of
gamification techniques (Ohira et al. 2014).
REFERENCES
Nagao, K., Kaji, K., Yamamoto, D., Tomobe, H., 2004.
Discussion Mining: Annotation-Based Knowledge
Discovery from Real World Activities, In Proceedings
of the Fifth Pacific-Rim Conference on Multimedia, pp.
522–531.
Camm, A. J., Malik, M., Bigger, J., Breithardt, G., Cerutti,
S., Cohen, R., Coumel, P., Fallen, E., Kennedy, H.,
Kleiger, R., 1996. Heart Rate Variability: Standards of
Measurement, Physiological Interpretation and Clinical
Use, European Heart Journal, Vol. 17, No. 3, pp. 354–
381.
Luque-Casado, A., Zabala, M., Morales, E., Mateo-March,
M., Sanabria, D., 2013. Cognitive Performance and
Heart Rate Variability: The Influence of Fitness Level,
PLoS ONE,
https://doi.org/10.1371/journal.pone.0056935.
Pereira, T., Almeida, P. R., Cunha, J. P., Aguiar, A., 2017.
Heart Rate Variability Metrics for Fine-Grained Stress
Level Assessment, Computer Methods and Programs
in Biomedicine, Vol. 148, pp. 71–80.
Peng S., Nagao, K., 2018. Automatic Evaluation of
Presenters’ Discussion Performance Based on their
Heart Rate, In Proceedings of the 10th International
Conference on Computer Supported Education
(CSEDU 2018).
Kurihara, K., Goto, M., Ogata, J., Matsusaka, Y., Igarashi,
T., 2007. Presentation Sensei: A Presentation Training
System using Speech and Image Processing, In
Proceedings of the 9th International Conference on
Multimodal Interfaces, pp. 358–365.
Barzilay R., Lapata, M., 2008. Modeling Local Coherence:
An Entity-based Approach, Computational Linguistics,
Vol. 34, No. 1, pp. 1–34.
Iakovakis, D., Hadjileontiadis, L., 2016. Standing
Hypotension Prediction Based on Smartwatch Heart
Rate Variability Data: A Novel Approach, In
Proceedings of the 18th International Conference on
Human-Computer Interaction with Mobile Devices and
Services, pp. 1109–1112.
Wang, X., Ding, X., Su, S., Li, Z., Riese, H., Thayer, J. F.,
Treiber, F., Snieder, H., 2009. Genetic Influences on
Heart Rate Variability at Rest and During Stress,
Psychophysiology, Vol. 46, No. 3, pp. 458–465, 2009.
Nagao, K., Morita, N., Ohira, S., 2017. Evidence-Based
Education: Case Study of Educational Data Acquisition
and Reuse, Journal on Systemics, Cybernetics and
Informatics: JSCI, Vol. 15, No. 7, pp. 77–84, ISSN:
1690-4524 (Online).
Ohira, S., Kawanishi, K., Nagao, K., 2014. Assessing
Motivation and Capacity to Argue in a Gamified
Seminar Setting, In Proceedings of the Second
International Conference on Technological Ecosystems
for Enhancing Multiculturality. TEEM ’14, pp. 197–
204.
KDIR 2019 - 11th International Conference on Knowledge Discovery and Information Retrieval
418
