
PoloTrac: A Water Polo Tracking and Advanced Statistics
Application
Nathan Verlin
1
, Joey Gullikson
2
, John Mayberry
3
and Daniel Cliburn
1
1
Department of Computer Science, University of the Pacific, 3601 Pacific Ave., Stockton, California, U.S.A.
2
Department of Athletics, Water Polo, University of the Pacific, 3601 Pacific Ave., Stockton, California, U.S.A.
3
Department of Mathematics, University of the Pacific, 3601 Pacific Ave., Stockton, California, U.S.A.
Keywords: Water Polo, Tracking, Advanced Statistics, Mobile Application, Usability Testing.
Abstract: PoloTrac is an iOS mobile application designed to allow coaches, players, and spectators to record water polo
game events as they happen in real-time. PoloTrac contains features of a standard score-keeping application
(such as a functioning scoreboard, clock, and foul counter), however, PoloTrac also calculates and produces
post-game reports that provide advanced statistical output. This is accomplished by allowing the user to input
the location, type, tactic, and outcome of every shot attempted during a match. These reports are intended to
aid in determining player performance, team performance and the effectiveness of certain strategical methods
on scoring goals. While PoloTrac contains features recommended by top collegiate water polo coaches, these
features are designed to be accessible to users from all areas of water polo (from amateur to professional).
1 INTRODUCTION
Water polo is a competitive, aquatic sport that has
been played around the world for over a century.
Being the first team sport in the Olympic Games,
water polo has been a staple in high-level competitive
sports at the amateur, collegiate, and professional
levels (Escalante et al., 2011). The landscape of sports
statistics has changed considerably over the past
twenty years. Real-time sports performance analysis
is a crucial aspect of matches in major sports around
the world (Legg et al., 2012). Professional sports have
seen massive improvements in the way player
performance, individual play tactics, and overall
game strategies are evaluated. This progress known
as the “sabermetric revolution” has resulted in a
trickle-down effect into amateur leagues (Baumer and
Zimbalist, 2014). The progress of professional
organizations and the availability of coinciding
statistical software has led to an increase in the use of
advanced statistical tracking and analysis in many
sports at the amateur level as well. However, while
the physiological and biomechanical aspects of water
polo have been studied extensively, advanced
performance tracking and statistical analysis have
received less attention.
Many software programs available to collegiate
and amateur water polo teams produce only basic
player and team statistics. These statistics include
goals scored, shots attempted, steals, blocks, and
fouls along with the tracking of game events as they
occur. The limited progress and availability of new
statistics have created a need in the collegiate and
amateur water polo community for a system that is
able to record and provide advanced analytics based
on the latest statistical research and the
recommendations of top collegiate coaches.
PoloTrac is a mobile, iOS application designed to
allow coaches, players, and spectators to record play-
by-play water polo game events as they happen in the
pool. PoloTrac has the features that one might expect
from a score-keeping app such as a functioning
scoreboard and clock that can keep track of team fouls
and timeouts remaining. However, PoloTrac also
produces post-game reports that are designed to be
useful in determining player performance, team
performance and the effectiveness of certain tactics.
PoloTrac makes use of the touch interface of iOS
devices (iPhones and iPads) to allow users, with a
simple tap of the finger, to input specific locations in
the pool from which players shoot as well as locations
on the net at which they aim. Compiling and charting
this data may provide useful insights to water polo
players and coaches as to what positions and tactics
are producing success in competitions. By utilizing
the latest research and statistical models, PoloTrac is
Verlin, N., Gullikson, J., Mayberry, J. and Cliburn, D.
PoloTrac: A Water Polo Tracking and Advanced Statistics Application.
DOI: 10.5220/0008344601730180
In Proceedings of the 7th International Conference on Sport Sciences Research and Technology Support (icSPORTS 2019), pages 173-180
ISBN: 978-989-758-383-4
Copyright
c
2019 by SCITEPRESS – Science and Technology Publications, Lda. All rights reserved
173

also the first application of its kind to bring advanced
data analytics to the average water polo player, coach,
and spectator.
2 RELATED WORKS
There is a growing body of literature describing the
use of computing and advanced algorithms to analyze
data related to athletics and sports competitions
(Wang and Hsieh, 2016; Gruic and Gruic, 2018;
Beernaerts et al., 2018). Our application, PoloTrac, is
a mobile application that allows users to record and
analyze data from water polo matches using advanced
data analytics techniques. In section 2.1 we present
several uses of mobile applications in sports. In
section 2.2 we discuss recent advancements in the
collection and analysis of water polo statistics.
2.1 Mobile Applications in Sports
The use of mobile applications to record statistics and
to deliver content related to athletic events is
becoming increasingly common (Ault et al., 2008;
Savva et al., 2015; Berentowicz et al., 2017). Suomela
and Soinio (2005) were among the first to discuss the
use of smart phones to keep the score and time of
outdoor sporting competitions. Specifically, they
describe a novel system, StatKeeper, used in the 2004
World Ultimate Frisbee Championship. Like
PoloTrac, StatKeeper was designed to be simple and
user-friendly. Since it had to be usable by untrained
volunteers on a regular basis, the application had to
have a clear and intuitive flow of events to maximize
scorekeeping efficiency.
Park et al., (2014) propose an integrated
management system designed as a mobile application
to monitor participation in various sports activities.
The system was developed as a mobile application
and aims to systematically manage user activity level.
Similar to PoloTrac, this application uses two main
user interfaces, one for the tracking and logging of
data and the other for the presentation of statistics and
charts designed to provide the user with useful
information.
Can and Donmez (2015) describe an Android
application designed to utilize sensors that measure
GPS location, speed, and acceleration. These
measurements are tracked by the application and are
presented to users before, during, and after cardio
exercise sessions. The main user interface of the
application relies on a GPS enabled map that presents
the user’s location along with activity statistics. The
statistics are interactive and users are able to explore
data in a variety of fashions.
Hlupic et al., (2015) discuss a system to record
and process actions that occur at handball
competitions and provide statistical analysis during
and after each match. Like PoloTrac, this system can
provide coaches with data about player and team
efficiency during competitions. A mobile application
was developed to allow users to record player actions
(such as a shot to the goal) as a handball match
progresses. A separate web application is used to
generate reports.
2.2 Water Polo Statistics
Enomoto et al. (2003) were among the first to report
findings from an analysis of water polo statistics that
sought to identify characteristics of high performing
teams. Their findings suggest that, among other
things, highly ranked teams take more shots and make
fewer offensive mistakes than lower ranked teams.
Other authors followed with similar discriminatory
analyses of water polo contests based on common
box-score statistics (Argudo et al., 2009; Lupo et al.,
2010, 2011; Escalante et al., 2011, 2013).
More relevant to this paper is the work of Harris
and Graham (n.d.) who examined factors that affect
individual shot probabilities. This work explored the
“hot hand” effect, suggesting that as a player makes
more shots, the odds of a goal increase. This paper
also found several significant elements in predicting
the success of a shot, such as if the shot was a penalty
shot, where the shot was taken, and the sequence of
passes leading up to the shot. The shot-based
approach described by Harris and Graham is a
simplified approach of the shot-tracking methods
employed by PoloTrac.
Also paramount to the development of PoloTrac
is the work of Graham and Mayberry (2014) who
present a notational analysis of offensive tactics
commonly employed in elite men’s water polo
competitions. Following earlier analyses of
basketball game data (eg. Kubatko et al., 2007), this
work took a possession-based approach to studying
water polo and introduced the idea of measuring
tactical efficiency as the expected proportion of
tactical uses which lead to a goal being scored. This
work also provided a list of tactical definitions and
additional performance metrics adapted for use by
PoloTrac. Graham and Mayberry (2016) additionally
applied a possession-based approach to address the
question of referee bias in water polo. The authors
used a logistic model to predict foul calling
probabilities based on various game-state statistics.
icSPORTS 2019 - 7th International Conference on Sport Sciences Research and Technology Support
174
PoloTrac utilizes a similar logistic-based approach to
estimate shot probabilities based on shot location,
shot type, shooter hand, and defender position.
3 POLOTRAC OVERVIEW
The idea behind PoloTrac was to use the extended
tablet model of the Apple iPad to create a touch screen
interface that allows for rapid input and recording of
plays in real time as they take place during a water
polo match. The application can then generate
statistics and charts as well as export spreadsheet
enabled reports to leverage the model of tactical
efficiency described by Mayberry and Graham
(2014). PoloTrac is designed to be a standalone
application capable of tracking events during a water
polo match. While other score-keeping applications
also attempt to simplify the recording of in-game
events, PoloTrac uses an intuitive and sequence-
based event flow that allows for the recording and
advanced analysis of various tactics, outcomes, and
locations within the pool.
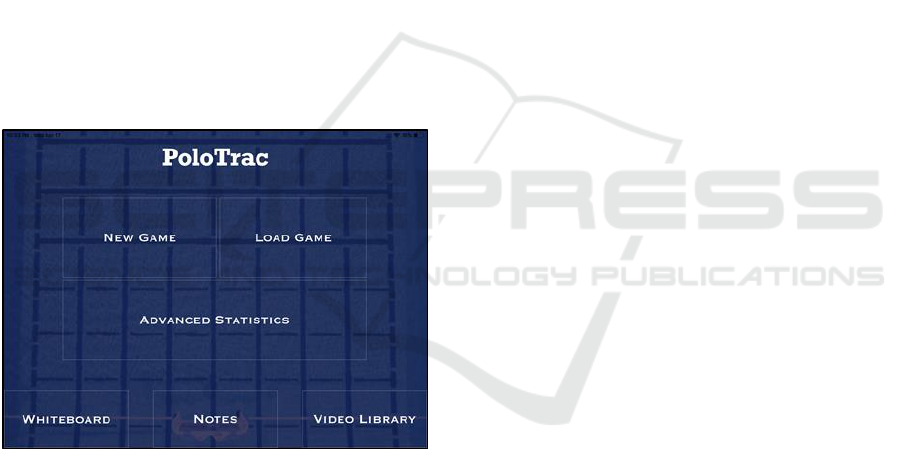
Figure 1: The Main Menu of PoloTrac.
3.1 Main Menu
The PoloTrac main menu has three core functions
(New Game, Load Game, and Advanced Statistics)
accompanied by three subfunctions (Whiteboard,
Notebook, and Video Library) as seen in Figure 1.
The core functions serve as a method for opening new
games, loading previous games, and viewing and
exporting outputs based on the events recorded during
games. The subfunctions are independent coaching
tools that have been recommended to increase the
usefulness of PoloTrac in a game or practice setting.
These features are separate from the tracking and
analysis that represent the core functionality of
PoloTrac and serve as simple tools for completing
actions such as drawing up plays to instruct player
positioning, saving notes about specific players and
strategies, and uploading video to be organized and
viewed for instruction or strategical scouting.
3.1.1 Team Management
In order to track players and their corresponding
statistics appropriately, values for name and cap
number must be attached and saved. PoloTrac
accomplishes this through a feature called team
building. Team building allows for the creation,
editing, and saving of teams made up of unique,
individual players. These teams are saved within the
application, therefore, once a user inputs the players
and numbers of a specific team this information
persists in the application until manually deleted. In
the New Game creation screen, users have the option
to select two teams from their current list of saved
teams or to create a new team. This functionality was
designed specifically with water polo leagues in mind
as teams who are in the same league frequently play
one another more than once.
Teams also serve as an attribute to a specific
player. This allows for the sorting of players by teams
which is particularly useful in many use cases
involving statistical output. For example, a coach may
want to see a compilation of a specific team’s
statistics. They may also want to see what players
have the highest statistics from a specific team for
scouting and preparation purposes. Or they may want
to see which players have recorded the best statistics
overall to provide some insight as to which team’s
players are producing the best statistics. From a
coaching perspective, this information is critical in
creating a competitive advantage through scouting.
Therefore, PoloTrac’s ability to input, store and track
players from different teams is one of the critical
underlying features of the application from a
coaching and evaluation perspective.
3.2 Secondary Functions
In addition to its primary features, PoloTrac includes
three secondary functions designed specifically with
the coach and spectator in mind. These features
include a virtual whiteboard in which coaches can
draw plays and strategies and erase them with the tap
of a button, a notebook designed to keep typed notes,
and a video library designed for the user to upload and
organize videos.
PoloTrac: A Water Polo Tracking and Advanced Statistics Application
175
3.2.1 Whiteboard
The whiteboard feature was designed and
implemented as a way to “draw up” specific plays,
tactics, and positioning over the image of a pool (see
Figure 2). This gives both the players and coaches a
better perspective of certain locations in the pool
relative to the goal. Traditionally, coaches use dry
erase boards to communicate this information. By
using a tablet interface such as the iPad with
programmable software, functionality can be
implemented that extends far beyond the reach of a
traditional dry erase board.
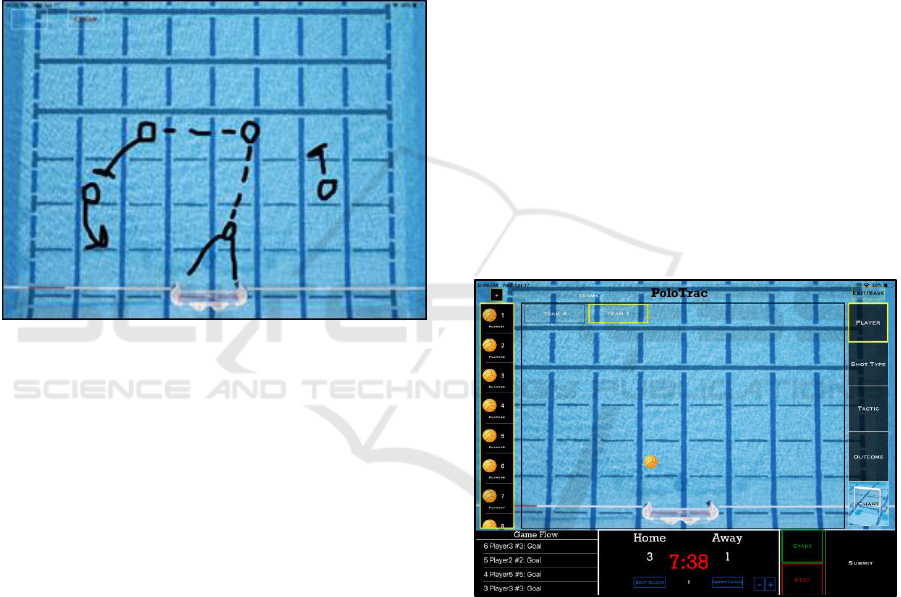
Figure 2: Example of a play drawn on the virtual
whiteboard.
Users are able to draw on the whiteboard in a
variety of colors, place markers for both offenders
and defenders, and erase the entire board at the press
of a button. While these features are relatively simple,
in the context of a game the ability to accurately draw
and erase legible diagrams over the course of a thirty-
second to one-minute timeout is critical. A match
outcome could be determined by the ability or
inability of a coach to effectively communicate with
players to execute an important play or possession.
3.2.2 Notebook and Video Library
The early stages of PoloTrac’s development included
observations of the coaching process during water
polo games. Through attending matches and viewing
past televised matches, it was observed that coaches
frequently jot down notes containing information to
refer back to during timeouts and at the conclusion of
games. Due to the rapid pace of play in water polo,
these game-time notes were often on various pieces
of scratch paper and written in formats that were
illegible. Therefore, the need to have a section
dedicated to simple notes arose. PoloTrac’s Notebook
feature is designed to provide a centralized location
for notes. Notes can be attached to specific teams for
organizational purposes. For example, a coach might
collect notes on his team in order to recall key points
of improvement during practice and training sessions,
while also collecting notes on opposing teams based
on the style and tactics of their play. This allows for a
much clearer and organized method of note taking
that can be stored and referenced when needed.
A similar ideology lies behind the video library.
Often times during water polo tournaments, multiple
matches will take place in one day giving coaches and
players the ability to watch their upcoming
competition before playing them. In order to better
understand and outline what an opponent's strengths
and weaknesses are, video of previous matches is
studied. The video library in PoloTrac serves as a
centralized location for images and videos of
matches, plays, or practices. Similar to the notebook,
videos can be linked with specific teams for
organizational purposes. A personal collection of
videos and tactics can be accumulated over time and
used as a coaching tool to demonstrate strategies to
increase the competence of one’s own team while
studying the tactics of a competitor.
Figure 3: PoloTrac’s primary tracking screen. The
draggable ball user interface is also depicted in the center
of the screen.
3.3 Primary Tracking Screen
The primary tracking screen (shown in Figure 3) is
the key component of PoloTrac. This screen is
designed for entering and recording inputs of various
aspects of water polo matches. The primary tracking
screen has two main purposes. The first is to keep
score for the game as a traditional scoreboard would.
This includes information that is common in sports
competitions, but also critical to the success of the
icSPORTS 2019 - 7th International Conference on Sport Sciences Research and Technology Support
176
application’s tracking and analysis features. The
second purpose is to provide an intuitive and fast-
paced system to track shot information during a
match and record it accurately. This is accomplished
by leveraging the landscape orientation of the iPad in
order to create a “two-thumbed” interface that can be
used in a similar manner as a game-pad controller.
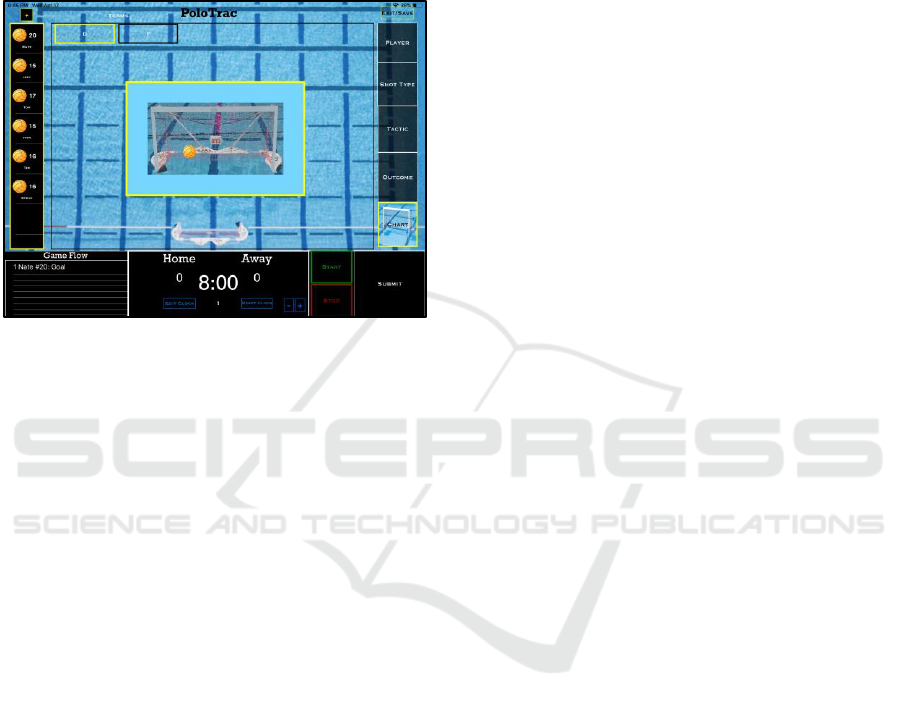
Figure 4: The shot chart displayed in the center of the screen
used to track the location of an attempted shot.
3.3.1 Scoreboard and Clock
The scoreboard and clock features seen at the bottom
of Figures 3 and 4 serve as the basic information
display that mirrors the standard water polo
scoreboard. This includes data such as home and
away score, the current quarter of play, the current
time remaining in that quarter, the total exclusions for
each team and the total number of timeouts remaining
for each team. The score itself is dynamic and will
update if a shot with the outcome of “goal” is tracked
for a certain player. The team in which that player is
on is awarded a point and their score is automatically
incremented. The clock feature is controlled by the
start and stop buttons directly next to the scoreboard.
The clock appears green when it is running and red
when it is stopped. This feature is designed to
highlight the clock in the user’s mind to ensure it is
not running when it should be stopped or stopped
when it should be running. The clock, quarter, and
timeout values can all be manually configured in the
case of a discrepancy between the match and what is
reflected on the PoloTrac scoreboard. In some
scenarios, it is not uncommon to see the clock be reset
to a certain value by the officials of the game in order
to ensure accuracy and fairness. Since the clock plays
a role in the recording and tracking of shots and shot
data, its accuracy is of utmost importance.
3.3.2 Draggable Ball and Player Location
PoloTrac utilizes a unique user interface to keep track
of shooting locations in the pool. The touch and pan
gesture-recognizing capabilities of the iPad allows for
the user to “tap” or “drag” the water polo ball to the
approximate place in the pool from where the player
attempted the shot (as shown in the middle of Figure
3). The pool image embedded as the background on
the PoloTrac screen (shown as the background image
of Figures 1 to 4) has squares that represent 2 meters
by 2 meters. While these squares may not be on every
pool the user encounters, knowing their length will
aid the user in approximating the player’s location in
the pool at the time of a shot. Based on this action,
coordinates are created and attached to the specific
shot and later used for building charts that can show
the location of a player or team’s shot attempts.
3.3.3 Shot Chart
In addition to tracking shot locations in the pool,
PoloTrac also captures the location on the goal in
which the ball was shot. Figure 4 shows the goal
image that the user is shown before the shot is
submitted. This image, like the main pool, contains a
water polo ball icon that can be tapped or dragged to
the location in the goal at which the player shot. The
coordinates of this approximate location are saved
along with the details of the shot and used for
statistical analysis and outputs.
3.3.4 Shot Tracking Flow
Water polo is a fast-paced game and one offensive
possession could contain multiple shot attempts. In
order to provide the most accurate results possible,
PoloTrac’s user interface is designed in a sequence-
specific order that allows for the user to input details
and location of a shot in a timely manner. The actions
of selecting events in sequence are carried out on the
two sides of the screen. The right side of the screen is
intended to be selected with the user’s right thumb
and indicates the content to appear on the left side of
the screen that is selectable by the user’s left thumb.
When users select the Player button on the
primary screen (shown in the upper right of Figures 3
and 4) the left side of the screen displays the list of
players on the current team so that users can quickly
select the player that took the shot (depicted on the
left side of Figures 3 and 4). Users can then indicate
the shot type and tactic that the player used to attack
the goal using the appropriate buttons on the right of
the screen, which generates a list of corresponding
options on the left side of the screen. Similarly, the
PoloTrac: A Water Polo Tracking and Advanced Statistics Application
177
Outcome button presents a table of outcomes (such as
“goal” and “miss”) that are possible throughout the
course of a game. Lastly, the “Chart” button should
be selected and the user can indicate the location of
the successful or unsuccessful shot (shown in the
center of Figure 4). Once all shot details are entered,
users record the shot using the Submit button (shown
in the bottom right of Figures 3 and 4) and the
outcome is used to update the scoreboard and
statistics automatically. For example if a player from
the home team scores a goal, the home score will
automatically increment by one.
3.4 Advanced Outputs
An advanced statistics screen was designed to provide
useful feedback to coaches and players through
statistics and charts. Users are able to organize these
statistics and charts by both individual, team, and
game. For example, users could see a shot chart for a
specific player from today’s game or they could see a
chart for all of that player’s games. The output of the
entire team can be viewed as well. This allows
coaches and players to easily access statistics for both
informational and instructional purposes. The
advanced output screen may also be used as a
scouting tool. By looking through previous matches
of an opponent and their players, trends in the shot
diagram could indicate specific strategies used by a
team thus giving the user a competitive advantage.
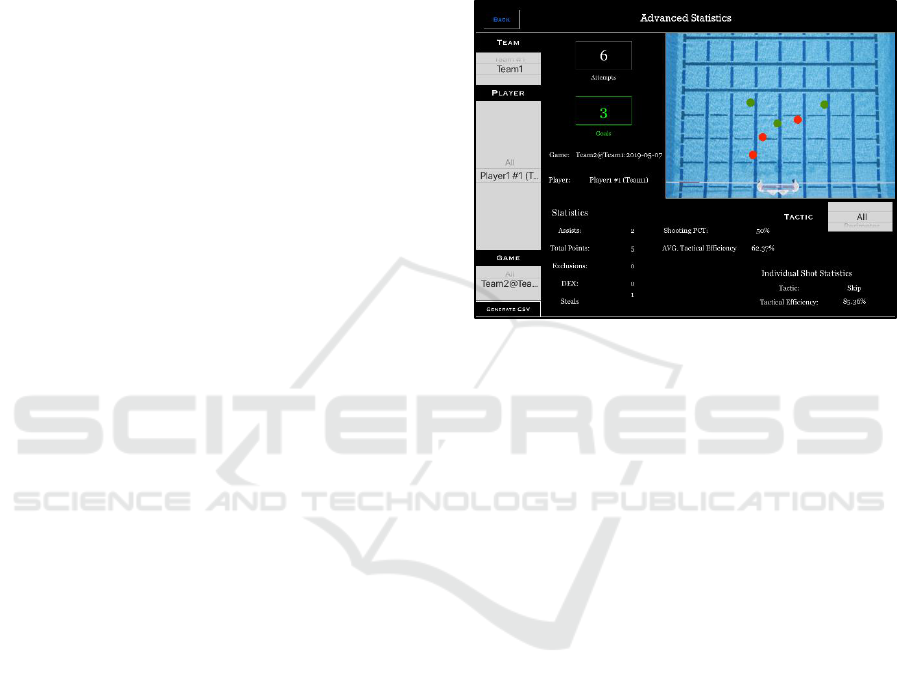
3.4.1 Basic Statistics
Like other water polo scorekeeping programs,
PoloTrac allows users to track statistics for each
player such as shots attempted, goals scored, assists,
total points, exclusions, and steals (as shown in
Figure 5). PoloTrac also provides these statistics for
both teams and players over the course of an
individual game or an entire season. This information
is accessible through the advanced statistics menu
option and allows users to filter through the data by
specifying a team, player, and game on the left side
of the screen.
3.4.2 Shot Diagram and Tactical Efficiency
In addition to the basic statistics presented by
PoloTrac, users are also able to view the locations in
the pool from which players and teams are taking
shots. As can be seen in the upper right of Figure 5,
the application displays an image of a pool with color
coded icons corresponding to the coordinates of each
recorded shot. Made shots appear with a green hue
and missed shots appear with a red hue. This view can
allow coaches to identify trends in shot locations
based on their own expertise to provide feedback to
their players. Each shot displayed in the chart is
selectable, meaning that it can be “tapped” to see
more information. This information contains all of the
recorded and calculated details of the shot following
the tactical definitions of Graham and Mayberry
(2014).
Figure 5: The Advanced Statistics screen.
PoloTrac calculates a predicted goal probability
for each shot (displayed as “Tactical Efficiency” and
shown under “Individual Shot Statistics” in Figure 5).
This value is obtained from a logistic model that uses
shot location, shot type, hand, defender position, and
offensive tactic as predictors and the binary variable
goal or no goal as the response. To obtain
coefficients, the model uses a sample of 5177 shots
from 86 collegiate water polo games during the 2016-
2018 seasons. The model was trained on a randomly
selected subsample of shots using a 60-40 split and
the remaining 40% of shots were used as a testing set
for model validation. The model achieved 70%
prediction accuracy on the testing set.
Incorporation of predicted goal probabilities
allows users to quantify the quality of their shot
selections, a feature that sets PoloTrac apart from
other scorekeeping applications. Players and coaches
can use this information both during games and in
post-game evaluation to identify weaknesses and
areas for improvement. For example, by looking at a
team’s average tactical efficiency throughout a game,
a team can distinguish between scenarios in which
they were taking poor shots and scenarios where they
were just shooting poorly. A team can evaluate their
defensive performance by comparing the actual
number of goals allowed with the expected number
based on predicted shot probabilities and number of
shots allowed. These advanced statistical features
icSPORTS 2019 - 7th International Conference on Sport Sciences Research and Technology Support
178

allow players and coaches to make better use of their
data and gain a competitive edge in the sport.
4 EVALUATION
To perform an initial evaluation of PoloTrac we
conducted usability testing (Rogers et al., 2011) with
five members of the local water polo community who
each had experience coaching or playing the sport.
The goal of our usability testing was to determine
ways that the interface of PoloTrac could be
improved to create a more usable and useful
application. Three of our participants used PoloTrac
to record statistics at live water polo games and two
participants recorded statistics of previously recorded
games that they watched on television. All
participants were asked to track the statistics of the
game they watched and told that they could use the
Advanced Statistics button on the home screen to see
reports for their inputs. Participants were observed
while they used the application, and then asked to
comment on the usability and usefulness of PoloTrac
at the conclusion of the game that they tracked.
Participants found the overall experience of using
PoloTrac to be “positive” and “successful.”
Participants also used words such as “easy” and
“intuitive” to describe the interface. They were
generally pleased with the “two-thumbed” layout of
the application. In addition, they found dragging or
tapping the ball to a specific location in the pool to be
convenient. Participants also felt that buttons such as
Submit, Start, and Stop were “in the correct place”.
However, participants found inputting shot
information to be somewhat challenging at times. In
PoloTrac, users are able to select menu buttons (such
as Player, Shot Type, and Tactic) in any order they
choose. However, during our evaluation users
occasionally forgot what information had already
been entered as they recorded some of the shots. This
led to incorrect data entries, which decreased the
accuracy of the statistical output. Participants also
commented on the order of many of the selection tabs.
For example, a “skip shot” is used often in water polo.
However, users had to scroll to the bottom of the shot
type list to select skip shot, which slowed them down.
Participants were generally pleased with the
functionality provided by the Advanced Statistics
screen to filter information based on criteria such as
team, player, and game. Participants commented that
that the layout and appearance of this screen looked
“professional” and “sleek.” However, participants
requested that a cumulative statistics screen also be
provided to display statistics for all the players on
both the home and away teams for a specific game.
Participants suggested it would be useful to see the
comparison between two teams for a specific game
for information and strategic purposes.
5 CONCLUSION
In this paper we describe PoloTrac, an application
that allows users to record statistics of live water polo
competitions, and that utilizes advanced statistical
models to provide reports and analysis not found in
other similar applications. Our initial usability testing
suggests that while users found many aspects of the
application to be intuitive, they sometimes struggled
to accurately record shot data in real time as games
progressed. PoloTrac has already been modified to
place the most recently selected shot types at the top
of the shot type list to improve the speed of the shot
entry process. To improve the accuracy of shot entry,
we plan to modify PoloTrac to require that users input
information on each option (such as Shot Type and
Outcome) before the Submit button is enabled to
record a shot. This should help remind users of all the
information required before a shot can be correctly
recorded. In response to user feedback, we also plan
to implement an additional statistics screen that
allows users to compare game statistics for two teams.
In the future, to further improve the application,
we would like to collect feedback from coaches who
use PoloTrac’s other features before, during, and after
matches. Future work could also include modifying
PoloTrac to allow users to record additional match
information. The tactical efficiency statistic
calculated by PoloTrac takes into account features
such as a player’s shot location, type of shot taken,
and specific tactic used (such as perimeter attack or
direct attack). However, PoloTrac does not currently
record other player responsibilities in the pool and
how those responsibilities are carried out. Tracking
information such as the length of passes between
players, whether or not plays are executed correctly,
and goalkeeper efficiency is not currently supported.
Our hope is that PoloTrac can provide users with
a powerful tool for real time tracking and analysis of
water polo games. PoloTrac's ability to isolate teams
allows coaches to perform in-depth analyses of
opponents' shot taking tendencies and evaluate their
own team's performance. The ability to isolate
individuals can also be used for player development
and training. We believe PoloTrac can provide the
water polo community with advanced knowledge of
their sport, revealing new insights about how shots
are made and ultimately, how games are won.
PoloTrac: A Water Polo Tracking and Advanced Statistics Application
179

ACKNOWLEDGEMENTS
The authors would like to thank James Graham, the
participants in our usability testing, and the School of
Engineering and Computer Science at University of
the Pacific for supporting this work.
REFERENCES
Argudo, F. M., Ruiz, E., & Alonso, J. I. (2009). Were
differences in tactical efficacy between the winners and
losers teams and the final classification in the 2003
Water Polo World Championship? Journal of Human
Sport and Exercise, 4(II), 142-153.
Ault, A., Krogmeier, J. V., Dunlop, S. R., & Coyle, E. J.
(2008). eStadium: The mobile wireless football
experience. Proceedings of the Third International
Conference on Internet and Web Applications and
Services, 644-649.
Baumer, B. & Zimbalist, A. (2014). The Sabermetric
Revolution: assessing the growth of analytics in
baseball. Philadelphia: University of Pennsylvania
Press.
Beernaerts, J., De Baets, B., Lenoir, M., De Mey, K., & Van
de Weghe, N. (2018). Analysing team formations in
football with the static qualitative trajectory calculus.
Proceedings of the 6th International Congress on Sport
Sciences Research and Technology Support, 15-22.
Berentowicz, M., Zajac, P., & Zabierowski, W. (2017). The
use of mobile technology on the example of health and
sports statistics application. Proceedings of the XIIIth
International Conference on Perspective Technologies
and Methods in MEMS Design, 187-189.
Can, Y. S. & Donmez, M. Y. (2015). Sport Sense: A mobile
sensor data collection, labeling and display application
for sport centers. Proceedings of the 23rd Signal
Processing and Communications Applications
Conference, 624-627.
Enomoto, I., Suga, M., Takahashi, M., Komori, Y.,
Minami, T., Fujimoto, H., Saito, M., Suzuki, S., &
Takahashi, J. (2003). A notational match analysis of the
2001 Women’s Water Polo World Championships.
Proceedings of Biomechanics and Medicine in
Swimming IX, 487-492.
Escalante, Y., Saavedra, J. M., Mansilla, M., & Tella, V.
(2011). Discriminatory power of water polo game-
related statistics at the 2008 Olympic Games. Journal
of Sports Sciences, 29(3), 291-298.
Escalante, Y., Saavedra, J. M., Tella, V., Mansilla, M.,
García-Hermoso, A., & Domínguez, A. M. (2013).
Differences and discriminatory power of water polo
game-related statistics in men in international
championships and their relationship with the phase of
the competition. The Journal of Strength &
Conditioning Research, 27(4), 893-901.
Graham, J. & Mayberry, J. (2014). Measures of tactical
efficiency in water polo. Journal of Quantitative
Analysis in Sports, 10(1), 67-79.
Graham, J. & Mayberry, J. (2016). The ebb and flow of
official calls in water polo. Journal of Sports
Analytics, 2(2), 61-71.
Gruic, A. S. & Gruic, I. (2018). Application of linear
programming on example of relationship between two
types of activity and optimized dietary supplement
intake. Proceedings of the 6th International Congress
on Sport Sciences Research and Technology Support,
197-202.
Harris, J. S. & Graham, J. (n.d.). Hot hands in cold water:
An investigation of the "myth" using NCAA division I
water polo. Retrieved April 23, 2019, from:
https://www.jillsharrisphd.com/upload/Hot Hands in
Cold Water.doc.
Hlupic, T., Jandrijevic, F., Kovacev, J., Petricioli, L.,
Gracin, T., & Baranovic, M. (2015). System for
monitoring and advanced analysis of handball matches.
Proceedings of the 38
th
International Convention on
Information and Communication Technology,
Electronics and Microelectronics, 1428-1433.
Kubatko, J., Oliver, D., Pelton, K., & Rosenbaum, D. T.
(2007). A starting point for analyzing basketball
statistics. Journal of Quantitative Analysis in
Sports, 3(3).
Legg, P. A., Chung, D. H. S., Parry, M. L., Jones, M. W.,
Long, R., Griffiths, I. W., & Chen, M. (2012).
MatchPad: Interactive glyph‐based visualization for
real‐time sports performance analysis. Computer
Graphics Forum, 31(3pt4), 1255-1264.
Lupo, C., Tessitore, A., Minganti, C., & Capranica, L.
(2010). Notational analysis of elite and sub-elite water
polo matches. The Journal of Strength & Conditioning
Research, 24(1), 223-229.
Lupo, C., Tessitore, A., Minganti, C., King, B., Cortis, C.,
& Capranica, L. (2011). Notational analysis of
American womenʼs collegiate water polo
matches. Journal of Strength and Conditioning
Research, 25(3), 753-757.
Park, S. J., Lim, M., Kim, M., Han, Y., & Choi, J. (2014).
Mobile personal sports activity management app.
Proceedings of the 18
th
IEEE International Symposium
on Consumer Electronics, 1-2.
Rogers, Y., Sharp, H., & Preece, J. (2011). Interaction
Design: beyond human-computer interaction (3rd ed.).
West Sussex, United Kingdom: Wiley.
Savva, A., Domenach, F., Stylianou, V., & Hadjidakis, S.
(2015). An F1 mobile application, Proceedings of the
2015 International Conference on Interactive Mobile
Communication Technologies and Learning, 172-175.
Suomela, H. & Soinio, A. (2005). Scorekeeping with smart
phones mobile solution for outdoor team sports
tournaments. Proceedings of HCI International 2005.
Wang, S. & Hsieh, W. (2016). Performance analysis of
basketball referees by machine learning techniques.
Proceedings of the 4th International Congress on Sport
Sciences Research and Technology Support, 165-170.
icSPORTS 2019 - 7th International Conference on Sport Sciences Research and Technology Support
180
