
Investigating Relationship between Running Motions and Skills
Acquired from Jump Trainings
Chanjin Seo
1
, Masato Sabanai
1
, Hiroyuki Ogata
2
and Jun Ohya
1
1
Department of Modern Mechanical Engineering, Waseda University, 3-4-1, Ookubo, Shinjuku-ku, Tokyo, Japan
2
Faculty of Science and Technology, Seikei University, 3-3-1, Kichijoji-kitamachi, Musashino-shi, Tokyo, Japan
Keywords: Running Motion, Jump Training, Skill, Coaching System, Stepwise Skill Improvement.
Abstract: To identify the difference in performers' motions, this paper investigates the relationship between running
motions and the result of evaluating motions during jump training. To clarify the relationship, two
experiments were performed using 17 subjects as follows: i) obtaining sequences of human joints during
running to evaluate running motions, and ii) obtaining motions during jump training which could skill up the
running motions. According to the result of those experiments, we confirmed that whether a running motion
is good or not relies greatly on the number of acquired skills.
1 INTRODUCTION
In recent years, emerging technologies such as deep
learning and image processing have made it possible
precisely to recognize objects or to detect human
poses. These technologies permit to develop com-
puterized coaching systems that obtain sports motion
data using sensors and analyze them to objectively
evaluate the learner’s performance, and to help the
learner improving skills without human coaching.
Traditional coaching system normally outputs a
one-dimensional evaluation result such as a score for
an exercise (Pirsiavash et al., 2014 and Parmar et al.,
2016) or a binary evaluation such that whether the
motion has achieved the ideal motion using sensors
(Ozaki et al., 2016). In particular, Pirsiavash et al.’s
method drew arrows on the video image to show the
direction to the ideal pose, while Ozaki et al.’s
method gave the performer a real-time voice
instruction so that the performer can improve his/her
motion. However, such systems are not always
suitable for low-level learners. One reason is that such
learners are considered not to have enough skills to
improve their performance. Another reason is that
they cannot adequately perfrom a motion along the
improvement strategy proposed by the system.
To solve such beginners' problem(s), we are
addressing to develop a coaching system that can
improve skill step by step by detecting the skills
acquired by a learner, and by automatically outputing
the improvement strategy which is appropriate for the
learner’s skill level. Our basic idea is that the system
can output a strategy to improve few problems which
cause low performance rather than to improve all the
problems. Also, we suppose that the few problems for
a learner can be solved by acquiring some skills
which he/she does not have. Therefore, we propose
two methods to resolve these problems: i) the system
finds a performer whose level is slightly higher and
has similar skill for the learner, and ii) a learner
improves his/her skill to achieve the slightly higher-
level performer’s skill.
To achieve the method i), we first focus on how to
extract and classify running skills from motions
without a priori knowledge using our previous
unsupervised learning based method (Seo et al.,
2019). However, we have not yet resolved whose
level is higher and whose skill is similar to the learner.
Note that this paper deals with training motions which
are related to running motions. The reason is that the
training motions are helpful to understand what skills
a learner has. In particular, “Skills” reflect a person’s
proficiency in performing a paricular task (Schmidt et
al., 2000). Based on the skills, we assume that
performance of a learner relies greatly on the number
of learner’s acquired skills as shown in Fig. 1, and that
a performer, whose level is slightly higher and who
has skills similar to the learner, has more skills than
the learner (Fig. 1). In fact, we suppose the learner in
Beginner level doesn’t have some skills even to
perfrom basic trainings related to running motions.
198
Seo, C., Sabanai, M., Ogata, H. and Ohya, J.
Investigating Relationship between Running Motions and Skills Acquired from Jump Trainings.
DOI: 10.5220/0008348301980203
In Proceedings of the 7th International Conference on Sport Sciences Research and Technology Support (icSPORTS 2019), pages 198-203
ISBN: 978-989-758-383-4
Copyright
c
2019 by SCITEPRESS – Science and Technology Publications, Lda. All rights reserved
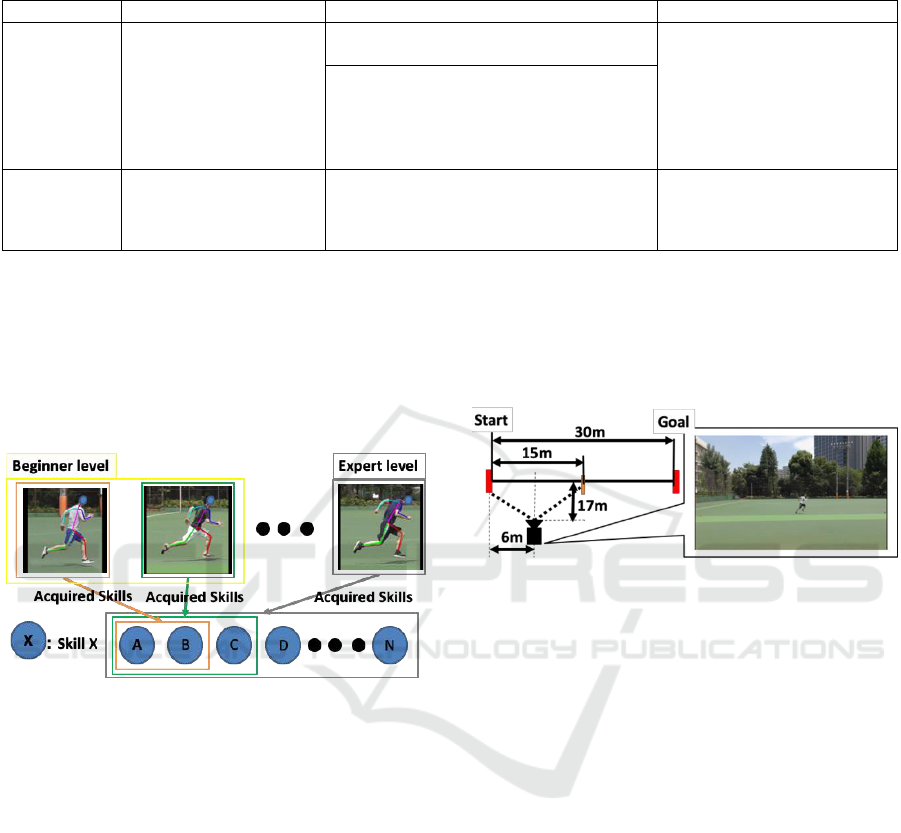
Table 1: Observational motion evaluation items concerning running motion in sprinting: These evaluation items can be
evaluated for performers by keeping scores from Suzuki et al.’s items.
Score
1.0
0.5
0.0
Size of lower
limb move-
ment
The knee of the
swinging leg moves
forward largely, and the
leg swings back just
below the body.
The swinging legs are swinging weakly in
running motion.
The forward swinging of the
swinging leg and the extention
of the knee are very small, and
the flight duration is extremely
short.
There is no swing back of the swinging leg
in the direction directly beneath the body,
and the foot of the swinging leg is
touching the ground immediately before
going in front of the swinging legs.
Switching of
legs
The swinging leg
overtakes the supporting
leg almost at the same.
The swinging leg overtakes the supporting
foot immediately after touching the ground
The swing leg slowly
overtakes the supporting leg
by touching the ground
And also, our opinion is that the learner should
acquire some skills from the basic trainings in order
to perform a running motion such as the performer.
To confirm that the performance is affected by the
number of acquired skills, this paper investigates the
relationship between running motions and motions
during training, which could skill up running motions.
Figure 1: Image of skills acquired by each performer. The
number of skills acquired by a lower-level performer is
generally smaller than an expert.
2 METHODS
To confirm what running skills each performer has,
we conduct the following two experiments: i) to
obtain sequences of human joints during running
motions and to evaluate the running motions (Section
2.1), and ii) to obtain motions during jump trainings,
which could improve the running motions (Section
2.2).
For these experiments, we collected data from 17
healthy male subjects (10 beginners and 7 experts;
21-24 years old).
2.1 Running Motions
To collect data, we let each subject run on a 30 m
track at a full speed. A video camera was placed at the
position shown in Fig. 2 to capture the first 15 m
running motion in order to check the start dash. The
videos were taken at 60 frames per second. Each
subject was asked to run 4-9 times, and 98 videos
were recorded in total.
Figure 2: Left: Environmental setup for getting running
motion data. Right: An example of the images captured by
the video camera.
The running motions were evaluated using Suzuki
et al.’s items by an expert sprinter. We especially
focus on the two items related to the low limb, which
are shown in Table 1. The period of evaluating those
items begins when the supporting leg leaves the
ground and ends when the opposite foot reaches the
ground. The score is obtained as an average rating of
each period in the running motion.
2.2 Jump Training Motions
To estimate each subject’s skill(s), we collected the
data of trainings, which could skill up the running
motion. The experimental condition is shown in Fig.
3.
Training items were selected from Tanaka’s book
(Takano, 2008) on training for sprinters. The selected
items are shown in Table 2. The reason for selecting
these items is that jump trainings such as skip is
related to skill up running motions according to the
report of Kotzamanidis and Iwatake et al., and it is not
difficult even for beginners to simply perform such
jump trainings.
Investigating Relationship between Running Motions and Skills Acquired from Jump Trainings
199
The subjects were thoroughly explained about
the methods of performing the jump trainings before
conducting the experiment. Then, a two-stage
evaluation of whether the trainings of the items in
Table 2 were performed well or not was judged by the
same expert sprinter as Section 2.1.
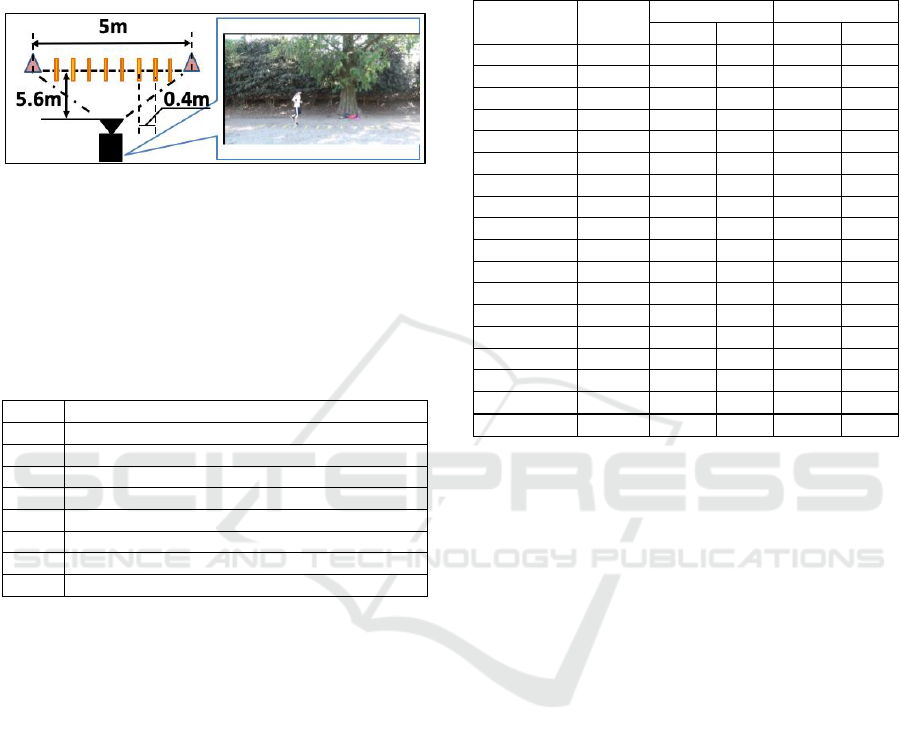
Figure 3: Left: Environmental setup for getting training
motion data. The stick ladders were placed at the interval of
0.4 m and the subjects jumped the interval in performing
the training items in Table 2. Right: An example of the
images captured by the video camera.
Table 2: Training Items in performing the experiment. In
particular, in performing jump trainings labeled 2, 7 and 8,
our subjects skip backward one step after two steps forward
in Fig. 3’s experimental condition.
Label
Training Name
1
Skip forward using both legs
2
Skip forward and backward using both legs
3
Skip forward using left leg
4
Skip forward using right leg
5
Sideways skip using left leg
6
Sideways skip using right leg
7
Skip forward and backward using left leg
8
Skip forward and backward using right leg
3 RESULTS
3.1 Evaluating Running Motions
The scores obtained in the first experiment is shown
in Table 3. From the table, it can be seen that almost
all the score of the beginners are below 0.5 in Items 0
and 1. We could not confirm other common tendency
of the beginners except that they were evaluated low
in Table 1.
On the other hand, it can be seen that almost all
the score of the experts are over 0.5 for Items 0 and 1,
and also the standard deviations of the experts are
smaller than those of the beginners in Table 3.
Expert0 got a score lower than other experts. That is
because Expert0 had not run for a long time, which
results in losing his past capability.
As a result, we could confirm that the running
motions are different between beginners and experts
through Suzuki et al.’s evaluation method. However,
the reason why their motions are different cannot be
clarified only by scores in Table 3.
Table 3: Scores of each subject: the number of times to run,
mean score, and standard deviation (SD) for Table 1’s
items.
Subject
Times
Item0
Item1
Mean
SD
Mean
SD
Beginner0
4
0.27
0.11
0.39
0.04
Beginner1
4
0.55
0.18
0.31
0.12
Beginner2
4
0.07
0.08
0.03
0.02
Beginner3
8
0.22
0.10
0.28
0.13
Beginner4
5
0.38
0.20
0.27
0.19
Beginner5
6
0.30
0.10
0.23
0.08
Beginner6
6
0.25
0.05
0.42
0.14
Beginner7
6
0.31
0.16
0.32
0.10
Beginner8
4
0.16
0.08
0.02
0.04
Beginner9
6
0.36
0.08
0.27
0.06
Expert0
9
0.66
0.11
0.53
0.17
Expert1
6
0.98
0.02
0.91
0.03
Expert2
6
0.93
0.04
0.94
0.06
Expert3
6
0.98
0.04
0.94
0.03
Expert4
6
0.88
0.08
0.87
0.03
Expert5
6
1.00
0.00
0.77
0.00
Expert6
6
0.94
0.02
0.81
0.08
Average
5.76
0.55
0.33
0.49
0.31
3.2 Evaluating Jump Training Motions
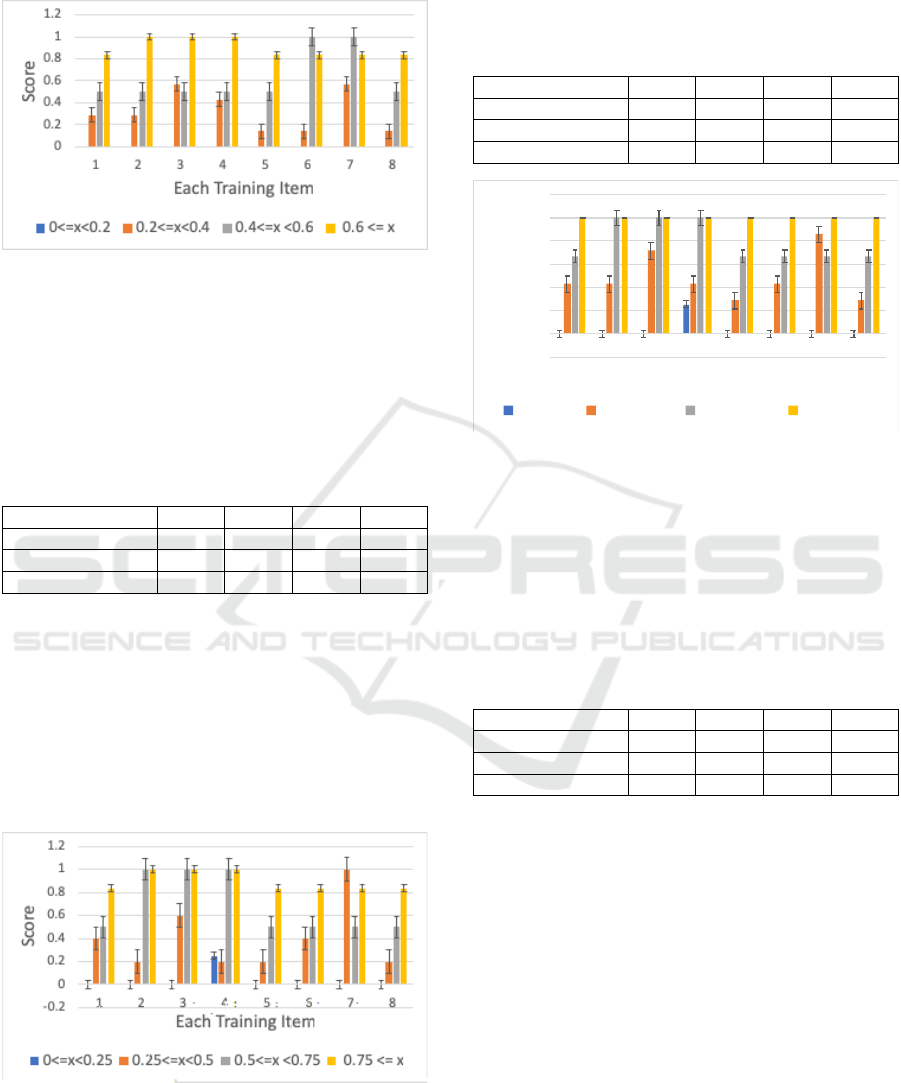
Figure 4 and Table 4 show the relationship between
scores of Item 0 in Table 3 and the result of evaluating
jump training motions. The subjects are divided into
four groups based on the scores of Item0. From Fig.
4 and Table 4, it appears that subjects who are in a
similar skill level tend to belong in the same group.
For example, the result of evaluating jump training
motions is low if the Item0’s score is low, and the
result is high if it is high. In particular, in Fig. 4, the
subjects of Area1 in Table 4 tend to be highly possible
to perform Item7 in Table 2 rather than others, and
Area2 tends to be highly possible to perform certain
items in Table 2 but difficult to perform others.
Figure 5 and Table 5 show the relationship
between scores of Item 1 in Table 3 and the result of
evaluating jump training motions. In Fig. 5 and Table
5, though the scores are divided at regular interval
into 5 groups, we merge the ranges of 0.6 ≤ 𝑥 < 0.8
and 0.8 ≤ 𝑥 < 1.0 because only experts belong to
these ranges. Therefore, there are 4 groups as a total.
Each area in Table 5 tends to contain subjects who
have similar skill levels. In particular, Area2 in Table
2 is composed of a beginner and an expert in Fig. 5.
Thus, the result in Fig. 5 depends on the expert’s
result and leads to show a better result than Area3 in
icSPORTS 2019 - 7th International Conference on Sport Sciences Research and Technology Support
200
Item6 and Item7, but, in Table 5, it is confirmed that
mean score is different.
Figure 4: The evaluation result of whether each training
items in Table 2 can be performed or not by subjects in
anarea which is decided by a mean score in Item0 of Table
3. In the figure, x is the mean score in Item0 of Table 3.
Table 4: The basic information in each area: the number of
persons that belong to each area, mean score, and standard
deviation (SD) of evaluated result in all training items. The
range of Areas 0 to 3 are 0 ≤ 𝑥 < 0.25, 0.25 ≤ 𝑥 < 0.5,
0.5 ≤ 𝑥 < 0.75, and 0.75 ≤ 𝑥 , respectively. 𝑥 is a mean
score of Item 0 in Table 3.
Area0
Area1
Area2
Area3
Belonged persons
4
5
2
6
Mean
0.03
0.40
0.69
0.90
SD
0.08
0.26
0.24
0.08
Figure 6 and Table 6 show the relationship
between total scores of Items 0 and 1 in Table 3 and
the result of evaluating jump training motions. In Fig.
6 and Table 6, the scores are divided into 4 groups.
Each area in Table 6 tends to contain subjects who
have similar skill levels. In particular, Area2 and
Area3 in Table 3 are composed of all the experts, and
it can be confirmed that some items in Table 3 could
not be performed even experts in Area2 from Fig. 6.
Figure 5: The evaluation result of whether each training
items in Table 2 can be performed or not by subjects in an
area which is decided by a mean score in Item1 of Table 3.
In this figure, x is the mean score in Item1 of Table 3.
Table 5: The basic information in each area: the number of
persons that belong to each area, mean score, and standard
deviation (SD) of evaluated result in all training items. The
range of Areas 0 to 3 are 0 ≤ 𝑥 < 0.2 , 0.2 ≤ 𝑥 < 0.4,
0.4 ≤ 𝑥 < 0.6 , and 0.6 ≤ 𝑥 , respectively. 𝑥 is a mean
score of Item 1 in Table 3.
Area0
Area1
Area2
Area3
Belonged persons
2
7
2
6
Mean
0.00
0.32
0.63
0.90
SD
0.00
0.17
0.22
0.08
Figure 6: The evaluation result of whether each training
items in Table 2 can be performed or not by subjects in an
area which is decided by a total score in the mean score of
Item0 and Item1 in Table 3. In this figure, x is the total score
in the mean score of Item0 and Item1 in Table 3.
Table 6: The basic information in each area: the number of
persons that belong to each area, mean score, and standard
deviation (SD) of evaluated result in all training items. The
range of Areas 0 to 3 are 0 ≤ 𝑥 < 0.6, 0.6 ≤ 𝑥 < 1.2 ,
1.2 ≤ 𝑥 < 1.8, and 1.8 ≤ 𝑥 ≤ 2, respectively. 𝑥 is a total
score of Item0 and Item1 in Table 3.
Area0
Area1
Area2
Area3
Belonged persons
4
7
3
3
Mean
0.03
0.48
0.79
1.00
SD
0.08
0.19
0.16
0.00
4 DISCUSSION
In Section 3.2, it was observed that there is a
relationship between the skill to perform certain jump
training and the scores in Table 3. In particular, the
total scores of Item0 and Item1 in Table 3 show the
difference in each area of whether each training item
can be performed or not from Fig. 6, and the areas of
Table 6 show a stepwise distribution between the
scores and the result of training motions. From these
results, we can infer that the running motion is related
by the number of obtained skills from the jump
trainings in Table 2. Then, the number of acquired
skills highly affects the motions of the runner.
-0.2
0
0.2
0.4
0.6
0.8
1
1.2
1 2 3 4 5 6 7 8
Score
Each Training Item
0<=x<0.6 0.6<=x <1.2 1.2<=x < 1.8 1.8<=x <=2
Investigating Relationship between Running Motions and Skills Acquired from Jump Trainings
201
However, all the motions are evaluated from their
appearances in this paper. Thus, we could obtain the
relationship about skills, but we could not validate the
motions using detail information such as the motion
sequence of human joints.
In our future works, we will focus on validating the
training motions by detecting human joints, and we
will clarify the motion difference which causes the
different numbers of obtained skills.
5 CONCLUSIONS
In this paper, we have investigated the relationship
between the running motions and the motions during
jump trainings so as to clarify the difference in running
motions of performers which causes different numbers
of acquired skills. From our experiments, we can infer
that the number of acquired skills from jump trainings
is related to the performance of running motions.
ACKNOWLEDGEMENTS
This study was conducted as a part of research
activities of the Human Performance Laboratory,
Organization for University Research Initiatives,
Waseda University.
REFERENCES
Iwatake, J., Kitada, K., Kawahara, S., Zushi, K., 2008. The
influence of jump training on the sprinting ability in late
pubertal boy students. Japan Journal of Physical
Education, Health and Sport Sciences, 53, 352-362.
Kotzamanidis, C., 2006. Effect of plyometric training on
running performance and vertical jumping in prepubertal
boys, J Strength Cond Res, 20(2), 441-445.
Ozaki, A., Honda, M., 2016. Development of an Automated
Motion Coaching System Using a Portable Sensor, Japan
Society for Information and Systems in Education, 33(1),
22-30.
Parmar, P., Morris, T., B., 2016. Measuring the quality of
exercises. In IEEE International Conference Engineer-
ing in Medicine and Biology Society, 556-571.
Pirsiavash, H., Vondrick, C., Torralba., A., 2014. Assessing
the Quality of Actions. European Conference on
Computer Vision (ECCV), 556-571.
Schmidt, A., R., Wrisberg, A., C., 2000. Motor Learning and
Performance, Human Kinetics. USA, 2
nd
edition, 29-31.
Seo, C., Sabanai, M., Ogata, H., Ohya, J., 2019.
Understanding Sprinting Motion Skills Using
Unsupervised Learning for stepwise Skill Improvements
of Running Motion. In 8th International Conference on
Pattern Recognition Application and Methods
(ICPRAM), 467-475.
Suzuki, Y., Tomozoe, H., Yoshinaga, T., Kaji, M., Hirayam,
K., 2016. Study on the observed behaviour evaluation
method of sprinting action (in Japanese). Japan Journal
of Physical Education, Health and Sport Sciences, 32(1),
1-20.
Takano, S., 2008. Track and Field, Sprinting Perfect Master,
Sports Step-Up DVD Series (in Japanese), Shinsei
Publishing Company, Japan, 33-35.
APPENDIX
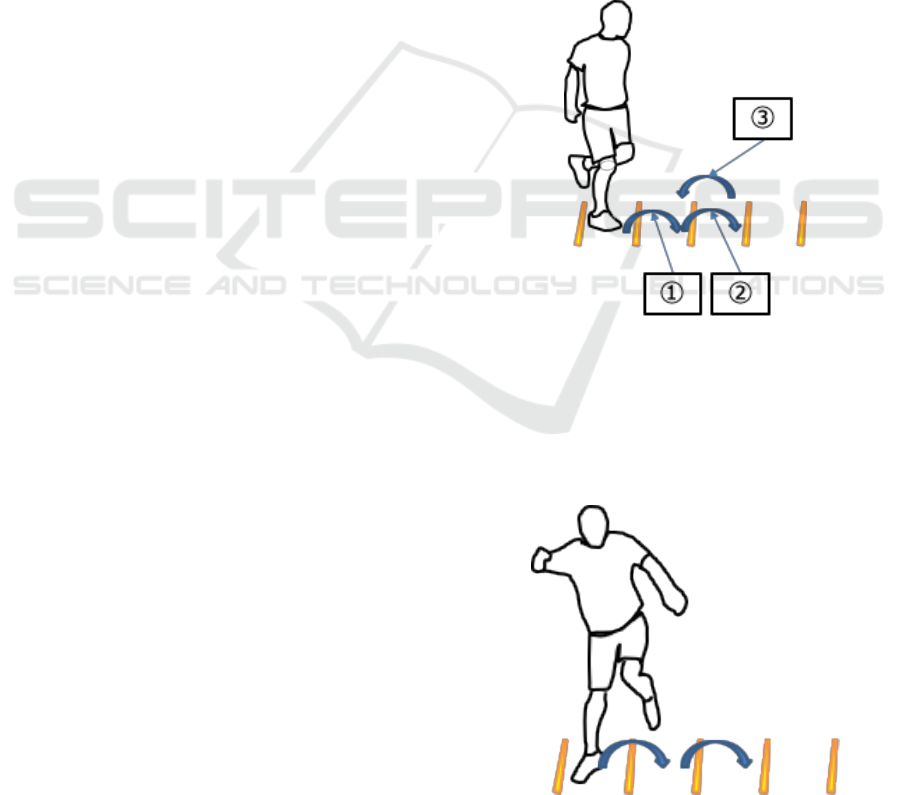
We show the images of trainings in Table 2. In first,
label 1-4, 7 and 8 in Table 2 were performed such as
Fig. 7. In the case of the training of label 1, 3 and 4,
subjects jump over a stick ladder until the end.
Figure 7: Image of skipping forward and backward.
In case of the training of label 2, 7 and 8, the
subjects performed 2 steps. First step is jumped over a
stick ladder twice in Fig.7 (1 and 2). Next step is
jumped over a stick ladder backward in Fig.7 (3). And,
the subjects repeat to do this motion until the end.
Figure 8: Image of Sideways skip.
icSPORTS 2019 - 7th International Conference on Sport Sciences Research and Technology Support
202

On the other hands, label 5 and 6 in Table 2 were
performed such as Fig. 8. In the case of the training
of label 5 and 6, the subjects jump over a stick ladder
until the end.
Investigating Relationship between Running Motions and Skills Acquired from Jump Trainings
203
