
Knowledge Management in Healthcare: Information Requirements
When Creating a Decision Support Tool in Radiology
Mary Conlon and Owen Molloy
College of Engineering and Informatics, National University of Ireland, Galway
Keywords: Business Process Modelling, Health Information Systems, Discrete Event Simulation, Workflow, Patient
Complexity, Resource Utilisation, Computed Tomography, Radiology.
Abstract: Introduction: This empirical work examines the information requirements when undertaking a process
modelling project in a Healthcare setting such as a CT (Computed Tomography) department. Using
qualitative and quantitative methods we map the process, incorporating patient, staff and process related
components so as to quantify resource utilisation and the service experienced by the patient. Method: In this
study, semi structured interviews are used to identify patient complexity factors/characteristics. Process
mapping and involvement of stakeholders are discussed as is the identification and analysis of data. A
discrete event simulation (DES) model of the process is designed and performance metrics identified.
Results: Yearly demand for Radiology services are increasing significantly. Factors determining patient
complexity and variation include patient type, infectiousness, mobility, exam type and patient care needs. A
strong correlation between age and infectiousness was observed. Conclusion: DES modelling, though data
intensive, provides decision makers with insights into resource utilisation, process capacity, delays and
disruptions and in doing so supports operations, management and the adoption of good practices in
Healthcare.
1 INTRODUCTION
Radiology departments have adopted many
strategies to continually improve aspects of
radiology workflow. Many departments are
reengineering their workflow to eliminate and
automate steps in the process and to make more
intelligent use of available resources and software.
In healthcare the shift towards evidence-based
management has been supported by the adoption and
adaptation of management methodologies. Included
amongst these philosophies are; Lean Thinking,
Queuing Theory, the Theory of Constraints, Six
Sigma and System Dynamics. (Gahan, 2010) This
empirical research, using discrete event simulation
(DES) as a decision support tool, identifies how
patient variability and the increasing demand for CT
affects resource utilisation, staff workload and the
service provided to patients.
The challenges facing radiology service
provision are many. The number of over 65 year
olds will double between 2011 and 2031 (Central
Statistics Office., 2015). The increasing prevalence
of diabetes and obesity among young people
suggests that future elderly cohorts might even be
less healthy (Lakdawalla et al, 2004; Sturm et al.,
2007). Resources are limited and the demand for
Radiology services is increasing year on year.
Simulation allows offline experimentation and
process redesign as well as the pre-emption of
unintended consequences while minimising
disruptions of the current system. Examples of the
application of modelling and simulation involving
radiology departments are many (Booker et al.,
2016; Jin et al., 2011; Lu, Li & Gisler, 2011;
Rachuba et al., 2018; Reinus et al., 2000; Shukla,
Keast & Ceglarek, 2014). One radiology model
example uses patient characteristics to determine
length of procedure time, these are where the patient
is referred from, appointment time, gender, mobility,
and body area to be studied. (Huang & Marcak,
2013).
Simulation modelling can capture undesirable
behaviours in response to work pressure, such as
staff turnover, erosion of service quality and fatigue,
all examples of unbalanced responses to increases in
workload (Oliva, 2002).
Radiology has been referred to as an “anti-care”
Conlon, M. and Molloy, O.
Knowledge Management in Healthcare: Information Requirements When Creating a Decision Support Tool in Radiology.
DOI: 10.5220/0008352703170324
In Proceedings of the 11th International Joint Conference on Knowledge Discovery, Knowledge Engineering and Knowledge Management (IC3K 2019), pages 317-324
ISBN: 978-989-758-382-7
Copyright
c
2019 by SCITEPRESS – Science and Technology Publications, Lda. All rights reserved
317
area due to the short time periods spent with
patients. Radiographers see care as a wider concept
that encompasses administrative and technical
elements as well as a relational element (Brask &
Birkelund, 2014). While much has been found on
quantifying Radiologist workload (Cowan,
Macdonald & Floyd, 2013; Pitman et al., 2009;
RCSI, 2011) little literature on Radiographer
workload has been discovered. Further research into
the pressures specific to the time-pressured, task-
focussed and highly technical environment of
radiography and the impact on compassionate
patient care has been recommended (Bleiker et al.,
2018).
When high work intensity is sustained over long
periods, time per order and service standards will
gradually decrease leading to high burnout rates.
(Oliva & Sterman, 2001). Using qualitative and
quantitative methods we determined the patient
related factors and characteristics that contribute to
delays and modelled the patient journey through CT.
This virtual or digital “twin” of a CT department
allows experimentation with staffing, schedules,
additional scanners and demand levels. Metrics
monitor the effect of these changes on the staff
workload and patient experience as well as resource
utilisation and waiting lists.
This research seeks to quantify the effect of
mixing scheduled and unscheduled patient groups,
on resource utilisation, using DES. Radiology model
examples were not identified in the literature which
simultaneously capture patient complexity and
service received as well as resource utilisation and
radiographer workload. This holistic model has the
potential to support daily operations and longer term
policy making, which includes both the patient and
the staff experience in the department.
2 METHODOLOGY
Ethical approval to conduct the study and access
radiology data was obtained from the hospital Board
of Management. A mixed method approach was
taken with ongoing validation and verification with
stakeholders. The department modelled provides
24/7 acute surgery, acute medicine and critical care
along with emergency department and maternity
services. Following exploratory interviews with
decision makers the following methodology was
used:
1. Workflow mapping of CT process
2. Identification of required patient data
3. Analysis of data
4. DES model building and validation
5. Future simulations design.
Patient arrival, preparation, scanning and
observation were mapped. Expert evaluations were
made following mapping and model completion and
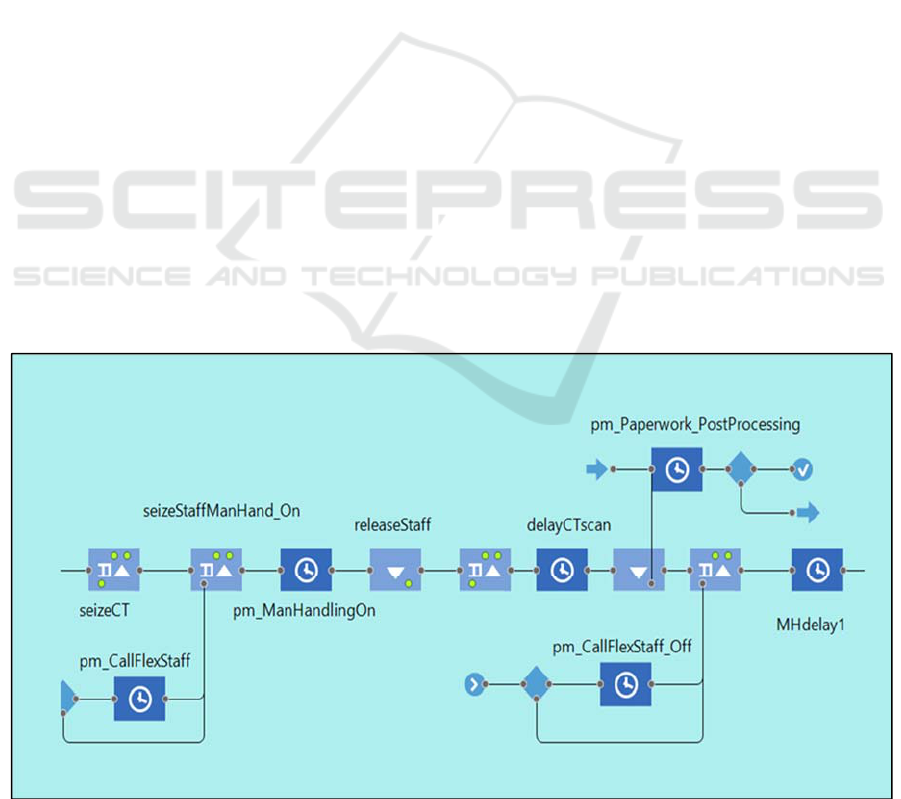
revisions made where necessary. Figure 1 is a
section of the model relating to patient scanning and
staff utilisation. In this section resources, such as the
staff required for manual handling, are seized and
released for the task durations.
Figure 1: Model section related to patient scanning.
KMIS 2019 - 11th International Conference on Knowledge Management and Information Systems
318
Data pertaining to over 10,000 CT examinations
over a period of 2 years were analysed. Of interest
were examination types, and time stamps for
examinations being ordered, scheduled, arrived,
ended and reported. Patients were categorised as
either scheduled or unscheduled. Scheduled patients
included outpatients and general practitioner patients
and unscheduled patients included emergency
department, medical assessment unit and Inpatients.
Unscheduled patients automatically have a higher
priority and are generally scanned on the same day
as being ordered. Data was analysed to determine
Poisson arrival rates for Inpatient and Outpatient
orders. Outpatient waiting lists for CT scans and
data pertaining to patient time spent in the
department were analysed. Data was analysed in
Microsoft Excel and R Studio (R Core Team, 2013).
Interviews with stakeholders including
radiologists and radiographers were carried out to
determine if the process maps were accurate and to
discuss what factors impact patient throughput and
staff perception of workload. Staff were asked the
following questions suggested by Sterman (2000):
Can you understand this model and its concept?
Are the theories underlying the model correct?
What’s missing from the model that should be
included?
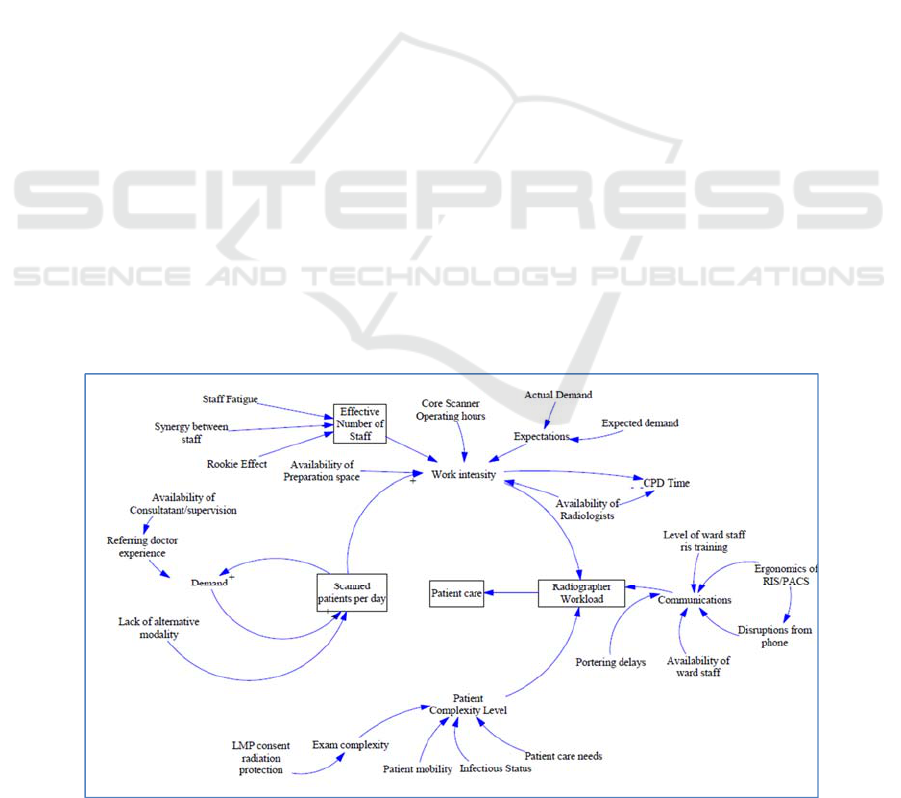
Feedback from the interviews was graphically
collated in Figure 2. The patient related factors were
identified and data obtained for same. Results from
the semi structured interviews grouped the factors
affecting radiology workload into the following
categories.
1. Referring doctor requesting patterns and
expectations,
2. Staff synergy and skill mix,
3. Environmental factors, noise, disruptions,
distance
4. Poor use of Radiology information systems such
as impacting on communications with wards and
porters,
5. Patient characteristic factors.
Table 1 lists patient characteristic factors, their data
type and the data source used. These factors were
incorporated into the model. The software Any logic
was used to create a DES model of the process
(Anylogic Personal Learning Edition 8.4.0, 2019).
The model includes logic, statistics and simulation
pages. The statistics page consists of a dashboard
including resource utilisation, activity breakdowns
and performance metrics. The simulation page,
provided the user with the facility to change the
following:
The number of radiographers and HCAs
The number of scanners
The arrival rate of patients (demand)
Patient mix scenario
Alternative scheduling options
The model was designed to export data to an excel
spreadsheet on execution of the model. Patients were
stochastically generated and CT start and end times
captured. This model was developed for a specific
purpose and its validity determined with respect to
that purpose. (Sargent, 2013)
Figure 2: Graphical collaboration of results of stakeholder interviews.
Knowledge Management in Healthcare: Information Requirements When Creating a Decision Support Tool in Radiology
319
A combination of techniques was used to validate
and verify the model’s accuracy. Historical data was
compared to the model data for validation.
Comparison was made between mean length of time
in system and mean errors. Face to face validation
was used for model input parameters and
assumptions. Animation was used to verify patient
and staff flow through the department.
Based on the overall results of the validation and
the endorsement by staff, it was affirmed that the
simulation model adequately represented the
process.
Table 1: Patient complexity factors and data sources.
Patient
Factors
Data Type Data source
Patienttype
Scheduledor
Unscheduled
Radiology
Information
System
Exam
complexity
Defined by whether
contrast intravenous
contrast (IV), oral
contrast, no contrast,
IV and oral or
procedure involving
radiologis
t
Radiology
Information
System
Infectiousness
status
Absence or presence of
infection alert on
system
Patient
Administration
System
Patient care
needs
Administrative patient
care captured by phone
calls made to schedule
Inpatients. Face to face
patient care times
observed.
Phone records
observation
Patient mobility
Walking, Wheelchair
or trolley/bed.
Online survey
3 RESULT
An analysis of yearly demand showed significant
growth (p=1.05e-12 which equates to 430
examinations per year) for unscheduled exams with
no significant change in the number of scheduled
examinations completed p=0.907. 73% of the work
was found to be generated by unscheduled patients
and the remaining 27% by scheduled patients.
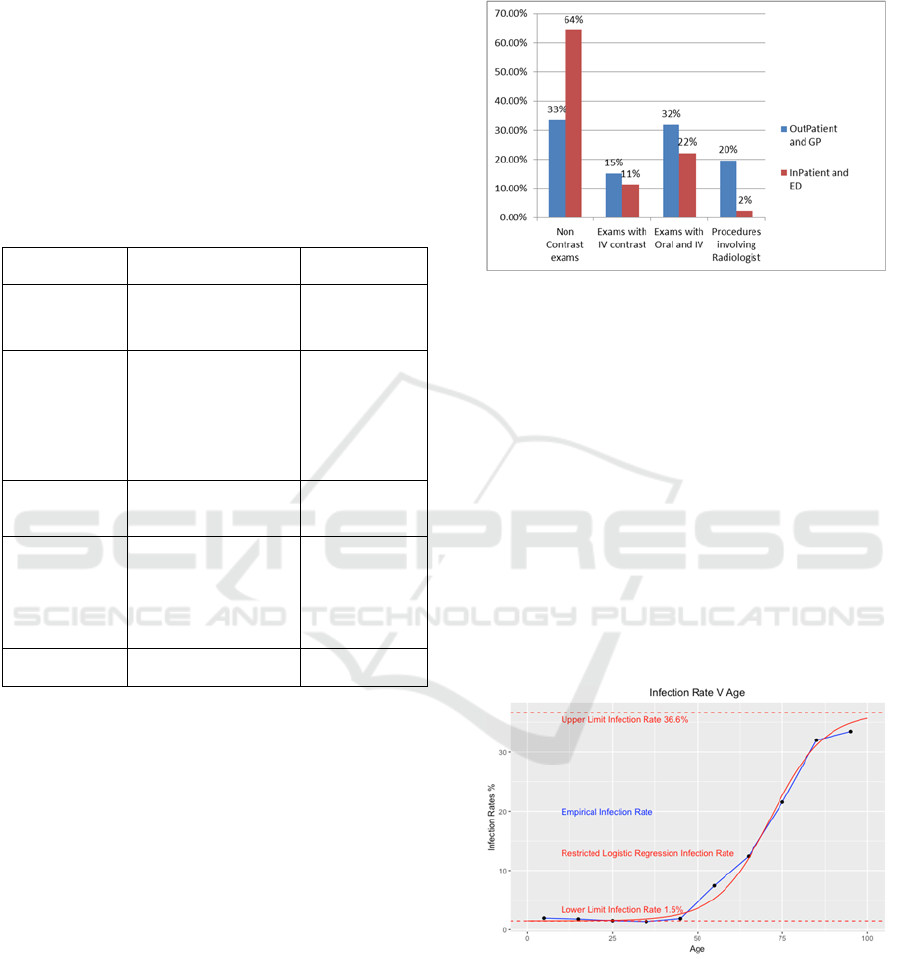
Exam complexity refers to the type of exam,
exam duration and resources required. A breakdown
of all CT exams showed non-contrast (45%), IV
contrast (20%), Oral and IV contrast (25%), Oral
only (3%) and interventional (7%). IV and Oral refer
to the types of contrast used in the scan to provide
additional information to the diagnostic test. Each
type of contrast has different preparation steps and
requiring different resources and durations. When
further broken down into scheduled and unscheduled
64% of unscheduled exams are non-contrast
compared to 33% of scheduled, Figure 3.
Figure 3: Inpatient/Outpatient breakdown by exam type.
Data on patient infectiousness was obtained from
the PAS (patient administration system). Where
patients identified as infectious an “alert” with the
name of the infection appeared in their records.
8.8% of inpatients were documented as infectious
(p-value: 0.965) thus requiring more staff time with
scheduling constraints. Using logistic regression we
conclude that infection rate increases with age
(Figure 4), base infection rate of 1.5% and a ceiling
of 36.6% with p<2e-16. Polynomial regression was
used to determine the relationship between patient
length of stay and likelihood of infection. As length
of stay increases, the likelihood of infection is seen
to increase, p-value: 1.268e-07, Adjusted R-squared:
0.9683.
Figure 4: Age and infectiousness relationship using
logistical regression.
A survey carried out as part of this work,
reported that 26% of inpatients were estimated to
have mobility issues, thus requiring a wheelchair or
trolley/bed. This data was used to populate the DES
model and incorporate time delays for patients with
mobility issues. Additional staff are required to
KMIS 2019 - 11th International Conference on Knowledge Management and Information Systems
320
assist with manual handling (transfer of patient onto
the CT bed). These additional staff are called
flexible staff and the time taken to call these staff
and wait for their arrival as well as the time taken to
carry out manual handling tasks are included in the
model. From observation it was determined that a
minimum of 4 staff are required for the manual
handling transfer of a trolley patient, 2 for a
wheelchair bound patient and 1 staff member is
required to assist where the patient can walk.
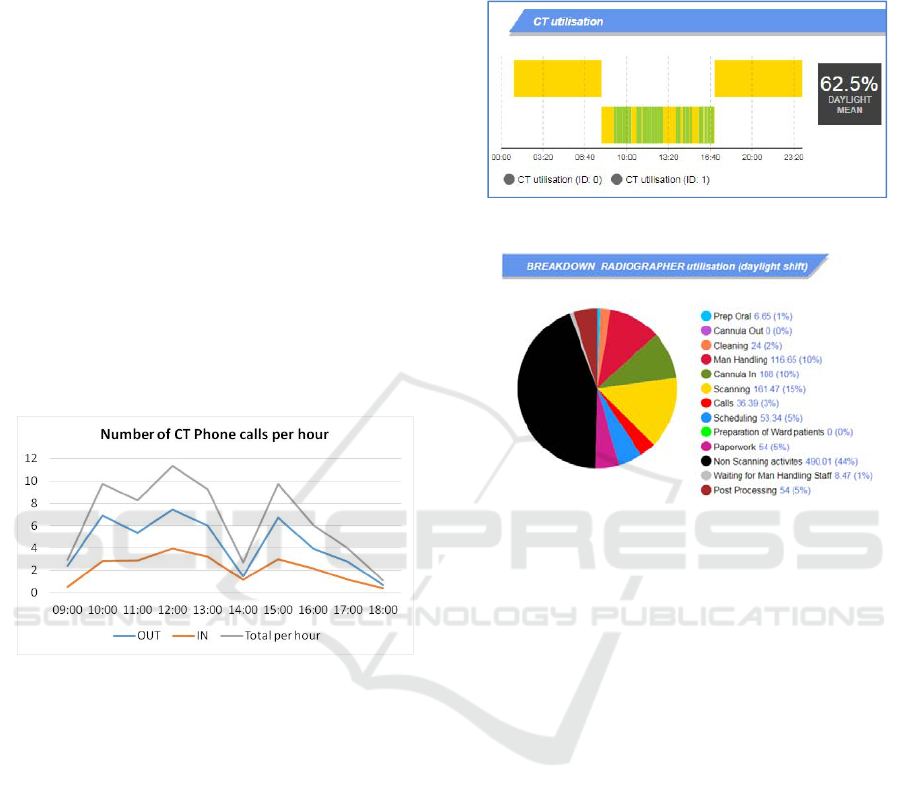
Figure 5 graphs the phone traffic data to and
from CT. 33% of calls were made to the CT control
area and 67% of calls were made from the CT
control area. On average CT staff make 2 calls to
arrange preparation and transportation for patients
and 1 call per patient from ward staff and referrers.
Observational data was obtained for the more
traditional face to face patient care that patients
receive while in the CT department. Again inpatients
were seen to require more time and had greater
patient care needs.
Figure 5: Phone activity related to inpatient scheduling.
These general findings demonstrate the ability of the
model to capture the following:Scanner utilisation levels.
Staff utilisation levels
Detailed task breakdown
Number of flexible staff required
Number of tasks completed per hour
Average delays caused by patient type
Average experienced by patient type
In the example provided (Figure 6), scanner
utilisation was 62.5% between 9am to 5pm. 27
patients were scanned. Activities taking place in the
room include patient scanning, room cleaning and
patient preparation.
Similar charts show radiographer utilisation of
54.1% and health care assistant utilisation levels of
37%. Figure 7 provides a breakdown of staff
utilisation by task type for each radiographers and a
health care assistant on the same day. The pie charts
were designed to include all administrative, clinical
and non-clinical tasks associated with scanning.
Radiographer’s staff spent 1 hour 29 minutes
scheduling and answering calls.
Figure 6: Scanner utilisation captured on DES model.
Figure 7: Staff utilisation by task.
The model captured the number of staff (36) that
were required to assist with manual handling and the
combined personnel time taken to do so (126
minutes). The average work perturbation (delays,
disruptions, complications) for scheduled and
unscheduled patients shows that inpatients caused on
average 8 minutes more delays per exam (Figure 8).
This is due to their manual handling needs, phone
calls associated with their scheduling, patient care
needs and transportation delays. The model allows
the delays for each patient to be examined. In this
way delays can be attributed to the patient’s mobility
or other characteristics and the process modified and
staffed accordingly.
4 DISCUSSION
Outpatients are scheduled by administrative staff in
advance of arrival. Using phone records we
demonstrate the extra radiographer resources and
patient care required to schedule an inpatient and
Emergency Room CT examination. The increased
administrative duties associated with unscheduled
patients means that patient type is an important
factor affecting radiology workload.
Knowledge Management in Healthcare: Information Requirements When Creating a Decision Support Tool in Radiology
321
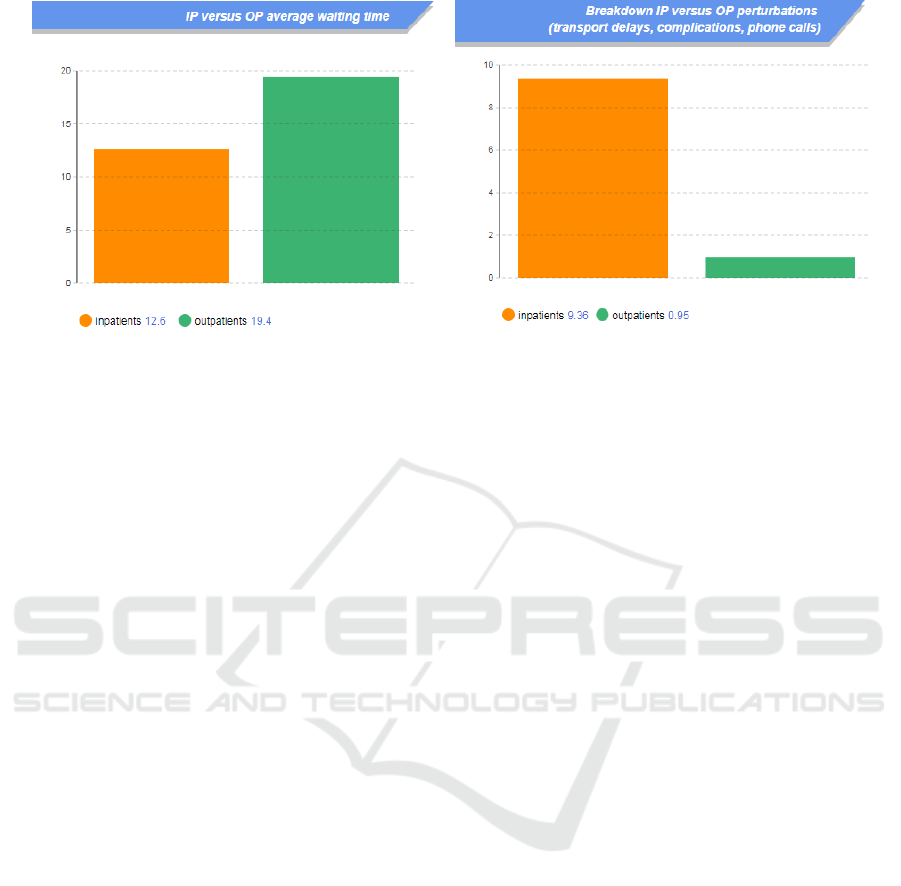
Figure 8: Average waiting times and average causes of delays by patient type.
There were 3 phone calls identified per inpatient
exam completed. The information system, if used as
intended, could potentially reduce this to 1 phone
call or less per exam. An analysis of phone records
indicates a suboptimal use of the information
system. Some ward staff and referring doctors
reported that they do not use the system to track
patient requests and routinely place calls to verify a
request has been received and that a time has been
allocated. Peak arrival times for phone calls coincide
with peak scanning time (Figure 5) so interruptions
while scanning are common and represent a
potential safety hazard as these occur at critical
times such as when injections are being carried out.
(Kansagra, Liu & Yu, 2016)
Infectiousness applies only to inpatient and
emergency patients in this study as the infection
status of outpatients is generally unknown, though
universal precautions are taken for all patients.
When a patient is determined to be infectious extra
time is required to use personal protective equipment
(PPE), isolate patients from healthy patients, and to
allow for cleaning and drying time. A regression
analysis shows a relationship between age and
length of stay on the likelihood of infection. Exams,
on which patient discharge depends, should
therefore be expedited.
Patient immobility is seen to contribute to staff
workload and results in delays. A patient transfer
from trolley to scanner requires up to 6 staff. It takes
time to transfer patients and extra delays occur
where staff members are not immediately available
to assist. Reliance on flexible staff to assist with
manual handling incurs time delays in sourcing them
and the DES model allowed this to be quantified.
The extensive data analysis of the service and
patient characteristics created a new appreciation for
tasks previously underestimated, in particular the
time taken for the scheduling of inpatient exams and
time spent waiting for manual handling assistance
from flexible staff. This model creates metrics not
previously available to managers such as the time
spent scheduling and answering calls (1hr 29 mins).
The model outputs provide decisions makers
with detailed data on how staff are utilised
throughout the day and how work intensity varies
throughout the day. Radiographer’s utilisation was
54.1% and scanner utilisation was 62.5%, on this
day where 27 patients were scanned. Each
radiographer was scanning on average 15% of the
time. Where a decision is required as to whether a
new CT scanner should be purchased, this
information can be used to support such a decision
or to reengineer the current workflow. Separation of
tasks as demonstrated in figure 7 can allow
managers to decide how a radiographer’s time is
spent. Tasks can be identified as value adding or
non-value adding and a lean approach taken (Liker,
2003). Lean manufacturing principles could be used
to improve the flow of patients through CT, resulting
in a reduction in time delays (Ng et al., 2010).
A metric was created for delays and disruptions
which Reinus et al described as “schedule busters”
resulting in workflow perturbations. Inpatients are
seen to have higher work perturbation times than
outpatients (8 minutes versus 1 minute) (2000).
Currently a maximum of ten outpatients are scanned
per day. The high variation in inpatient demand and
associated work perturbations is cited as a reason for
limiting how many are booked. Where outpatient
lists are growing efforts can be made to block book
outpatients thus reducing variability.
The model allows simulation of “what-if”
scenarios such as:
KMIS 2019 - 11th International Conference on Knowledge Management and Information Systems
322

• How block scheduling of similar outpatient
examinations can increase standardisation of
work and improve throughput.
• How pooling of resources between multiple
scanners can improve staff utilisation and
counteract work perturbations
Future work on optimisation of radiographer to
health `care assistant ratios and exam type
scheduling using constraints such as acceptable
patient time delays will be carried out.
5 CONCLUSION
Using qualitative and quantitative methods we
determined the patient characteristics that contribute
to process delays and efficiency while quantifying
the growth in demand for Radiology services. The
use of information garnered from the DES model
described here, allowed a more informed breakdown
of process capacity, which included patient mix and
resulting inherent stochastic delays. As a decision
support tool, it allows manipulation of parameters
such as the number of staff, the patient mix and the
number of scanners. Decision makers can use this
model to experiment with “what if scenarios” and
make evidence based decision in the best interest of
the department.
Patient parameters such as mobility and infection
and patient care are common amongst patients so the
findings can be applied to other allied health
services and in other healthcare simulation projects.
Future work will use discrete event simulation to
model the radiology service and simulate alternative
service delivery models.
Inpatient demand is increasing while the
outpatient service is stagnant. The demand for
inpatients examinations is affecting the ability of
departments to meet the demand for the outpatient
and general practitioner services.
In the short term radiographers and other health
care professionals have the capacity to absorb extra
work without increase staffing levels, but modelling
can allow us to assess workflow and workload, and
staff accordingly so as to avoid unintended
consequences, such as burnout, fatigue, staff attrition
and poor patient care. The key challenges facing
healthcare providers in future years may be more
organisational and logistical than medical and
scientific (Brailsford & Vissers, 2011). The model is
intended to inform how patient complexity,
interruptions, complications and the staff mix
(radiographers and assistants) affect the capacity of a
CT process, so as to provide a detailed overview and
understanding of the process.
DES provides a graphic tool for managers and
models the patient the staff, the process and the
information systems. DES requires high stakeholder
involvement at each step of the way from conceptual
model building to validation and simulation design.
Simulation has been described as the main way we
can discover for ourselves how complex systems
work, what the impact of different policies might be,
and thus integrate science into decision making
(Sterman, 2011).
ACKNOWLEDGEMENTS
The authors would like to acknowledge the insights
and support provided by the Radiology Staff of
Portiuncula Hospital, Ballinasloe, County Galway.
The views expressed are those of the author and not
those of the Health Service Executive. This work
was supported by the National University of Ireland,
Galway Hardiman PhD Scholarship.
REFERENCES
Anylogic Personal Learning Edition 8.4.0. 2019.
Anylogic. Oakbrook Terrace Tower: AnyLogic North
America. Retrieved from https://www.anylogic.com/
Bleiker, J., Knapp, K. M., Morgan-Trimmer, S., &
Hopkins, S. J. 2018. “It’s what’s behind the mask”:
Psychological diversity in compassionate patient care.
Radiography, 24, S28–S32. https://doi.org/
10.1016/J.RADI.2018.06.004
Booker, M. T., O’Connell, R. J., Desai, B., & Duddalwar,
V. A. 2016. Quality Improvement with Discrete Event
Simulation: A Primer for Radiologists. Journal of the
American College of Radiology, 13(4), 417–423.
https://doi.org/10.1016/j.jacr.2015.11.028
Brailsford, S., & Vissers, J. 2011. OR in healthcare: A
European perspective. European Journal of
Operational Research, 212(2), 223–234.
https://doi.org/10.1016/j.ejor.2010.10.026
Brask, K. B., & Birkelund, R. 2014. “patient care in
radiology” - The staff’s perspective. Journal of
Radiology Nursing, 33(1), 23–29.
https://doi.org/10.1016/j.jradnu.2013.12.001
Central Statistics Office. 2015. Regional Population
Projections 2016 - 2031 - CSO - Central Statistics
Office. Retrieved from http://www.cso.ie/en/
releasesandpublications/er/rpp/regionalpopulationproje
ctions2016-2031/
Cowan, I. A., Macdonald, S. L. S., & Floyd, R. A. 2013.
Measuring and managing radiologist workload:
measuring radiologist reporting times using data from
Knowledge Management in Healthcare: Information Requirements When Creating a Decision Support Tool in Radiology
323

a Radiology Information System. Journal of Medical
Imaging and Radiation Oncology, 57(5), 558.
https://doi.org/10.1111/1754-9485.12092
Fung Kon Jin, P. H. P., Dijkgraaf, M. G. W., Alons, C. L.,
Van Kuijk, C., Beenen, L. F. M., Koole, G. M., &
Goslings, J. C. 2011. Improving CT scan capabilities
with a new trauma workflow concept: Simulation of
hospital logistics using different CT scanner scenarios.
European Journal of Radiology, 80(2), 504–509.
https://doi.org/10.1016/j.ejrad.2009.11.026
Gahan, J. 2010. Observational study of the capacity and
demand of plain-film workflow in a radiology
department. Radiography, 16(3), 182–188.
https://doi.org/10.1016/j.radi.2010.01.004
Huang, Y.-L., & Marcak, J. 2013. Radiology scheduling
with consideration of patient characteristics to improve
patient access to care and medical resource utilization.
Health Systems, 2(2), 93–102.
https://doi.org/10.1057/hs.2013.1
Kansagra, A. P., Liu, K., & Yu, J.-P. J. 2016. Disruption
of Radiologist Workflow.
https://doi.org/10.1067/j.cpradiol.2015.05.006
Lakdawalla, D. N., Bhattacharya, J., & Goldman, D. P.
2004. Are The Young Becoming More Disabled?
Health Affairs, 23(1), 168–176. https://doi.org/
10.1377/hlthaff.23.1.168
Liker, J. K. 2003. The 14 Principles of the Toyota Way :
An Executive Summary of the. The 14 Principles of
the Toyota Way : An Executive Summary of The, 35–
41.
Lu, L., Li, J., & Gisler, P. 2011. Improving financial
performance by modeling and analysis of radiology
procedure scheduling at a large community hospital.
Journal of Medical Systems, 35(3), 299–307.
https://doi.org/10.1007/s10916-009-9366-6
Ng, D., Vail, G., Thomas, S., & Schmidt, N. 2010.
Applying the Lean principles of the Toyota Production
System to reduce wait times in the emergency
department. Canadian Journal of Emergency
Medicine. https://doi.org/1623 [pii]
Oliva, R. 2002. Tradeoffs in responses to work pressure in
the service industry. IEEE Engineering Management
Review, 30(1), 53–62. https://doi.org/10.1109/
EMR.2002.1022405
Oliva, R., & Sterman, J. D. 2001. Cutting Corners and
Working Overtime: Quality Erosion in the Service
Industry. Management Science. https://doi.org/
10.1287/mnsc.47.7.894.9807
Pitman, A., Jones, D. N., Stuart, D., Lloydhope, K.,
Mallitt, K., & O’Rourke, P. 2009. The Royal
Australian and New Zealand College of Radiologists
(RANZCR) relative value unit workload model, its
limitations and the evolution to a safety, quality and
performance framework. Journal of Medical Imaging
and Radiation Oncology
, 53(5), 450–458.
https://doi.org/10.1111/j.1754-9485.2009.02094.x
R Core Team 2014. R: A language and environment for
statistical computing. R Foundation for Statistical
Computing, Vienna, Austria. URL http://www.R-
project.org/
Rachuba, S., Knapp, K., Ashton, L., & Pitt, M. 2018.
Streamlining pathways for minor injuries in
emergency departments through radiographer-led
discharge. Operations Research for Health Care, 19,
44–56. https://doi.org/10.1016/j.orhc.2018.03.001
RCSI. 2011. Measuring Consultant Radiologist workload
in Ireland : (March).
Reinus, W. R., Enyan, A, Flanagan, P., Pim, B., Sallee, D.
S., & Segrist, J. 2000. A proposed scheduling model to
improve use of computed tomography facilities.
Journal of Medical Systems, 24(2), 61–76. Retrieved
from http://www.ncbi.nlm.nih.gov/pubmed/10895421
Sargent, R. G. 2013. Verification and validation of
simulation models. Journal of Simulation, 7(1), 12–24.
https://doi.org/10.1057/jos.2012.20
Shukla, N., Keast, J. E., & Ceglarek, D. 2014. Improved
workflow modelling using role activity diagram-based
modelling with application to a radiology service case
study. Computer Methods and Programs in
Biomedicine, 116(3), 274–298.
https://doi.org/10.1016/j.cmpb.2014.05.005
Sterman, J. D. 2000. Business dynamics. System thinking
and modeling for a complex world. McGraw-Hill
Education. Boston: , (January 2000), 982 pp.
https://doi.org/10.1016/S0022-3913(12)00047-9
Sterman, J. D. 2011. Communicating climate change risks
in a skeptical world. Climatic Change, 108(4), 811–
826. https://doi.org/10.1007/s10584-011-0189-3
Sturm, R., Ringel, J., Lakdawalla, D., Bhattacharya, J.,
Goldman, D., Hurd, M., … Andreyeva, T. 2007.
Obesity and Disability: The Shape of Things to Come.
RAND Corporation. https://doi.org/10.7249/RB9043-1
KMIS 2019 - 11th International Conference on Knowledge Management and Information Systems
324
