
Prediction of Public Procurement Corruption Indices using Machine
Learning Methods
Kornelije Rabuzin and Nikola Modrušan
a
Faculty of Organization and Informatics, University of Zagreb, Pavlinska 2, Varaždin, Croatia
Keywords: Fraud Detection, Corruption Indices, Public Procurement, Text Mining, Data Mining, Big Data, Knowledge
Discovery.
Abstract: The protection of citizens’ public financial resources through advanced corruption detection models in public
procurement has become an almost inevitable topic and the subject of numerous studies. Since it almost
always focuses on the prediction of corrupt competition, the calculation of various indices and indications of
corruption to the data itself are very difficult to come by. These data sets usually have very few observations,
especially accurately labelled ones. The prevention or detection of compromised public procurement
processes is definitely a crucial step, related to the initial phase of public procurement, i.e., the phase of
publication of the notice. The aim of this paper is to compare prediction models using text-mining techniques
and machine-learning methods to detect suspicious tenders, and to develop a model to detect suspicious one-
bid tenders. Consequently, we have analyzed tender documentation for particular tenders, extracted the
content of interest about the levels of all bids and grouped it by procurement lots using machine-learning
methods. A model that includes the aforementioned components uses the most common text classification
algorithms for the purpose of prediction: naive Bayes, logistic regression and support vector machines. The
results of the research showed that knowledge in the tender documentation can be used for detection
suspicious tenders.
1 INTRODUCTION
Public procurement is an important segment of the
economy, a process through which the state spends
public money. The total value of public procurement
in the Republic of Croatia in 2017 amounted to
40,451,227,766 HRK (~5,500,000,000 EUR)
excluding VAT, which is approximately one third of
the annual budget (Directorate for the public
procurement system, 2017). In line with these
impressive figures, questions are often raised about
how this money is spent, how corrupt these purchases
are and how to prevent this corruption (Budak, 2016).
Budget users are dissatisfied because their money
does not get them what they really need; therefore,
this area seems to be very corrupted, especially since
Croatia has regressed in the fight against corruption
(Transparency International, 2018). The European
Union is working to promote anti-corruption through
the European Anti-Fraud Office (OLAF). The EU-
funded HERCUL III funding program is designed to
protect the Union's financial interests, and it
a
https://orcid.org/0000-0002-0987-7090
contributes to increased transnational cooperation
and coordination at the EU level, between Member
State bodies and OLAF, thereby improving the
competitiveness of the European economy and
ensuring the protection of taxpayer money (OLAF,
2017). On average, corruption accounts for 5% of the
total value of public procurement, within the range of
about 2.2 billionkunas (~700,000,000 EUR). This is
why researchers in past years have been trying to
understand corruption and detect suspicious actions.
With the aim of detecting corruption indices and
corrupt competition, previous investigations have
used statistical and analytical methods to detect
certain attributes (red flags) in the entire public
procurement process (Charron et al., 2016; Fazekas
and Tóth, 2016; Németh and Tünde, 2013; Ferwerda
et al., 2016). Yet we can never safely say that these
are corrupt competition and must instead talk about
corruption risk score (Fazekas and Tóth, 2016).
Timely analysis can be done at any stage of
competition, although the best option is prevention
itself, which prevents losses and protects the financial
Rabuzin, K. and Modrušan, N.
Prediction of Public Procurement Corruption Indices using Machine Learning Methods.
DOI: 10.5220/0008353603330340
In Proceedings of the 11th International Joint Conference on Knowledge Discovery, Knowledge Engineering and Knowledge Management (IC3K 2019), pages 333-340
ISBN: 978-989-758-382-7
Copyright
c
2019 by SCITEPRESS – Science and Technology Publications, Lda. All rights reserved
333

resources of the state before any loss has occurred. In
this case, the data that we need to focus on is
contained in the Tender Documentation (TD), which
describes procurement, technical conditions,
deadlines, estimated values and other data necessary
for the Economic Operator to submit a valid bid.
(MEEC, 2018). For this reason, the purpose of this
paper is to use different machine-learning algorithms
with the tender documentation of a particular public
procurement procedure and determine whether it can
be used to detect indications of corruption in public
procurement. Text mining is a process of knowledge
extraction from unstructured text content and can be
used to determine the relationship between variables;
in our example, whether a tender is a single bid or not
(Fissette, 2017). We will develop our model by
considering the CRISP-DM framework, which
presents a common and documented framework
consisting of six phases (Chapman et al., 2000).
The following sections will cover Data
Understanding, Data Preparation, Modeling and
Evaluation. The Business Understanding phase was
already covered in the introduction section. It is
important to note that the phases of deployment were
covered in the Modeling and Evaluation phase.
2 REVIEW OF LITERATURE
In order to protect financial interests within its
borders, the state finances the development of
application solutions (Daisy, Arachne, Pluto,
Malaysia) and thus promotes the design and
definition of different policies (Azmi and Rahman,
2015; Wensink et al., 2013; Németh and Tünde
2013). Numerous robust and informatically advanced
solutions have also implemented different methods
for detecting corruption, not only in public
procurement but also in the supply chains of certain
large companies (Dhurandhar et al., 2015).
Corruption-detecting procedures can occur at
different stages of the public procurement process -
from the creation of tenders to the implementation,
writing of documents, awarding of contracts and
realization. For each of these processes, different red
flags or indicators, specific to each of these steps and
representative of the possibility of corruptive actions,
are identified. As an example, in the process of
preparing the tender, the short submission period can
be interpreted as one potential red flag because a short
submission period leaves less time and makes harder
to bid for companies that are not familiar with tender
subject. In the same why we can observe the fact that
selecting non-open and less transparent tender
procedures reduces the number of possible bids and
opens a space for awarding a contract to the same
well-connected company. (Fazekas et al., 2016).
Detection of important indicators is often carried
out through interviews with experts and users of
public procurement, as well as with statistical
methods which are used to determine their
importance (TI, 2018 and Ferwerda et al., 2016). For
the EU project, Wensink and Vet (2013) have
developed a special methodology for calculating the
risk index of corruption based on logistic regression,
but the results are not satisfactory due to the small
number of samples and indicators. The Center for
Research on Corruption in Budapest has used various
scientific papers and projects to detect corruption
indicators and they have outlined the relevant ones
using statistical methods (Fazekas et al, 2016). Out of
a total 30 indicators, they found 14 relevant. These
indicators are assigned "certain weights and summed
to produce corruption risk composite indicators for
individual transactions" (Fazekas et al., 2016). The
method is called the CRI, or Corruption Risk Index.
Charron et al. (2016) developed two other methods to
calculate the risk of corruption that analyze
corruption through two different spheres, namely
political influence and political control. For each of
them, information on tenders, as well as information
regarding political influence or control, is required.
Some of these indicators are the type of process,
whether there are one or more bids, whether the same
bidder always receives a bid, the time interval for
bidding, etc.
By digitizing the public procurement process,
some indicators may become irrelevant because they
are embedded as a business rule, such as, for example,
the term of the procedure or the selection of
procurement procedures. Neither method enters the
core of the process itself, the documentation, because
they are based on the aforementioned set of data that
does not have all the necessary information (Fazekas
et al., 2016; Németh and Tünde, 2013; Ferwerda et
al., 2016; Sales and Carvalho, 2016). In addition to
statistical methods, scientists in this field of research
have also taken important steps forward using a range
of artificial intelligence techniques, including neural
networks, deep learning, linear regression, support
vector machines and discriminant function analysis.
The aim was to create a model that would conduct risk
assessment related to certain bidders based on
indicators to be used as information for the Purchaser
in the public procurement process (Sun and Sales,
2018). Using a Bayes network, a risk-measurement
model of companies or bidders negotiating the public
procurement process was created, using indicators
KMIS 2019 - 11th International Conference on Knowledge Management and Information Systems
334

grouped into four dimensions: operational capacity,
competitive profile, political ties and the history of
penalizing bidders (Sales and Carvalho, 2016).
All these studies suggest that there is a need to
introduce additional indicators, precisely because of
the aspects not included in the model. Furthermore,
the legislation in each country may differ, and some
indicators may be specific to certain countries. Some
researchers have applied the same methodology to
data collected from various state agencies to detect
whether there is a breach in procurement in the
segment of small purchases (below the EU threshold,
about 25000 euros) (Carvalho et al., 2014). Apart
from the descriptive attributes, there are few
indicators or data that can be extracted from the
electronic public procurement system other than the
bidding documentation itself. The documentation
usually contains some basic elements defined by law
and represents a document in which the contracting
authority describes the subject matter and all the
necessary conditions that the bidder must satisfy to
pass the evaluation phase. These include the manner
of making the bid, deadlines, technical and
professional abilities, the type of process, the
estimated value and the other content required for the
creation and submission of the bid (MEEC, 2018).
Since the data set is focused solely on public
procurement, research suggests that applying Big
Data and using data-mining methods to achieve better
results will lead to better indicators (Fazekas and
Kocsis, 2017).
The aim of this paper is to use machine-learning
methods over the textual content of bidding
documentation to prove that we can thus find
indications of corruption in public procurement. For
this purpose, we will use text-mining techniques.
Although there are no relevant works about text
mining on public procurement tendering documents,
text mining is used to detect indications of corruption
in insurance, finance, medicine and many other areas
that focus not on corruption but on predicting certain
target variables (Pal and Pal, 2018; Gupta and Gill,
2012; Eman, 2015; Ramzan et al., 2016). For this
reason, data-mining methods investigated Multilayer
Feed Forward Neural Network, Support Vector
Machines, Genetic Programming, Group Method of
Data Handling, Logistic Regression, Probabilistic
Neural Network, Decision Tree, Artificial Neural
Network, Bayes Networks, Nearest Neighbor and
others (Kotsiantis et al., 2007; Efstathios et al., 2007).
3 DATA UNDERSTANDING
When using machine learning methods, usually we
need to determine the target variable. Unfortunately,
in Croatia, there are no labeled data on whether a
competition (a tender) was declared corrupt.
Information that could lead to an assumption of
corruption has recourse to the procedures of the State
Commission for Control of Public Procurement,
which, on appeal, can annul the procedure itself, or
part of the procedure, if it is a tender with several
different procurement lots. As target variables, we
can use either accurately classified observations
(fraud or not) or observe dependent variables - some
other events that can be considered suspect (Ferwerda
et al, 2016; Fazekas and Kocsis, 2017; Wensink and
Vet, 2013; Sales and Carvalho, 2016).
In accordance with the above, we focus on tenders
having one bid, as they could be potentially
suspicious. Thus, our model will focus on detecting
tenders that will end up with one bid, taking into
account the extracted and optimized text from tender
documentation using Natural language processing
(NLP) methods (Bird, 2009. We will explain the
procedure later on (Section 4).
Data-mining techniques have been applied to the
entire content of the documentation, but due to a large
number of documents with large amount of text, it is
necessary to find a part of the text that will provide
satisfactory attributes for our model. Of course, there
are tenders that can only be done by one bidder, for
example when only one company has knowledge,
experience, authors rights in tender area; but in this
case, it is necessary to choose a different type of
procedure e.g., negotiating procedure. If we have only
one bid in the open public procurement procedure, we
do not actually have any competition. These tenders
are ideal as a result of the corruptive behavior of
different participants (Fazekas and Kocsis, 2017).
For this purpose, we conducted interviews with
experts in the field of public procurement. The main
task was to hear their opinion about how, in tender
documentation, the contracting authority can apply
unfair assessment criteria to bids, making it
impossible for most bidders to be successful. We
concluded that in the “technical and professional
capability” section of the tender documentation, the
contracting authority set out all the technical and
professional conditions and criteria related to the
particular topic of the tender. Our conclusion is
confirmed by a European Commission paper
claiming this point as a conflict of interest: “the
established technical criteria for the procured items
could be adjusted to favor certain bidders: in some
Prediction of Public Procurement Corruption Indices using Machine Learning Methods
335

cases one bidder may actually be involved in writing
them” (European Commission, 2017).
In this section, for example, they provide
requirements for different quantities and descriptions
of experts to execute contracts. We can also conclude
that the contracting authority has enough “space” for
creating conditions and criteria that can only be met
by the desired bidder, who is already familiar with the
outcome of the tender. For these reasons, we decided
to extract only the part of each tender documentation
related to technical and professional ability.
4 DATA PREPARATION
To download tender documents, we created a special
program in Python that downloaded the documents
from the Croatian procurement portal and saved them
into a separate folder. We made a few major
modifications to allow further data processing: all
word documents were converted to the docx file type
and all unreadable documents (pdf scans) were
excluded from further processing,
After all the bidding documentation was in the
docx format, we accessed content related to technical
and professional capabilities. Since this is
unstructured content subject to different editing by
the user, it is impossible to find and extract the precise
part that relates only to technical and professional
ability, i.e., it is very problematic to define the
boundaries. By examining several hundred examples
of bidding documents, we concluded that each
contains a set of technical and professional
capabilities. Therefore, a possible solution is to find
every occurrence of the keywords “technical and
professional” and extract 1000 words from that
location for each occurrence in the document being
viewed. Extracted content is stored in a Microsoft
SQL Server database. Data on the number of bids
from the tender opening record were extracted in a
similar manner.
The content extracted consists of words, numbers,
punctuation marks or sentences. To apply a model,
content must be cleaned, and the model as input
should only provide that which is required, since a
larger amount of input data means longer processing.
Accordingly, we started with tokenization, i.e.,
translated the sentences into separate words or
vectors. For this purpose, we used a nontk.tokenize
module in Python. To reduce the amount of data from
the content, we also ignored all punctuation marks
(e.g., period, comma, question mark), numbers and
words of less than 2 letters, as they mostly refer to
some of the conjunction. Text mining is very sensitive
to capital and lowercase letters, so a computer can
observe one word in two different ways. To solve this
problem, the entire text was stored in the SQL
database in lowercase. With a large number of
documents, the number of tokens generated is also
large, and the data processing is longer and more
demanding. Stop words are the most commonly used
words in a language, and for that very reason, we have
removed them from the corpus (Diaz, 2016). Because
of the composition of a sentence, words are also
subject to rooting. For further reduction of the word
corpus, the technique of stemming the word, i.e.,
transforming it into its root, is well known (Deepika,
2012). Unfortunately, there are no modules in
programming languages to allow automatic
processing for Croatian. This is why we found an
example (Ljubešić et al, 2016) for the Croatian
language and adapted it for our research.
Classification algorithms are based on
mathematical functions, and thus input data are most
often in the form of numbers. Therefore, normalized
token words must be converted into numerical,
computer-comprehensible form. The idea is to
calculate the frequency of the occurrences of each
word in a document and the frequency of occurrences
in all documents, since the former is not sufficient for
processing. Based on these data, we can reach a
conclusion about the importance of a particular word,
since words with a large number of occurrences can
negatively affect the outcome of the model. The
intention is to represent each document as N-
dimensional vector of weights, where N is the number
of distinct terms over all documents. We can observe
a vector as a point in space, so the semantically
similar vectors are near each other and vice versa. In
that case we are talking about Vector Space Modeling
(Turney, 2010) where the most popular method is tfidf
(term frequency inverse document frequency), a
product of two statistics: the frequency of a word in
one document and the inverse frequency of the same
word within the whole corpus (Ramos, 2003). For this
purpose, we used Python methods from the sklear
module: CountVectorizer, which calculates the
number of impressions of an individual word in a
document, and TfidfTransformer, which converts
each word to a given integer. Each complete
document, or observation, is displayed as a vector and
represents the input into the machine learning
algorithms.
KMIS 2019 - 11th International Conference on Knowledge Management and Information Systems
336

5 MODELING AND
EVALUATION
Machine learning is an area of artificial intelligence
that focuses on the design and implementation of
algorithms that improve their performance through
experience. Methods of machine learning fall into
three categories: regression, clustering and
classification (Harrington, 2012). Since the purpose
of this paper is to explore the usage of machine
learning, it is necessary to determine which methods
we will use. From the literature review, we can
conclude that the most common text classification
methods are support vector machines, naive Bayes,
decision trees, logistic regression, KNN classification
algorithms, genetic algorithms and various neuronal
networks (Gupta and Lehal, 2009; Congcong et al,
2014; Ahmed et al, 2017). The model will be trained
and tested on all data, and by groups of procurement
lots defined in the unique Public Procurement
Dictionary (CPV). We will not enter descriptive
algorithms, but to improve the prediction metric and
reduce the general error that may arise due to the
classifier potentially encountering something
unknown, we will do cross validation. The
randomization test was developed by R.A. Fisher
(1935), a founder of classical statistical testing.
In the test, the data are relocated in random order.
For this permutated data, the p-value or the prediction
of the test data is calculated. The research results by
Ron (1995) show that it is best to use 10-fold
validation, since it is the most optimal and efficient
for the model. We must note that the results depend
on the number of observations, the variables and the
variation within them. Generally, this means that all
observations will be divided into 10 equal parts with
9:1 combinations and test the model.
After the data is normalized, the total number of
observations is 15800, of which 4096 tenders ended
with one bid and 11704 tenders with more than one.
The number of bids is the target variable, so all
tenders with one bid are "true", while all tenders with
more than one bid are "false". Using the conclusions
presented in comparative studies (Gupta and Lehal,
2009; Congcong et al, 2014; Ahmed et al, 2017,
Kumar et al, 2019) were comparison of most common
classification algorithms is made, we have choosen:
Naïve Bayes (NB), Logistic regression (LR) and
Support Vector Machines algorithm (SVM). One of
the reasons is their results overall, they are easy to
understand and they have been used in the field of
public fraud detection (Wensink et al, 2013).
We will observe the results through 4 metric
measurements: Accuracy, Precision, Recall and
AUC. Accuracy is a measure of what proportion of
exactly graded examples is in the set of all examples.
We also have two measures to indicate the ratio of
precisely classified examples in a set of positively
classified examples (precision) and the part of
precisely classified examples in the set of all positive
examples (recall). The Area Under the Receiver
Operating Characteristic (ROC) curve, called the
AUC, provides a general evaluation of the model: a
higher AUC suggests the model can better discern
between the two classes (Sales and Carvalho, 2016;
Sokolova et al, 2006).
The first test was performed on the entire data set,
and we can see that metric outputs are expected
(Table. 1). Accuracy on the overall set is a maximum
of 0.68, i.e., logistic regression had the best prediction
accuracy, but recall is 0.27, which means that in the
set of positive examples, only 27% were correctly
classified. Once again, AUC is highest for LR, but
precision is weaker (0.56). The best results are in the
case of the naive Bayes model.
Table 1: Model Results – All Observations.
Metric
Linear reg.
SVM
Naive Bayes
Accuracy
0.69
0.68
0.68
Precision
0.61
0.55
0.68
Recall
0.28
0.3
0.15
ROC
0.59
0.59
0.56
To understand why this is the case, it is necessary
to remember that public procurement orders different
types of services defined by a single public
procurement vocabulary. For example, there are
competitions in the health and social work services
and in IT services (consulting, software development,
internet and support). We think the text content is
dependent on that division, so the model is subjected
to CPV testing. Earlier surveys have shown a higher
rate of corruption in certain CPV groups (Fazekas et
al, 2016). There are 51 groups in the CPV dictionary.
Testing the models in these groups, we have come to
the conclusion that there are groups that have very
few observations or competitions. Although earlier
studies (Wensink and Vet, 2013; Mencıa et al, 2013)
had a small amount of total data, we believe that in
such cases, sufficient modeling cannot be achieved
and there are thus fewer predictions. Therefore, we
excluded all groups with less than 100 observations
from the data set.
Prediction of Public Procurement Corruption Indices using Machine Learning Methods
337
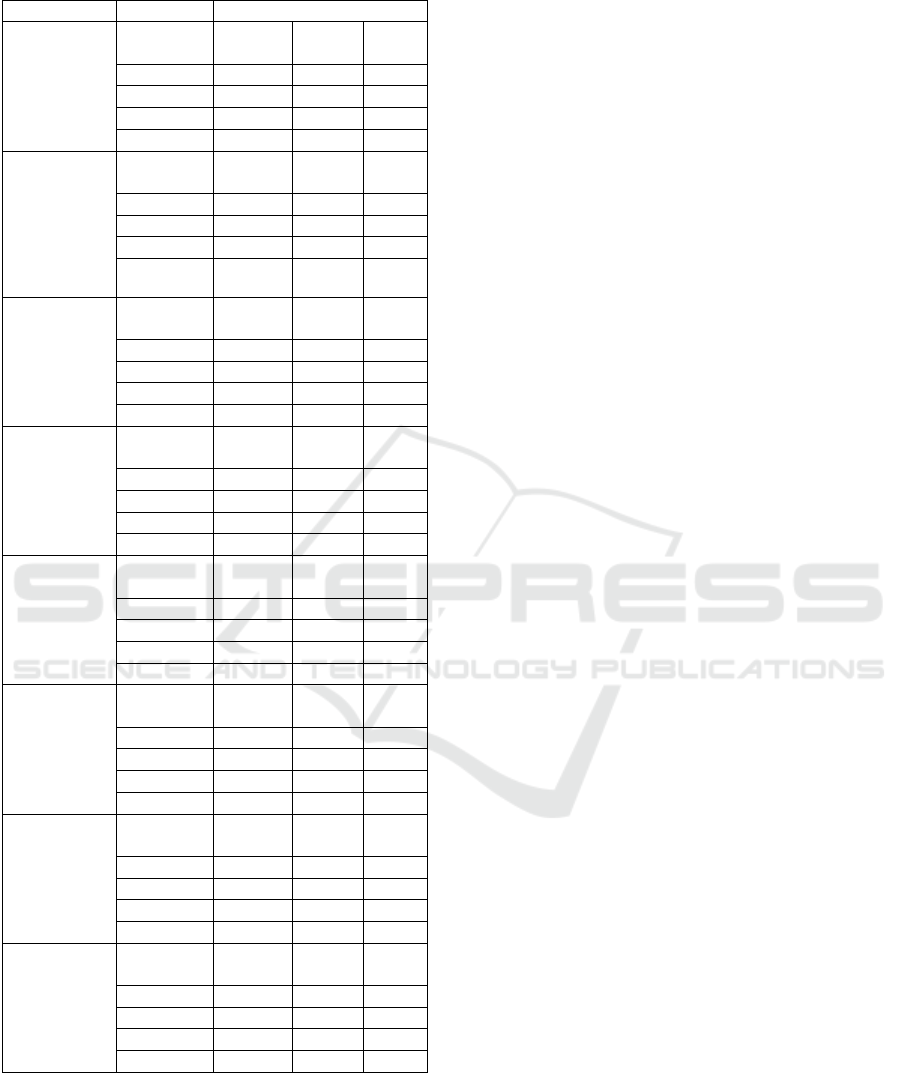
Table 2: Model results by CPV.
CPV
Metrics
Models
Food,
beverages,
tobacco and
related
products
Logistic
Reg.
Naive
Bayes
SVM
Accuracy
0.72
0.67
0.65
Precision
0.13
0.08
0.17
Recall
0.04
0.04
0.12
ROC
0.48
0.45
0.47
Medical
equipments,
pharmaceuti
cals and
personal
care
products
Logistic
Reg.
Naive
Bayes
SVM
Accuracy
0.73
0.71
0.66
Precision
0.29
0.28
0.20
Recall
0.14
0.17
0.18
ROC
0.52
0.52
0.49
Constructio
n work
Logistic
Reg.
Naive
Bayes
SVM
Accuracy
0.75
0.74
0.74
Precision
0.58
0.13
0.50
Recall
0.07
0.00
0.08
ROC
0.53
0.50
0.53
Repair and
maintenance
services
Logistic
Reg.
Naive
Bayes
SVM
Accuracy
0.72
0.72
0.70
Precision
0.72
0.72
0.72
Recall
0.99
1.00
0.95
ROC
0.50
0.50
0.49
Architectural
construction,
engineering
and
inspection
services
Logisti
c Reg.
Naive
Bayes
SVM
Accuracy
0.66
0.68
0.65
Precision
0.14
0.00
0.38
Recall
0.01
0.00
0.13
ROC
0.49
0.50
0.51
Health and
social work
services
Logistic
Reg.
Naive
Bayes
SVM
Accuracy
0.78
0.75
0.78
Precision
0.78
0.77
0.78
Recall
1.00
0.97
1.00
ROC
0.50
0.48
0.50
Sewage,
refuse,
cleaning and
environment
al services
Logistic
Reg.
Naive
Bayes
SVM
Accuracy
0.59
0.65
0.57
Precision
0.52
0.58
0.50
Recall
0.45
0.64
0.44
ROC
0.57
0.65
0.56
IT services:
consulting,
software
develop.,
Internet and
support
Logistic
Reg.
Naive
Bayes
SVM
Accuracy
0.85
0.85
0.85
Precision
0.85
0.85
0.85
Recall
1.00
1.00
1.00
ROC
0.50
0.50
0.50
The following groups have been included in the
test: food, beverages, tobacco and related products,
medical equipment, pharmaceuticals and personal
care products, construction work, repair and
maintenance services, architecture, construction,
engineering and inspection services, health and social
work services, sewage, refuse, cleaning and
environmental services and IT services (consulting,
software development, internet and support).
The results (Table 2.) show a clear improvement
in the metrics in certain data sets, and also in the
average. The average accuracy of all CPV groups is
at the same level as in the results of the first model
but note that all other metrics and recall have
improved, which has enhanced the detection of
positive observations in the data set. Also, groups
such as IT services, repair and maintenance services,
and health and social work services have great
prediction results. By looking at the bidding
documents for these categories in relation to the
others, we note that they have more elaborate chapters
about technical and professional capability and a
nearly 50:50 distribution of false and positive
observations. Conversely, groups such as
architecture, construction, engineering and inspection
services provide bad metrics, precisely because of the
lack of information on technical and professional
abilities.
6 CONCLUSION AND FURTHER
RESEARCH
The aim of this research was to test whether machine-
learning methods and text-mining techniques can
detect indications of corruption in the Public
Procurement process using the content of the tender
documentation as a data source. We tested selected
data mining techniques on one data set in two
different ways. First, we tested them on extracted and
optimized tender documentation (Section 4.) in the
context of all tenders. Then, in order to achieve better
results, we divided the entire data set by CPV codes.
Support vector machines and Logistic regression
proved to be better in making prediction related to
Health and social work services CPV code, while in
most all other cases naïve Bayes algorithm showed
better results. The results obtained are satisfactory,
and we can say that they vary depending on the group
of public words and the type of procurement.
Although accuracy as a measure mean little, this
metric ranged from 0.6 to 0.85. Although dependent
on the model, the recall metric was greater than 0.5,
which is a good result. This conclusion is confirmed
by the values of ROC. Specifically, it has been
established that certain types of procurement, such as
IT services and health care, have precisely detailed
descriptions for technical and professional
KMIS 2019 - 11th International Conference on Knowledge Management and Information Systems
338

capabilities, whereas others, e.g., architecture,
construction, engineering and inspection services
have poor metrics. We believe that further research
should investigate the content of poor metric groups
and suggest possible solutions or find relevant content
within the tender documentation. We also noticed a
basic lack of data that could be used as dependent
target variables in this research area, which is why the
predictive power of the model is rather low. We
consider it entirely appropriate to consider open
public procurement procedures with one bid as cases
with great indication of corruption. A system based
on such models would be an excellent tool for experts
in the area of public procurement monitoring. For
example, due to the prevention of suspicious
activities at the very beginning of the tender
procedure, we can talk about an early warning
system. Further work should focus on including
additional indicators to enhance model accuracy as
well as applying neural networks, deep learning and
other machine-learning algorithms to achieve better
results.
REFERENCES
Ahmed, HA., Esraa, H., Abdul, A., 2017. Comparative
Study of Five Text Classification Algorithms with their
Improvements, International Journal of Applied
Engineering Research.
Azmi, KS., Rahman, AA., 2015. E-Procurement: A Tool to
Mitigate Public Procurement Fraud in Malaysia,
Electronic Journal of e-Government.
Bird, S., Klein, E., Loper, E., 2009. Natural language
processing with Python: analyzing text with the natural
language toolkit. O'Reilly Media, Inc.
Budak, J., 2016. Korupcija u javnoj nabavi: trebamo li novi
model istraživanja za Hrvatsku?. Ekonomski pregled.
Carvalho, RN., Sales, LJ., Da, Rocha, HA., Mendes, GL.,
2014. Using bayesian networks to identify and prevent
split purchases in Brazil, InProceedings of the Eleventh
UAI Conference on Bayesian Modeling Applications
Workshop.
Chapman, P., Clinton, J., Kerber, R., Khabaza, T., Reinartz,
T., Shearer, C., Wirth, R., 2016. CRISP-DM 1.0 Step-
by-step data mining guide, SPSS, CRISPMWP-1104.
Charron, N., Dahlström, C., Fazekas, M., Lapuente, V.,
2016. Careers, Connections, and Corruption Risks:
Investigating the Impact of Bureaucratic Meritocracy
on Public Procurement Processes. The Journal of
Politics.
Congcong, L., Jie, W., Lei, W., Luanyun, H., Peng, G.,
2014. Comparison of Classification Algorithms and
Training Sample Sizes in Urban Land Classification
with Landsat Thematic Mapper Imagery. Remote Sens.
Corruption Perceptions Index, Available at:
https://www.transparency.org/news/feature/corruption
_perceptions_index_2017, (Accessed: 20 October
2018)
Deepika, S., 2012. Stemming Algorithms: A Comparative
Study and their Analysis. International Journal of
Applied Information Systems.
Dhurandhar, A., Ravi, R., Graves, B., Maniachari, G., Ettl,
M., 2015. Robust system for identifying procurement
fraud. In Proceedings of the twenty seventh conference
on innovative applications in artificial intelligence
(IAAI-15), 3896–3903.
Diaz, G., 2016. Stopwords Croatia, Available at:
https://github.com/stopwords-iso/stopwords-hr,
(Accessed: 15 October 2018).
Directorate for the public procurement system, 2017.
Statistical report for 2017 year, Available at:
http://www.javnanabava.hr/userdocsimages/Statisticko
_izvjesce_JN-2017.pdf, (Accessed: 15 October 2018).
Domingos, SL., Carvalho, RN., Carvalho, RS., Ramos,
GN., 2016. Identifying IT purchases anomalies in the
Brazilian government procurement system using deep
learning. Machine Learning and Applications
(ICMLA).
Efstathios, K., Charalambos, S., Yannis, M., 2007. Data
mining techniques for the detection of fraudulent
financial statements. Expert Systems with Applications.
Eman, Y., 2015. Sentiment Analysis and Text Mining for
Social Media Microblogs using Open Source Tools: An
Empirical Study. International Journal of Computer
Applications.
European Commission, 2017. European semester thematic
factsheet public procurement, Available at:
https://ec.europa.eu/info/sites/info/files/file_import/eur
opean-semester_thematic-factsheet_public-
procurement_en_0.pdf, (Accessed: 08 October 2018).
Fazekas, M., Kocsis, G., 2017. Uncovering high-level
corruption: Cross-national objective corruption risk
indicators using public procurement data. British
Journal of Political Science.
Fazekas, M., Tóth, IJ., King, LP., 2016. An Objective
Corruption Risk Index Using Public Procurement Data.
European Journal on Criminal Policy and Research.
Ferwerda, J., Deleanu, I., Unger, B., 2016. Corruption in
Public Procurement: Finding the Right Indicators.
European Journal on Criminal Policy and Research.
Fissette, M., 2017 Text mining to detect indications of fraud
in annual reports worldwide. Dissertation, University of
Twente.
Gupta, V., Lehal, GS., 2009. A Survey of Text Mining
Techniques and Applications. Journal of Emerging
Technologies in Web Intelligence.
Gupta, R., Gill, NS., 2012. Financial Statement Fraud
Detection using Text Mining. International Journal of
Advanced Computer Science and Applications.
Harrington, P., 2012. Machine learning in action. NY:
Manning Publications Co., Shelter Island.
Kotsiantis, S., Koumanako, E., Tzelepis, D., Tampakas, V.,
2007. Forecasting Fraudulent Financial Statements
using Data Mining. International Journal of
Computational Intelligence.
Prediction of Public Procurement Corruption Indices using Machine Learning Methods
339

Kumar, N., Mitra, S., Bhattacharjee, M., & Mandal, L.
2019. Comparison of different classification techniques
using different datasets. In Proceedings of International
Ethical Hacking Conference 2018
Ljubešić, N., Klubička, F., Agić, Ž., Jazbec, IP., 2016. New
inflectional lexicons and training corpora for improved
morphosyntactic annotation of Croatian and Serbian.
The 10th International Conference on Language
Resources and Evaluation.
Mencıa, EL., Holthausen, S., Schulz, A., Janssen, F., 2013.
Using data mining on linked open data for analyzing e-
procurement information. In Proceedings of the first
DMoLD: Data Mining on Linked Data Workshop at
ECML/PKDD.
OLAF, 2017. The OLAF report 2017, Available at:
https://ec.europa.eu/anti-
fraud/sites/antifraud/files/olaf_report_2017_en.pdf,
(Accessed: 10 November 2018).
Pal, D., Pal, S., 2018. Fraud Detection in Health Insurance
Domain: A Big Data Application with Data Mining
Approach. Journal of Innovation and Research.
Ministry of economy entrepreneurship and crafts (MEEC),
Pravilnik o dokumentaciji o nabavi te ponudi u
postupcima javne nabave, Available at: https://narodne-
novine.nn.hr/clanci/sluzbeni/2017_07_65_1534.html,
(Accessed: 28 October 2018).
Ramos, J., 2003. Using TF-IDF to Determine Word
Relevance in Document Queries. In First International
Conference on Machine Learning.
Ramzan, T., Muhammad, KH., Shaeela, A., Fakeeha, F.,
2016. Text Mining: Techniques, Applications and
Issues. International Journal of Advanced Computer
Science and Applications.
Ron, KA., 1995. Study of cross-validation and bootstrap for
accuracy estimation and model selection. JCAI'95
Proceedings of the 14th international joint conference
on Artificial intelligence.
Sales, LJ., Carvalho, RN., 2016. Measuring the Risk of
Public Contracts Using Bayesian Classifiers.
Uncertainty in Artificial Intelligence BMA@ UAI.
Sokolova, M., Japkowicz, N., Szpakowicz, S., 2006.
Beyond accuracy, F-score and ROC: a family of
discriminant measures for performance evaluation. In
Australasian joint conference on artificial intelligence.
Sun, T., Sales, LJ., 2018. Predicting Public Procurement
Irregularity: An Application of Neural Networks.
Journal of Emerging Technologies in Accounting.
Transparency International, 2018. Corruption Perceptions
Index. Available at: https://www.transparency.org/
news/feature/corruption_perceptions_index_2017.
(Accessed: 20 October 2018)
Turney, P. D., Pantel, P. 2010. From frequency to meaning:
Vector space models of semantics. Journal of artificial
intelligence research.
Wensink, W., Vet, JM., 2013. Identifying and reducing
corruption in public procurement in the EU.
PricewaterhouseCoopers.
KMIS 2019 - 11th International Conference on Knowledge Management and Information Systems
340
