
Multi-aspect Evaluation Method for Digital Pointing Devices
Nils B
¨
uscher, Daniel Gis, Sebastian Stieber and Christian Haubelt
Institute of Applied Microelectronics and Computer Engineering, University of Rostock, Rostock, Germany
Keywords:
Evaluation, Pointing Device, User Experience, Inertial Sensors.
Abstract:
For decades the computer mouse has been used as the most common input device for laptops and computers
alike. However for speeches a presentation remote with a laser pointer was used because they allowed the pre-
senter more freedom. With the emergence of small and lightweight inertial sensors, a new type of presentation
remotes becomes popular. These remotes use inertial sensors to move a digital pointer allowing presenters to
show things on more than one screen or use enhancement methods like highlighting a region. Using inertial
sensors however proves to be a difficult task and can lead to problems with the usability of such devices.
When developing such systems, the designer faces the problem that no method for quantifying the usability of
pointing devices based on inertial sensors is available. In the paper at hand, we propose an evaluation method
consisting of three different tests to assess the manageability, speed and precision of digital pointing devices
for a measurable comparison. Additionally, we conducted an evaluation to show that our tests reflect the sub-
jective assessment from the users. Our quantitative test results showed a strong correlation to the qualitative
subjective assessment from the users.
1 INTRODUCTION
The usage of Digital Pointing Devices (DPD) for pre-
sentations has many advantages compared to tradi-
tional devices like e.g. laser pointer. Especially when
a presentation is shown on multiple screens simulta-
neously, the usage of a digital pointer has a huge ben-
efit because the presenter can point on all screens at
the same time and does not have to turn around to
look at the screen to point at it. In addition it allows
the presenter to utilize a number of digital enhance-
ment methods during the presentation like highlight-
ing a certain region of the presentation slides or do-
ing annotations during the presentation. The usage of
a DPD however is limited by the accuracy in sens-
ing its movement. Additionally, the sensitivity and
movement profile of the device have an influence on
its usability. Ideally the usage of a digital pointing
device should be as intuitive as using a laser pointer.
The usability of such a DPD is the main objective in
its design and needs a lot of attention and fine tuning
during its development to be suitable for a wide user
base.
In (MacKenzie and Jusoh, 2001) it is shown that
these devices are often far away from the usability of
a standard computer mouse and improvements need
a lot of attention to bring them to the same level of
usability. It is, however, not easy to determine the us-
ability of such a device as there are multiple aspects
that have to be considered at the same time. First of
all the subjective assessment of the user about the per-
formance is of great importance. Second, the DPD
should allow the user to be able to precisely point
at a target on the screen and also be able to quickly
move between multiple targets to allow for a fluent
presentation. However, no comprehensible and accu-
rate evaluation method to assess the performance and
usability of DPDs is available today.
This paper, proposes the multi-aspect evaluation
method to asses and compare different DPD imple-
mentations. Our evaluation method consists of three
separate tests that evaluate different aspects of the
device: The first test evaluates the responsiveness,
which we see as the ability to move the pointer di-
rectly between two objects on the screen. The second
test evaluates how fast a user can move the pointer be-
tween objects on the screen. The third test evaluates
how precise the pointer can be moved along lines or
shapes. To evaluate our testing approaches, we con-
ducted tests for four pointing devices with multiple
participants and compared the measured results from
the tests against each other and against the subjective
assessment from the testers.
The remainder of paper is structured as follows:
In Section 2, this paper discusses other publications
dealing with the assessment of the usability of digital
128
Büscher, N., Gis, D., Stieber, S. and Haubelt, C.
Multi-aspect Evaluation Method for Digital Pointing Devices.
DOI: 10.5220/0008355701280135
In Proceedings of the 9th International Conference on Pervasive and Embedded Computing and Communication Systems (PECCS 2019), pages 128-135
ISBN: 978-989-758-385-8
Copyright
c
2019 by SCITEPRESS – Science and Technology Publications, Lda. All rights reserved

pointing devices in general. Afterwards in Section 3,
we explain which criteria were used for the evalua-
tion methods and describe the three tests which were
developed to cover said criteria. In the following Sec-
tion 4, an evaluation of the proposed methods is done
using 160 measurements from multiple participants.
Finally, Section 5 concludes this paper and gives a
short outlook for future development.
2 RELATED WORK
In the past there have been many studies about the
usability of digital Human Interface Devices (HIDs).
The performance evaluation shown in (Batra et al.,
1998) examines the usability of different built-in in-
put devices for laptops, namely trackballs, stick points
and touch pads. Said research tested three common
tasks performed on a computer normally performed
with a computer mouse and used the needed time,
click errors and click accuracy. An assessment of the
ergonomics of the used input devices was also con-
ducted. The results however were meant to compare
the usability of the devices and allow to compare sub-
jective user experience with the measured results.
The International Organization for Standardiza-
tion (ISO) released a norm to assess the usability of
digital input device (ISO, 2007). However, as re-
vealed in (Douglas et al., 1999) this standard does not
allow a direct correlation between the measured per-
formance and the user experience. To see how well
such a pointing device will be accepted by potential
users our approach seeks to create a direct correlation
between measured performance and user experience.
Another work that seeks to examine the perfor-
mance of input devices is (MacKenzie et al., 2001),
which also derives multiple measurable aspects of the
devices to evaluate their performance. The focus of
this work however is on devices used for common of-
fice tasks on a computer and measures how fast and
efficient certain tasks can be done. It does not con-
sider the assessment of the users on how usable and
comfortable the devices are.
3 TEST METHODS
For the evaluation of digital pointing devices, the first
important step was to identify which properties can
be used for an objective assessment and comparison.
Three major properties were found:
Manageability. The manageability describes how
well a device can be handled by the user to ex-
ecute simple and common actions. For example
how easy it is for a user to move from one place
on the screen to another.
Responsiveness & Speed. The responsiveness and
speed is a factor for how fast a user is able to
conduct simple and common actions. In particular
the responsiveness describes how fast or sluggish
the device reacts to the user input and the speed
describes how fast the user is able to move the
pointer.
Precision & Stability. The precision and stability
properties describe how well a user can conduct
more complex actions. This can be for example
highlighting a certain small object on the screen,
write a note or move along a complex shape.
For the evaluation of the digital pointing devices,
three tests were designed, where each evaluates one
of the three properties mentioned above. The first test,
called the ’Pointing Test’ evaluates the manageability.
In particular, it assesses how well a user can move the
pointer from one place of the screen to another place.
The second test evaluates the speed and responsive-
ness. It is measured how fast a user can move the
pointer between different places on the screen. The
last test evaluates the precision and stability of the
pointing device. It measures how well a user can trace
the shape of different objects with the help of the dig-
ital pointing device.
3.1 Pointing Test
The Pointing Test was designed to evaluate manage-
ability of the pointing device. It tests how well the
user is able to move directly between points on the
screen. At the beginning, the user has to move the
pointer to the first point on the screen. When the first
point is reached, a second point appears after a short
time to which the user has to move in a direct path.
After reaching that point, the next point becomes vis-
ible and the user has to move to the new point. The
user has to stay with the pointer in the current point
for at least two seconds before the new point appears
to evaluate that it is possible to reach a target point
and also stay there. This procedure is repeated multi-
ple times.
In the GUI the current point is drawn in blue while
the point to move to is drawn in red. The test finishes
after the user has traversed a number of points that
was defined prior to the start of the test.
The score for the evaluation in the Pointing Test is
calculated via the relation between optimal (minimal)
distance between the points and the actually moved
distance in pixels. A shorter distance traveled with
the pointer results in a higher score. Equation 1 shows
how the score for the traveled distance is calculated.
Multi-aspect Evaluation Method for Digital Pointing Devices
129
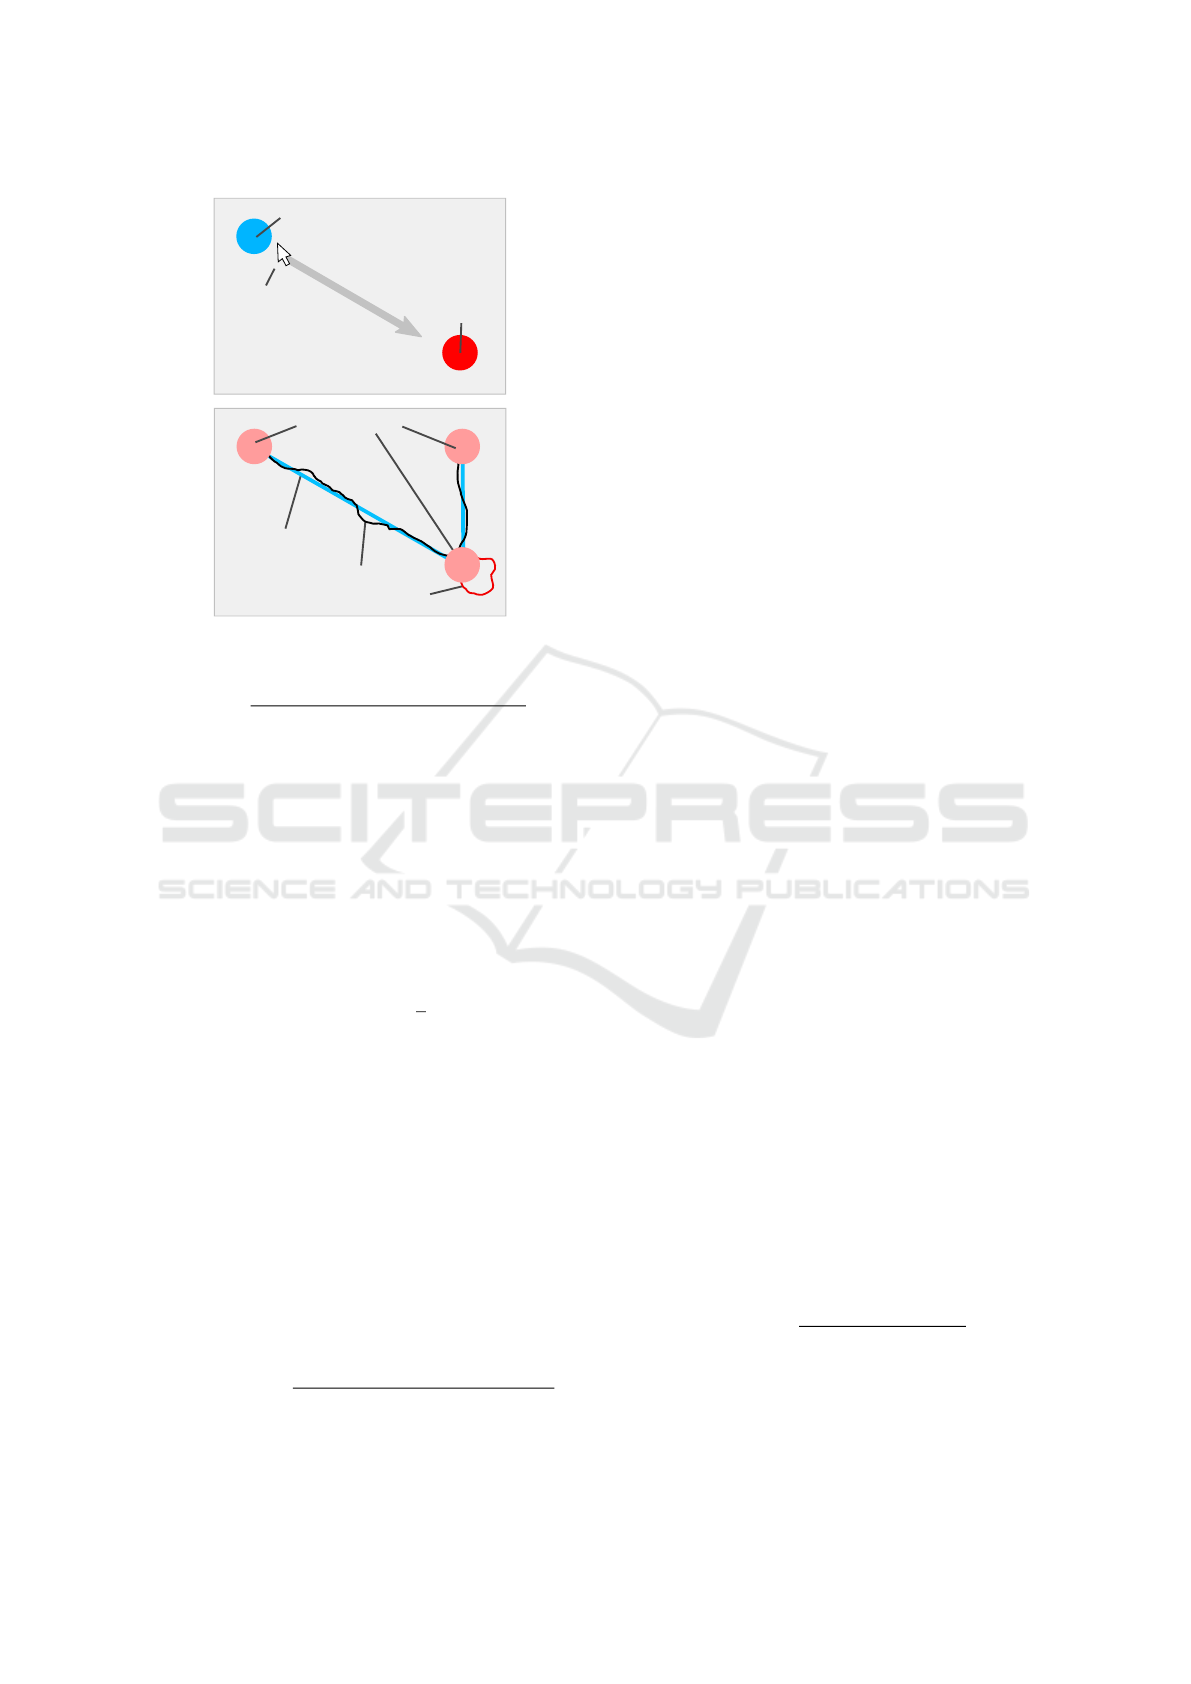
Current Point
Next Point
Pointer
Traversed Point
Ideal Path
Taken Path
Overshoot
Figure 1: Top: Interface of Pointing Test and Speed Test.
Bottom: Results from Pointing Test and Speed Test.
score
dist
=
α
dist
·dist
min
+(1−α
dist
)·(dist
min
−dist
traveled
)
α
dist
∗dist
min
(1)
The score score
dist
for the distance is calculated as
the ratio between the minimal distance dist
min
and the
traveled distance dist
traveled
. The difference between
minimal distance and traveled distance is weighted by
α
dist
to allow for a suitable scaling of the score. With-
out the weighting the score would reach zero when
the traveled distance is at least twice as long as the
minimal distance. This scenario however is very un-
likely and initial tests with multiple devices showed a
way shorter traveled distance even for the worst de-
vices. Based on the initial measurements with the test
we chose an α
dist
of 0.25, so the score will reach zero
when the traveled distance is 33.
3% higher than the
minimal distance. Said factor was chosen empirically
to allow for a better scaling of the score for the trav-
eled distance.
In addition to the traveled distance, also an over-
shoot distance is used for the score to respect the fact
that the user might move past the target point while
trying to reach it. An overshoot can be seen at the bot-
tom of Figure 1. The red line is the traveled path from
the pointer after the user reached the target point but
did not start to move to the next point. This so-called
overshoot might happen if the device reacts too slow
to the user input or is not well manageable. The score
for the overshoot is calculated in Equation 2.
score
overshoot
=
dist
min
− (α
overshoot
· dist
overshoot
)
dist
min
(2)
A higher overshoot will result in a lower score as it
shows that the device does not allow the user to stay
in the reached location. The overshoot is calculated
by the ratio between the minimal distance that can
be traveled dist
min
and the traveled distance from the
overshoot dist
overshoot
weighted by α
overshoot
. Based
on initial tests, the factor α
overshoot
is also set to 0.25
to allow for a better scaling of the range from the score
because it is very unlikely that the overshoot distance
ever reaches the actual distance the user has to travel.
We use the minimal distance for all scores as a
factor to allow for a consistent evaluation across mul-
tiple screens with different resolutions. Using a fixed
value for the evaluation would result in different re-
sults depending on the screen size and resolution as
shown in (Oehl et al., 2007). Additionally the tests
were conducted on a huge screen to reflect the com-
mon use case. The overall score score
pointing
for the
Pointing Test is calculated by Equation 3.
score
pointing
= score
dist
· score
overshoot
(3)
The values for score
dist
and score
overshoot
are clamped
to not be below 0 before the calculation. A score
higher than 1 should not be possible.
3.2 Speed Test
The composition of the Speed Test is similar to the
composition of the Pointing Test. Again the user has
to move to the first point and to all subsequent points
like in the Pointing Test. However, the Speed Test
evaluates how fast a user can move between multiple
points using the digital pointing device. Therefore the
test participants do not have to move in a direct line
between the points but try to reach as many points
possible in a given time frame.
The test only considers the time the user spends
moving between the points on the screen and does not
count the time the user stays at a point. This should
prevent that the reaction time from the user influences
the test result when the points are placed at random
locations on the screen.
The score for the Speed Test is calculated by the
relation between available time and reached points.
The Equation for the score calculation can be seen in
Equation 4.
score
speed
=
num
points
· β · f
distance
time
(4)
The time is the overall time for the test in millisec-
onds. The factor β is used to weight the number
of points against the time, so that it can be set how
many points have to be reached per second to get the
PECCS 2019 - 9th International Conference on Pervasive and Embedded Computing and Communication Systems
130
highest score. Based on initial test we chose a fac-
tor of β = 500 for two points per second. The factor
f
distance
plays an important role for the repeatability
and accuracy of the speed test. The speed test is de-
signed that the points are placed at random locations
on the screen to prevent a habituation effect of the
tester. However, the random placement of the points
causes the overall distance the tester has to travel to
vary between each test. For example, in the first test
all points are placed relatively close to each other and
the tester manages to reach eight points. In the second
test, the points are very far away from each other and
the tester only reached four points and gets a worse
score although the traveled distance might be actually
bigger than in the first test. The f
distance
is a weighting
factor used to incorporate the distance that is traveled
and is calculated by Equation 5.
f
distance
=
s
dist
traveled
num
points
· dist
average
(5)
The dist
average
is the average distance between all pos-
sible points on the screen and can be calculated at the
beginning of the test. Using this factor the score is in-
creased when the average distance traveled dist
traveled
between the points is longer than the expected average
distance and decreased when the traveled distance is
shorter. We chose to use the square root of the ratio
from traveled and expected distance to consider the
fact that a higher distance between points also allows
the user to move the pointer faster. The number of
reached points is num
points
.
3.3 Precision Test
The purpose of the Precision Test is to evaluate the
precision and stability of the digital pointing device.
A precise movement is important to be able to point
at small objects or interact with the content on the
screen, like drawing a shape or highlighting an object.
For the Precision Test the tester has to move the
pointer along the edge of multiple shapes to trace
them. The difference between the drawn shape from
the pointer and the real shape is used to calculate the
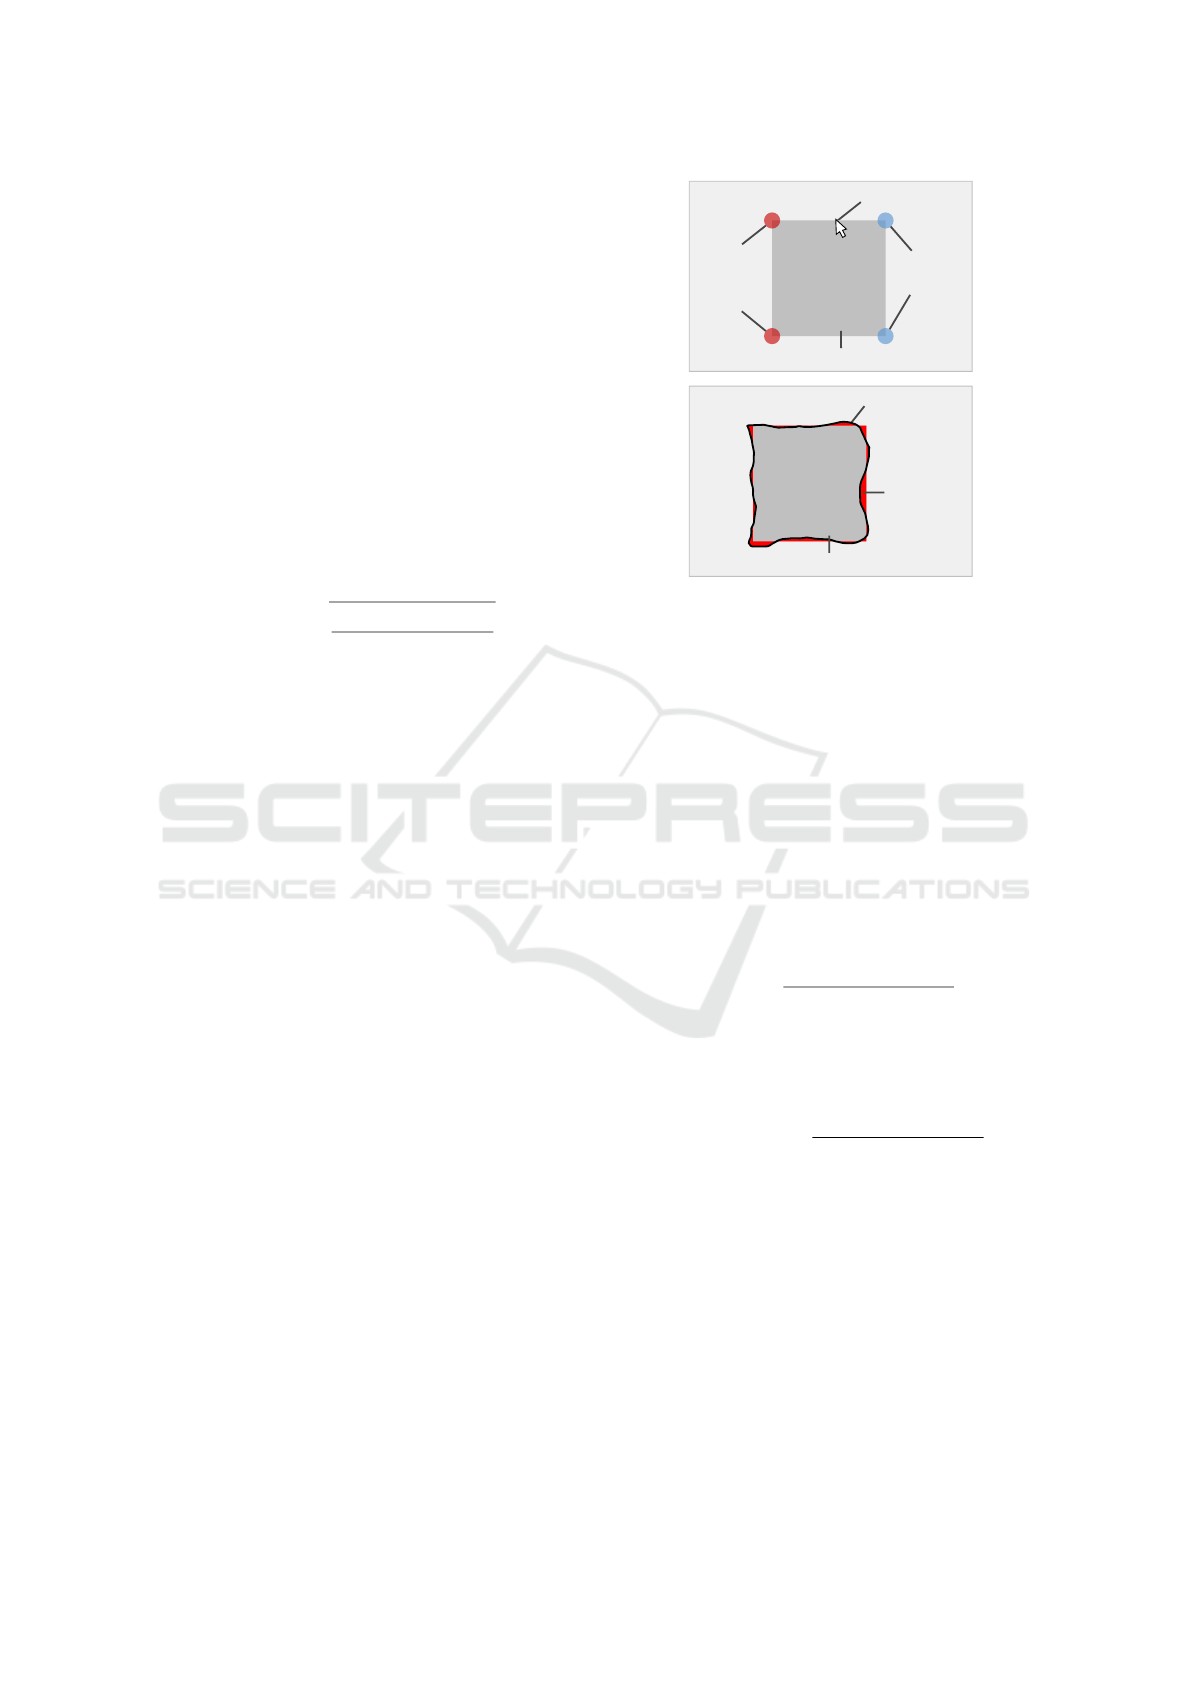
score for the pointing device. The interface of the Pre-
cision Test can be seen in Figure 2.
For the Precision Test three shapes have to be
traced with the pointer: The red and blue points are
used as information for the user to show the progress
and to ensure that the user really traces the shape.
Square. With the square it can be tested how well the
pointing device allows a user to move precisely in
vertical and horizontal directions.
Pointer
Reached
Point
Points
still to
reach
Taken path
Shape to move along
Shape to move along
Movement
errror
Figure 2: Interface of the Precision Test during the test.
Bottom: Interface with the results. The red area is the move-
ment error.
Triangle. The triangle is used to evaluate how well
the pointing device allows a user to move diago-
nally between elements on the screen or draw di-
agonal lines.
Circle. With the circle the test can evaluate how
well a user can move along curved edges or draw
curved shapes.
With the three shapes different aspects and character-
istics of the digital pointing device can be evaluated.
The first part for the score of the Precision Test is cal-
culated with the Equations 6 and 7.
dist
avg
=
∑
N
n=0
distanceShape
n
N
(6)
Here distanceShape
n
is the shortest distance between
the n
th
pointer position and the edge of the shape. N is
the number of sample points captured during the test.
score
shape
= 1 −
γ · dist
avg
shapeCircum f erence
(7)
The average distance between the shape and the tra-
versed path it multiplied by the factor of γ to allow for
a better scaling of the score score
shape
and was deter-
mined empirically to be 25. The circumference of the
shapes is shapeCircum f erence.
In addition to the precision determined by the dis-
tance between the shape and the traversed path, it is
also important to evaluate the stability of the pointer.
Therefore a second score was added to the Precision
Test which uses the sum of all angles of the traversed
path to compare it with the optimal angle. For all
shapes the optimal angle for a movement would be
Multi-aspect Evaluation Method for Digital Pointing Devices
131
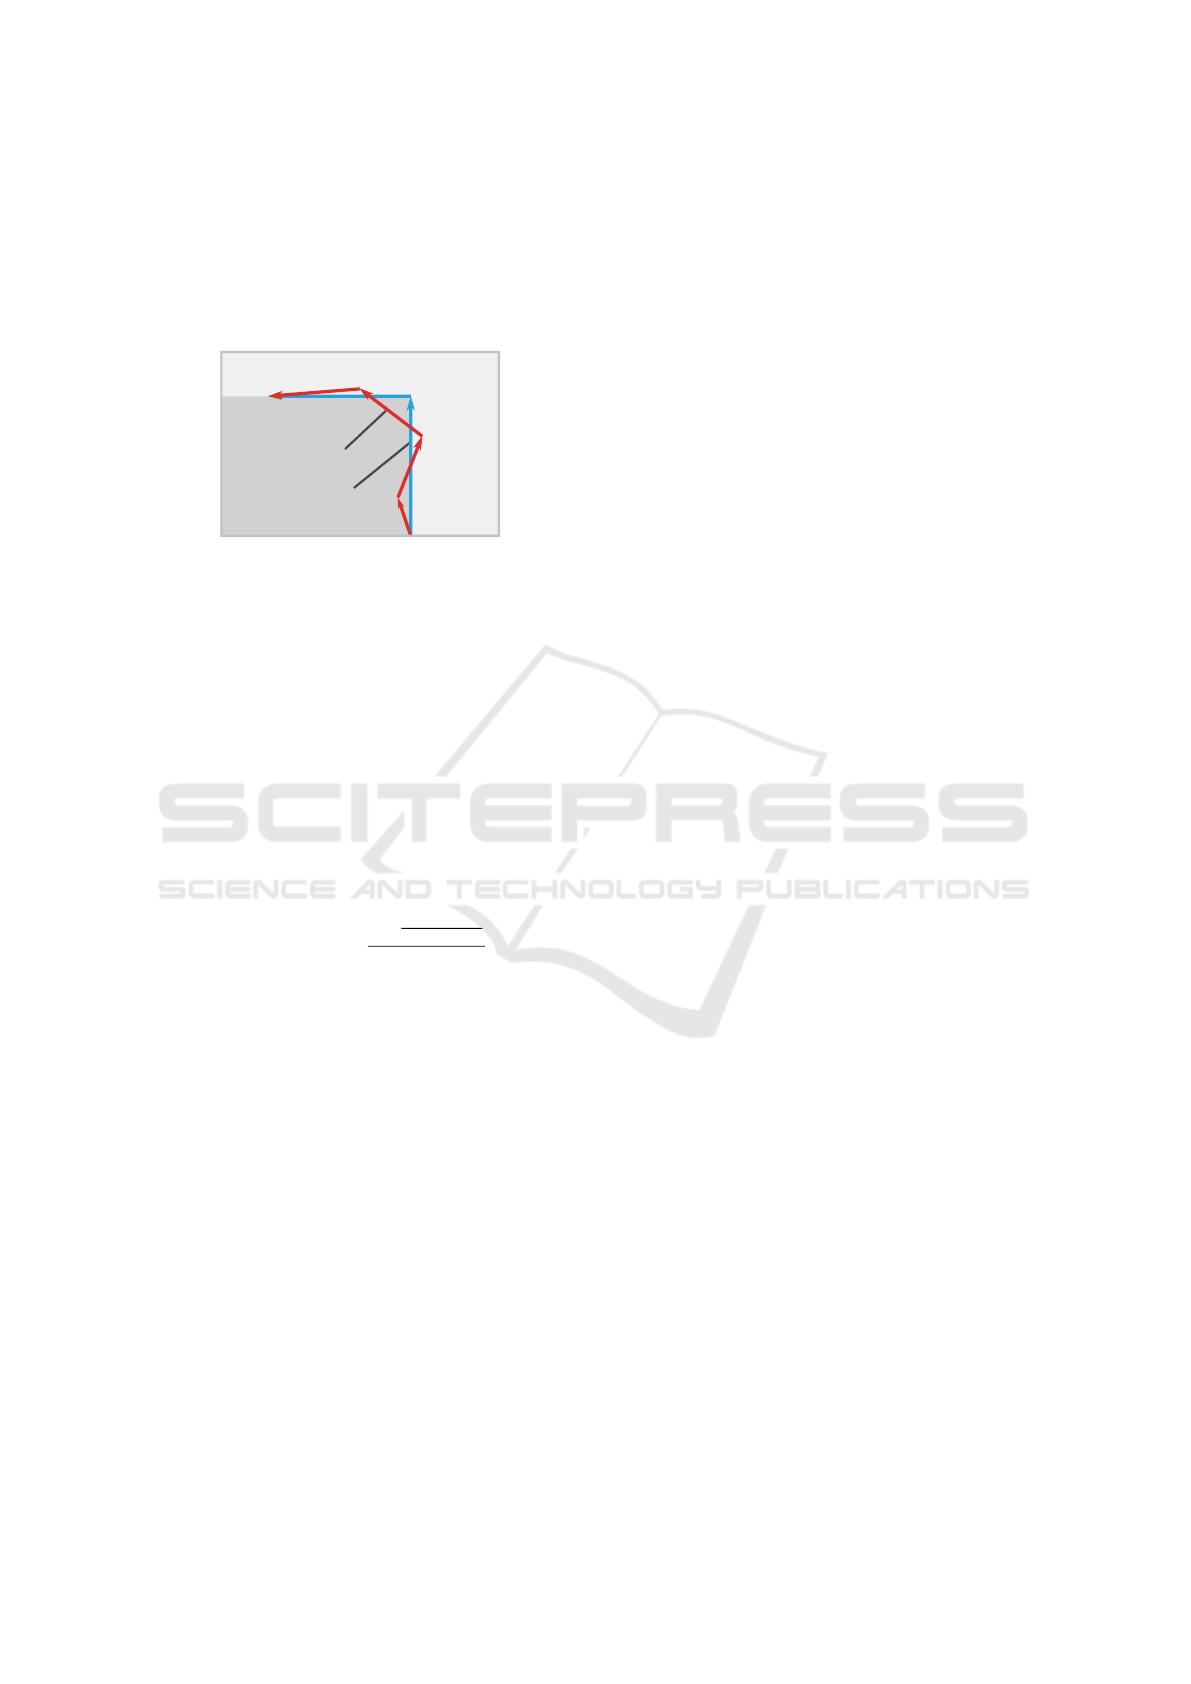
360°. However an unstable pointer will have a much
higher angle at the end because it moves up and down
or left and right while being moved along the shape.
This effect is illustrated in Figure 3 which shows two
paths for a stable and for an unstable pointer including
the angle change between each movement.
Taken path
Optimal path
Δ41°
Δ74°
Δ90°
Δ31°
Figure 3: Traversed path of a stable pointer (blue) and ex-
emplary path of an unstable pointer (red).
When summing up the delta angles from the blue
path, the overall angle change of the path is 90°. For
the red path the angle changes sum up to 146°. Thus
a higher angle change indicates an unstable pointer.
To not add huge errors for very small movements,
where the pointer jumps between pixels adding an-
gles of up to 180°, the movement angles are only cal-
culated when the pointer moved a defined number of
pixels away from the last location where the angle was
calculated.
Using the angles, the second part of the score is
calculated by Equation 8.
score
angle
= 1 −
1 −
angle
min
angle
traversed
2
(8)
Here angle
min
is 360 divided by the number of cal-
culated angles and angle
traversed
is the average of all
angle deltas from the measurement. The overall score
for the precision test is then calculated by Equation 9.
score
precision
= score
shape
· score
angle
(9)
The total score score
precision
of this test is the product
of the score for the shape and the score for the angles.
4 EVALUATION
For the evaluation of the proposed test methods we
conducted tests with participants of different ages and
sex on four devices. A huge diversity of the partici-
pants was important because it was shown in (Char-
ness et al., 2004) that these factors have an not negli-
gible influence on the results.
The devices used for the evaluation were:
• A computer mouse
• A commercially available pointing device
• A smartphone
• A prototype of a digital pointing device
The prototype consisted of a 1.5 x 3.0 cm sensor board
rigidly attached to a ballpoint pen. The mouse was
used with a mouse-pad on a flat table, the other point-
ing devices were used like a laser-pointer pointing at
a 55” LCD monitor 3 meters away.
The computer mouse is used as a reference device
because it is the most commonly used input device for
computers (Atkinson, 2006) (Greenemeier, 2009).
To counteract a habituation effect when using the
pointing devices, the sequence at which the test par-
ticipants tested the devices was randomized. Over-
all, 160 measurements were made for all tests com-
bined. After test conduction, the participants were
asked for their subjective assessment of the pointing
devices where they had to sort the devices from best
to worst regarding their usability and handling.
4.1 Expected Results
To proof the reliability of the results from the pro-
posed evaluation methods we expected that the results
from the tests and the subjective assessment of the
users show similar tendencies. Similar results would
support the assumption that the ability to use the digi-
tal pointing device in a fast and precise manner would
lead to a positive subjective assessment from the par-
ticipants.
It was also expected that the results from the
mouse would have the best results and therefore be
the reference against which the other devices are
compared, which was already shown by (MacKenzie
et al., 2001). The mouse proofed to be one of the most
precise pointing devices used in the last decades and
nearly everyone uses a mouse on a regular basis when
controlling a computer.
4.2 Pointing Test
The results from the Pointing Test are shown in Figure
4. The Pointing Test showed that the results from the
mouse had the best overall score, directly followed by
our prototype. The commercial product is placed on
the third place. Moving the pointer with a smartphone
showed the worst results.
The results indicate that the prototype has nearly
the same performance as the mouse. The inferior be-
haviour of the smartphone was caused by a notice-
able latency and some special characteristics that are
pointed out in more detail in Section 4.4. The results
still show that the minimal score reached from the
PECCS 2019 - 9th International Conference on Pervasive and Embedded Computing and Communication Systems
132
Prototype
Commercial Smartphone
Mouse
0.5
0.6
0.7
0.8
0.9
1
Pointing Score
Figure 4: Score for the pointing test from the four tested
devices.
smartphone was slightly below 0.7. Hence, all tested
devices were still usable.
4.3 Speed Test
The results of the Speed Test show a similar order
for the score from the tested devices. However it is
clearly visible in Figure 5 that the results from the
mouse are a lot better than the results from the other
devices. A superiority of the mouse was expected for
this test. First of all, all testers were already famil-
iar with the usage of a computer mouse, secondly the
movement needed to move the pointer with the mouse
was different from the other tested devices which di-
rectly pointed at the screen to move the pointer. Last
but not least, the mouse was the only device directly
connected to the computer. The commercial pointer
and the smartphone communicated wirelessly with
the computer. The prototype was connected via an
additional shuttle board. Therefore the latter three
devices have a higher latency between device move-
ment and pointer movement, which has an effect on
the overall performance of said devices.
Prototype
Commercial Smartphone
Mouse
0.5
0.6
0.7
0.8
0.9
1
Speed Score
Figure 5: Score for the speed test from the four tested de-
vices.
Similar to the Pointing Test, the prototype showed
the second best results followed by the commercial
product. The smartphone again had the worst results.
However, the difference between the three devices is
lower than in the Pointing Test. This is caused by
the way the score is calculated to also incorporate the
score from the mouse in a reasonable manner. Ad-
ditionally the nature of the test using the number of
reached points for the score causes a lower variance
as it was possible to reach nearly the same number of
points with all three pointing devices. It is possible
that a longer duration of the test would yield better
distinguishable results.
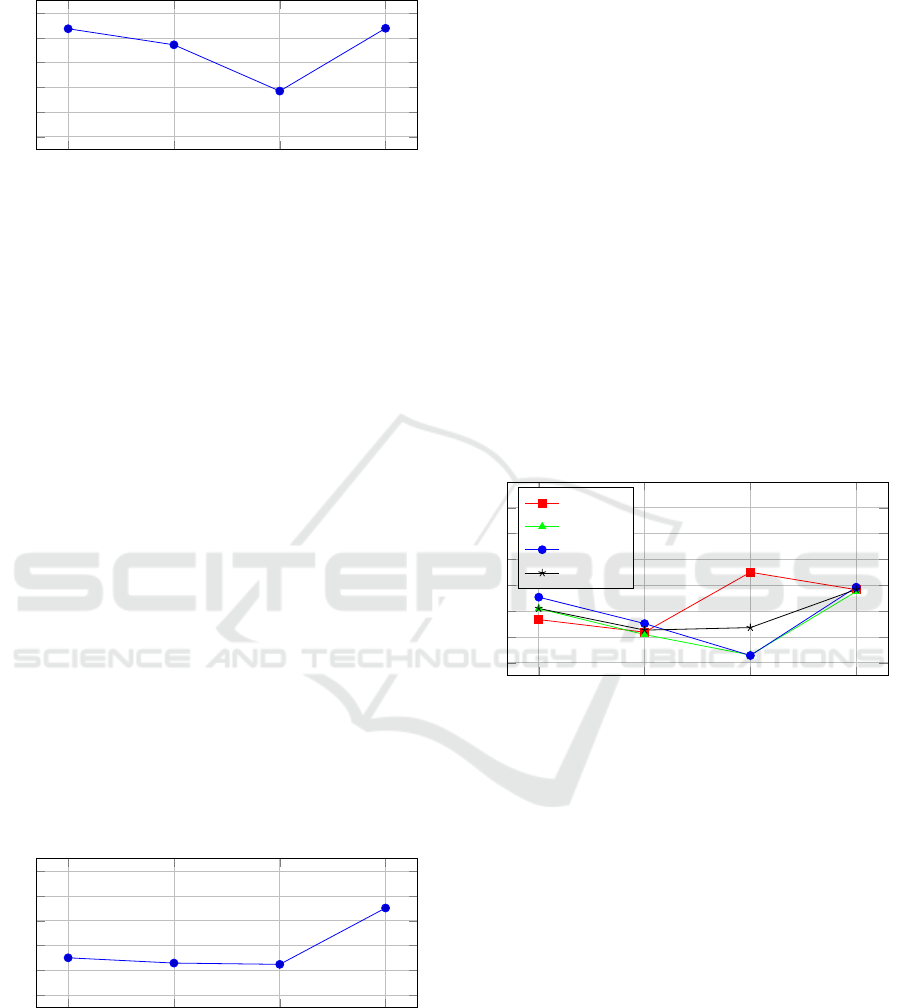
4.4 Precision Test
The score for the Precision Test consists of three sub-
scores for the movements around the square, the trian-
gle and the circle. The overall score of the Precision
Test shows a different distribution for the usability of
the devices, than the Pointing Test and the Speed Test,
due to an anomaly in the test with the square shape.
The sub-scores and the combined score can be seen in
Figure 6.
Prototype
Commercial Smartphone
Mouse
0.5
0.6
0.7
0.8
0.9
1
1.1
Precision Score
Square
Triangle
Circle
Overall
Figure 6: Score for the precision test from the four tested
devices.
4.4.1 Square Shape
The scores from the evaluation with the square shape
show different results than all other conducted tests.
It can be seen in Figure 6 that the Smartphone has
the best score in this part of the test despite being the
worst for the two other shapes and the other tests. The
second best score is from the Mouse, followed by the
Prototype. The worst result was measured with the
commercial product. While the score for the smart-
phone was the worst in all other tests it shows the best
results for the Precision Test with the square shape.
This anomaly is caused by the combination of three
factors:
1. All edges of the square shape are either vertical or
horizontal.
2. To reduce the influence of noise from the sensor-
data, the application on the smartphone uses a
Multi-aspect Evaluation Method for Digital Pointing Devices
133
high threshold. All accelerations and angle-rates
below that threshold are ignored.
3. The threshold is applied independently for each
single axis on the smartphone.
When the user now moves the pointer along the
shape of the square, the movement on one axis is
low enough to be below the threshold and is filtered
out causing the pointer to get ’locked’ on one of the
axis. Therefore the pointer can be moved in a perfect
straight line which makes it a lot easier for the user to
draw the square shape.
4.4.2 Triangle Shape and Circle Shape
The tests for the triangle shape and the circle shape
showed similar results to the Pointing Test and the
Speed Test. The mouse has the highest score, fol-
lowed by the prototype and the commercial device.
The results from the Smartphone are again the worst,
which is not only caused by the overall bad accuracy
of the used device. Additionally, the properties de-
scribed in 4.4.1 make it impossible for the user to
move along a diagonal line or curve because one of
the movement axis very often gets ’locked’ causing a
sawtooth distortion of the actual movement.
4.4.3 Combined Score
The combined score from the Precision Test clearly
shows the influence of the outlier measurement from
the square shape causing the score from the smart-
phone to be higher than the score of the commercial
pointing device. All other devices show a similar re-
lation compared to the Pointing Test and Speed Test.
The distribution of the results shown in Figure
7 show a relatively constant performance from the
Mouse and the commercial product. The prototype
had worse results in some cases indicating a need for
improvement. The results from the smartphone had
the highest distribution indicating that it cannot be re-
liably used for the given use-case.
Prototype
Commercial Smartphone
Mouse
0.4
0.6
0.8
1
Overall distribution
Figure 7: Distribution of the test results.
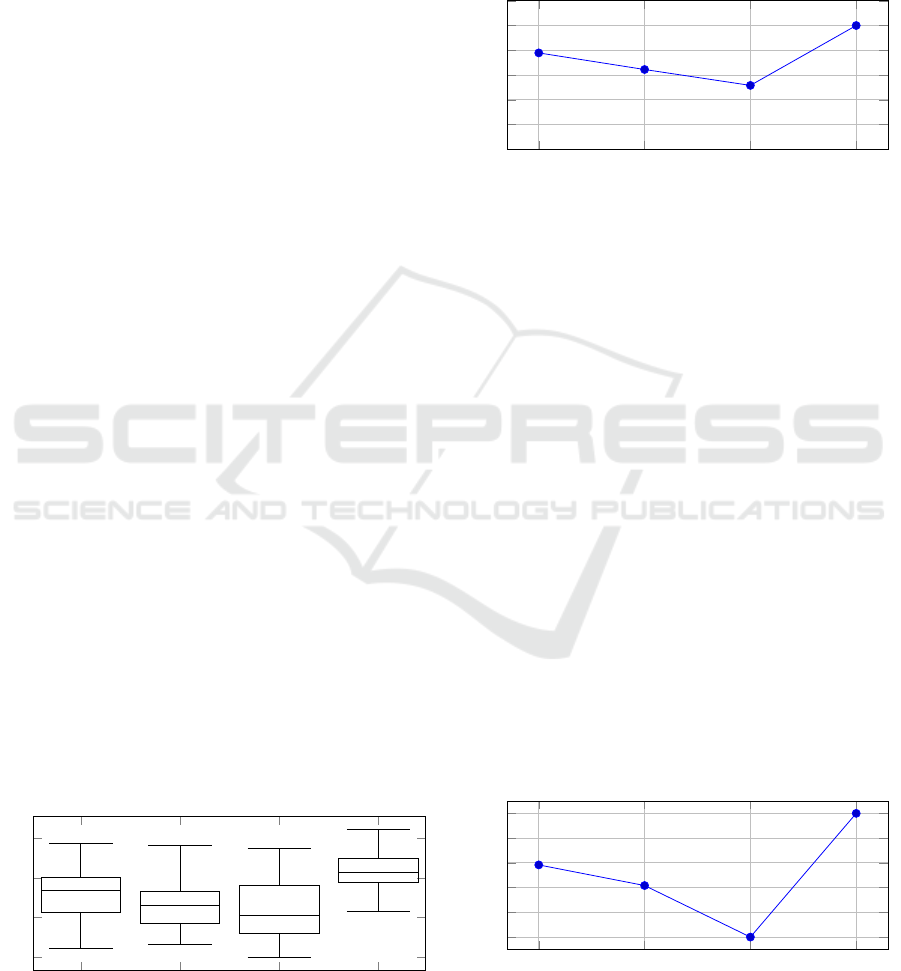
4.5 Overall Score
For the comparison of the test methods against the
subjective user assessment, the average score for each
device was calculated and normalized to be between
0 and 1. The resulting scores can be seen in Figure 8.
Prototype
Commercial Smartphone
Mouse
0.6
0.7
0.8
0.9
1
1.1
Average Score
Figure 8: Normalized average score for the tested devices.
It can be seen that the outlier from the measurement
of the Precision Test with the square shape did not
have a huge influence on the average score.
Using other values for the scaling factors α, β
and γ, the overall score will show a different scaling.
However, changing these factors will not change the
relative score between the devices. A change of α, β
and γ also changes the influences of each single test
in the overall score.
4.6 Subjective User Assessment
The subjective assessment of the usability of the
tested devices allows us to determine if our developed
evaluation methods can be used to make a qualitative
comparison of the digital pointing devices in a reli-
able way that reflects the experience of the users.
For the subjective assessment the user had to put
each device into an order from best to worst. The
best device receives 3 points, the second one 2 , the
third 1 and the last one 0 points. The results from the
subjective assessment from the test participants can
be seen in Figure 9.
Prototype
Commercial Smartphone
Mouse
0
0.2
0.4
0.6
0.8
1
User Score
Figure 9: Normalized subjective usability assessment.
As expected, the mouse achieved the highest score
and was rated to have the best usability from all test
PECCS 2019 - 9th International Conference on Pervasive and Embedded Computing and Communication Systems
134

participants. The qualitative rating of all evaluated
devices reflects the rating that was measured by the
three test methods except for the square shape from
the Precision Test due to the named factors from Sec-
tion 4.4.1.
4.7 Comparison
The results from the subjective user assessment and
the scores from the tests show a strong correlation,
which suggests that the proposed test methods can be
used to make a qualitative assessment of the usability
of a digital pointing device. Apart from one exception
all tests show the same order for the usability of the
tested devices as the subjective user assessment.
However, the results show that the subjective user
assessment has to be enhanced to allow for a quanti-
tative evaluation with the developed testing methods.
Therefore the user should not only create a ranking
for the devices but also rate them between 0 and 10
for manageability, responsiveness and precision.
5 CONCLUSION
In this paper, we presented three test methods to eval-
uate the usability of digital pointing devices whose
primary focus is on presentations. Each of the test
methods evaluates one of the three identified proper-
ties of a digital pointing device that can indicate its
usability, namely manageability, speed and precision.
Each of the tests calculates a score to assess the tested
devices. In the evaluation we showed that the assess-
ments from the proposed tests were able to reflect
the subjective assessment from test participants and
therefore showed that the tests are able to compare
and evaluate the devices in a qualitative way.
The formulas for the tests use many empirically
determined factors that showed to give reasonable re-
sults during initial tests and were chosen in a way to
cover the range of results expected to be reached by
digital pointing devices primarily used for presenta-
tions. For a more precise assessment of the device
properties, the determined factors will probably have
to be adapted to result in scores that are more true to
the subjective user assessments, which increases the
reliability of the proposed testing methods.
The adaption of the empirically determined fac-
tors leads us to the outlook for further development.
First of all the subjective user assessment has to be
enhanced so that the device tester not only rank the
tested devices from best to worst but also rate them
on a scale from 0 to 10 for each of the three proper-
ties as well as for the overall usability. Based on the
results from the subjective assessment the calculation
of the score from the tests should be adapted to be as
similar to the user rating as possible.
REFERENCES
Atkinson, P. (2006). The best laid schemes o’ mice and
men : the evolution of the computer mouse. In De-
sign and Evolution : Proceedings of Design History
Society Conference.
Batra, S., Dykstra, D., Hsu, P., Radle, K. A., and Wieden-
beck, S. (1998). Pointing device performance for lap-
top computers. In Proceedings of the Human Factors
and Ergonomics Society Annual Meeting, volume 42-
6, pages 536–540. SAGE Publications Sage CA: Los
Angeles, CA.
Charness, N., Holley, P., Feddon, J., and Jastrzembski, T.
(2004). Light pen use and practice minimize age and
hand performance differences in pointing tasks. Hu-
man Factors, 46(3):373–384.
Douglas, S. A., Kirkpatrick, A. E., and MacKenzie, I. S.
(1999). Testing pointing device performance and user
assessment with the iso 9241, part 9 standard. In Pro-
ceedings of the SIGCHI conference on Human Factors
in Computing Systems, pages 215–222. ACM.
Greenemeier, L. (2009). The origin of the com-
puter mouse. Website. Online available at
https://www.scientificamerican.com/article/origins-
computer-mouse accessed at 14-06-2019.
ISO (2007). 9241-400: Ergonomics of human–system in-
teraction – part 400: Principles and requirements for
physical input devices.
MacKenzie, I. S. and Jusoh, S. (2001). An evaluation of
two input devices for remote pointing. In IFIP In-
ternational Conference on Engineering for Human-
Computer Interaction, pages 235–250. Springer.
MacKenzie, I. S., Kauppinen, T., and Silfverberg, M.
(2001). Accuracy measures for evaluating computer
pointing devices. In Proceedings of the SIGCHI
conference on Human factors in computing systems,
pages 9–16. ACM.
Oehl, M., Sutter, C., and Ziefle, M. (2007). Considerations
on efficient touch interfaces–how display size influ-
ences the performance in an applied pointing task. In
Symposium on Human Interface and the Management
of Information, pages 136–143. Springer.
Multi-aspect Evaluation Method for Digital Pointing Devices
135
