
Evolutionary Fuzzy Logic-based Model Design in Predicting
Coronary Heart Disease and Its Progression
Christina Brester
1,2 a
, Vladimir Stanovov
2b
, Ari Voutilainen
3c
, Tomi-Pekka Tuomainen
3d
,
Eugene Semenkin
2e
and Mikko Kolehmainen
1f
1
Department of Environmental and Biological Sciences, University of Eastern Finland, Kuopio, Finland
2
Institute of Computer Science and Telecommunications, Reshetnev Siberian State University of Science and Technology,
Krasnoyarsk, Russia
3
Institute of Public Health and Clinical Nutrition, University of Eastern Finland, Kuopio, Finland
{ari.voutilainen, tomi-pekka.tuomainen, mikko.kolehmainen}@uef.fi
Keywords: Predictive Modeling, Fuzzy Logic, Genetic Algorithm, Kuopio Ischemic Heart Disease Risk Factor Study,
Heterogeneity, Performance Improvement, Knowledge Discovery.
Abstract: Various data-driven models are often involved in epidemiological studies, wherein the availability of data is
constantly increasing. Accurate and, at the same time, interpretable models are preferable from the practical
point of view. Finding simple and compact dependences between predictors and outcome variables makes it
easier to understand necessary interventions and preventive measures. In this study, we applied a Fuzzy Logic-
based model, which meets these requirements, to predict the coronary heart disease (CHD) progression during
a 30-year follow-up. The Fuzzy Logic-based model was automatically designed with an ad hoc Genetic
Algorithm using the data from the Kuopio Ischemic Heart Disease Risk Factor (KIHD) Study, a Finnish
cohort of 2682 men who were middle-aged at baseline in 1980s. Using cross-validation, we found out that the
sample from the KIHD study is heterogeneous and after filtering out 10% of outliers, the predictive accuracy
increased from 65% to 73%. The generated rule bases include 19 fuzzy rules on average with maximum 7
variables in one rule from the initial set of 638 predictor variables. The selected predictors of CHD progression
are informative and diverse representing physical aspects, behavior, and socioeconomics. The Fuzzy Logic-
based model creates a comprehensive set of predictors that enables us to better understand the complexity of
illnesses and their progression. Moreover, the Fuzzy Logic-based model has potential to provide tools to
analyse and deal with heterogeneity in large cohorts.
1 INTRODUCTION
At the present time, epidemiological studies involve
a huge variety of analytical tools, starting from
traditional statistical methods and ending with
intellectual learning algorithms used to train
advanced data-driven models. In many medical
applications, artificial intelligence is a booming trend,
which is supposed to yield fruitful results (Beam and
Kohane, 2016). Indeed, some medical diagnostic
a
https://orcid.org/0000-0001-8196-2954
b
https://orcid.org/0000-0002-1695-5798
c
https://orcid.org/0000-0002-0664-2675
d
https://orcid.org/0000-0002-1949-3787
e
https://orcid.org/0000-0002-3776-5707
f
https://orcid.org/0000-0002-9532-2285
systems show the high accuracy and even surpass
human expertise (Gulshan et al., 2016). To be
effective, these methods require the reliable and
representative data, which allows generalizations
based on the extracted knowledge.
There are many available cohorts describing study
populations, which have recently been used in the
descriptive and predictive modeling (Song and
Chung, 2010). A typical analysis aims either at
investigating influence of a particular risk factor on
360
Brester, C., Stanovov, V., Voutilainen, A., Tuomainen, T., Semenkin, E. and Kolehmainen, M.
Evolutionary Fuzzy Logic-based Model Design in Predicting Coronary Heart Disease and Its Progression.
DOI: 10.5220/0008363303600366
In Proceedings of the 11th International Joint Conference on Computational Intelligence (IJCCI 2019), pages 360-366
ISBN: 978-989-758-384-1
Copyright
c
2019 by SCITEPRESS – Science and Technology Publications, Lda. All rights reserved

disease development or estimating the probability of
having the disease in the future based on predictors
(Virtanen et al., 2018). Although many studies
present such analyses, their limitations should be
disclosed. Firstly, results depend on the sample size,
its quality, and representativeness (Yan et al., 2017).
The information from questionnaires, which is
included in most of cohorts, is not fully reliable due
to subjectivity and usually contains a lot of missing
values (Lee and Yoon, 2017). Existing trends and
expectations also add some bias to analysis
(Ioannidis, 2005). Secondly, no validation is
normally applied, which puts in doubt the possibility
of extrapolating the results obtained (Riley et al.,
2016). Moreover, in predictive modeling, it is
generally accepted to keep only those subjects who
were healthy when they entered the study (Vartiainen
et al., 2016). This implies that the model cannot be
used to predict disease progression. Therefore, more
sophisticated ways of handling epidemiological data
should be applied to discover genuine potentials of
predictive data-driven models.
In this paper, we focus on one specific cohort, the
Kuopio Ischemic Heart Disease Risk Factor (KIHD)
Study (Kauhanen, 2013). Our goal is to predict the
coronary heart disease (CHD) progression within a
30-year follow-up for healthy subjects as well as
those having CHD at baseline. For people with no
CHD at baseline, “progression” means either
diagnosed CHD or an acute myocardial infarction
(AMI) during the follow-up, for people with CHD or
AMI at baseline, it means a new AMI. As opposed to
traditional epidemiological studies, we test a
statistical approach with no preliminary knowledge-
based variable selection, include subjects and
variables with missing values, and implement cross-
validation to assess the model performance
objectively.
We use a Fuzzy Logic-based model automatically
designed with a modified genetic algorithm.
Generally, Fuzzy Logic systems are easily
interpretable, which makes them preferable for
epidemiological studies. Besides, the presented
approach has some other benefits: 1) to prevent
overfitting, we limit the number of generated rules
and their length; 2) the learning algorithm copes with
missing values so that no imputation is needed; 3) no
initial rule base is required from the domain experts,
as the algorithm is capable of generating a meaningful
rule base and evolving it during the heuristic search.
The main point of the paper is neither the Fuzzy
Logic-based model itself nor its performance, but the
knowledge extracted about the KIHD cohort. Firstly,
we show how heterogeneous the sample is: cross-
validation helps to reveal inconsistency between the
training and test data (Shah et al., 2018). It might be
explained with lots of outliers, mislabeling or absence
of the informative predictors. Nevertheless, filtering
out some subjects leads to the higher model
performance and the improvement of homogeneity in
the sample. Lastly, we analyze the generated fuzzy
rules and the selected predictor variables, which are
meaningful for predicting CHD and its progression.
2 FUZZY LOGIC-BASED
PREDICTIVE MODEL DESIGN
The Hybrid Evolutionary Fuzzy Classification
Algorithm (HEFCA) used in this study was originally
presented by Stanovov et al. (2015) and further
developed by Stanovov et al. (2016). The algorithm
is based on an earlier study (Ishibuchi et al., 2013),
and it implements a specific scheme to generate the
compact and accurate fuzzy rule bases.
The generated fuzzy logic predictive model relies
on the fixed fuzzy terms for input variables,
introducing four granulations into 2, 3, 4, and 5 terms
of a triangular shape and “Don’t Care” condition
(DC) required to simplify the rules. Figure 1 shows
all the fuzzy terms which are used for each input
variable at the same time.
Figure 1: Fuzzy term granulation.
The data preparation step consisted of
transforming each input variable into the interval [0,
1] before applying the fuzzy terms. The normalization
was performed on the training sample and, then,
applied to the test set. The HEFCA algorithm has
previously been modified to handle missing values,
so that these values are considered as “Don’t Care”
condition during the fuzzy inference (Stanovov et al.,
2017).
The main HEFCA steps are as follows:
1) Sample-based initialization
2) Selection (Tournament or Rank-based)
3) Crossover
Evolutionary Fuzzy Logic-based Model Design in Predicting Coronary Heart Disease and Its Progression
361

4) Mutation (3 levels)
5) Michigan part (genetic or heuristic)
6) Operator probability adaptation
7) Stopping criterion check, return to step 2 (the
number of generations left)
The sample-based initialization used randomly
chosen instances from the training sample to generate
realistic rules. In this procedure, for each variable in
the rule, one of 14 fuzzy terms, is chosen with the
probability proportional to the membership function
value for this particular term. After this, every term
was replaced by “Don’t Care” condition with the
probability of 0.9. The quality of each generated rule
was estimated using the confidence value:
→
∑
∈
∑
,
(1)
where A
q
is the q-th rule left part, k is the class
number, μ
Aq
(x
p
) is the membership value for the input
value x
p
. The class number corresponding to the
newly generated rule was determined as the class
having the highest confidence. The weight of each
rule was estimated as:
2∙
→1,
(2)
so that the confidence of 1 is transformed to the
weight equal to 1, and the confidence of 0.5 – to zero
weight. If the generated rule had the confidence lower
than 0.5, the rule was generated again until a valid
rule is obtained. This filtering of the rules was shown
to be highly competitive in (Ishibuchi et al., 2005).
The number of rules was limited by NR
max
, and
during the initialization step, the rule base was filled
with NR
max
/2 rules.
The fitness of each rule base was calculated as the
linear combination of three main criteria, i.e., the
error on the training sample with a weight of 100, the
number of rules with a weight of 1, and the average
rule length with a weight of 1.
For selection, there were two different methods
used: the linear rank selection and the tournament
selection with a tournament size of 5. The crossover
step used a specific operator, in which one newly
generated offspring had the random number of rules
from 1 to min(|S
1
|+|S
2
|, NR
max
), where |S
i
| is the size of
the rule base. For the new rule base, the rules either
from the first or the second parent were chosen
randomly.
The mutation operator changed every term in the
rule base to randomly chosen, including “Don’t
Care” conditions with three probability levels:
1/(3|S|), 1/|S|, 3/|S| corresponding to weak, average
and strong mutations.
In the Michigan part, the rule base was considered
as a population of a genetic algorithm. The fitness
value of the rule was estimated as the number of
instances correctly classified with this specific rule.
Three types of the Michigan part were applied:
adding rules, deleting the worst rules, or replacing the
worst rules with the newly generated. The number of
rules to be added, removed or replaced was estimated
as a rounded value of |S|/5, but the total number of
rules was limited by NR
max
. If there were two equal
rules, only one of them received non-zero fitness, and
the second was removed. Generating new rules was
performed in two ways: in the first case, new rules
were generated using the same heuristic as for
initialization, while in the second case they were
generated with genetic operators, namely the
tournament selection, the uniform crossover, and the
average mutation.
To choose among the variants of presented
genetic operators, the self-configuration scheme
originally described by Semenkina and Semenkin
(2014) was applied. The probability value was
assigned to each operator, and initially set to 1/z,
where z is the number of operators of a particular
type, for example, 3 levels of mutation. The
estimation of success of each operator type was using
the averaged fitness values:
∑
,1,2…,,
(3)
where f
ij
is the fitness the j-th offspring generated with
the i-th operator type, and n
i
is the number of
offspring generated with the i-th operator. The
operator having the highest fitness was considered as
the winning operator, its probability p
i
was increased
by10.5/ , while for other operators the
probabilities were decreased by 0.5/, where N is
the total number of generations. The probability of
applying each operator could not be decreased lower
than 0.05. The self-configuration procedure was
applied to two selection types, three mutation types,
and two types of generating new rules in the Michigan
part, i.e., heuristic and genetic.
3 DATA DESCRIPTION
The KIHD population cohort study is an ongoing
project launched in 1984 and carried out in Eastern
Finland where the population has one of the highest
risks of CHD (Salonen, 1988). The baseline
examinations were performed in 1984–1989 for 2 682
randomly chosen middle-aged men (42, 48, 54, and
60 years) living in the city of Kuopio and the
FCTA 2019 - 11th International Conference on Fuzzy Computation Theory and Applications
362

surrounding area. The examinations included
hundreds of physiological, clinical, and biochemical
measurements as well as the information from
questionnaires focused on physical, psychological,
and socioeconomic aspects of health behavior.
Although the KIHD project was mainly initiated
to investigate risk factors of cardiovascular diseases
(CVDs), other disorders such as cancer, diabetes, and
dementia, have been constantly recorded too. The
health of subjects is followed based on linkages to
several national registers which provide the updated
information on newly diagnosed cases of CVDs and
other disorders yearly.
In this paper, we focus on predicting CHD and its
progression among the KIHD participants from
1984–1989 up to 2016 based on the baseline
measurements. The initial amount of predictor
variables involved in the current study is 947. An
outcome variable takes one of two possible values,
which is defined according to the rules introduced in
Table 1. Generally, there are three categories of
subjects based on the CHD diagnosis at the baseline
examination: “no CHD”, “CHD”, and “unknown”,
which means that this information is missing. For the
first “no CHD” group, progression corresponds to
two possible situations: progression up to CHD and
progression up to AMI (including death). For the
second “CHD” group, progression means a new AMI
(also including death). The third “unknown” group
includes only subjects with incidents of AMI during
the follow-up, which also means progression. The
rest of this group has been excluded from modelling
since we cannot be sure about the development of
CHD for these subjects (the last line in Table 1). All
other cases have “no progression” labels.
Table 1: CHD development and corresponding labels.
Baseline status
(CHD diagnosed by
a doctor)
Diagnosis or event
during the follow-up
Label (outcome
variable)
no CHD CHD and/or AMI progression
no CHD
neither CHD nor
AMI
no progression
CHD AMI progression
CHD CHD no progression
unknown
(information is
missing)
AMI progression
unknown
(information is
missing)
CHD ?
Due to inconsistency we excluded 1) subjects who
had neither CHD nor AMI during the follow-up but
died from other CVDs or as a result of any non-CVD
reason as well as 2) subjects who self-reported a
previous myocardial infarct at the baseline
examination but had no diagnosed CHD. After these
manipulations, we had 1402 subjects in the sample.
Moreover, we excluded subjects with more than
25% of missing values in the vector of predictors and
variables with more than 10% of missing values.
Eventually, we ended up with 1369 subjects (551 “no
progression” and 818 “progression”) and 683
variables in the sample.
4 EXPERIMENTAL RESULTS
In all the modeling experiments executed, the
following parameters of HEFCA were used: the
population size was 100, the number of generations
was 500, and the maximum number of rules was 40.
The first set of experiments using 5-fold cross-
validation led to the results presented in Table 2.
Table 2: Fuzzy Logic model performance and the number
of rules generated for every fold.
Fold
Accuracy on the
training data
Accuracy on
the
t
est data
The number
of rules
1 0.742 0.672 16
2 0.736 0.664 17
3 0.726 0.667 20
4 0.720 0.611 19
5 0.721 0.641 22
Average 0.729 0.651 18.8
Compared to other statistical approaches utilizing
the KIHD cohort (Brester et al., 2018a), the training
accuracy was relatively high, whereas the test
accuracy was much lower, which may also be
observed in the convergence graphs presented in
Figure 2.
During the first 100 generations a clear decreasing
trend was observed for both training and test sets,
however, after this the decrease of the training error
did not lead to any improvements on the test set,
which may have several reasons, including overfitting
and sample heterogeneity. The latter has been
previously tested using other methods, and it was
established that the sample has numerous outliers,
i.e., instances which are significantly different from
those presented in the sample (Brester et al., 2018b).
Evolutionary Fuzzy Logic-based Model Design in Predicting Coronary Heart Disease and Its Progression
363
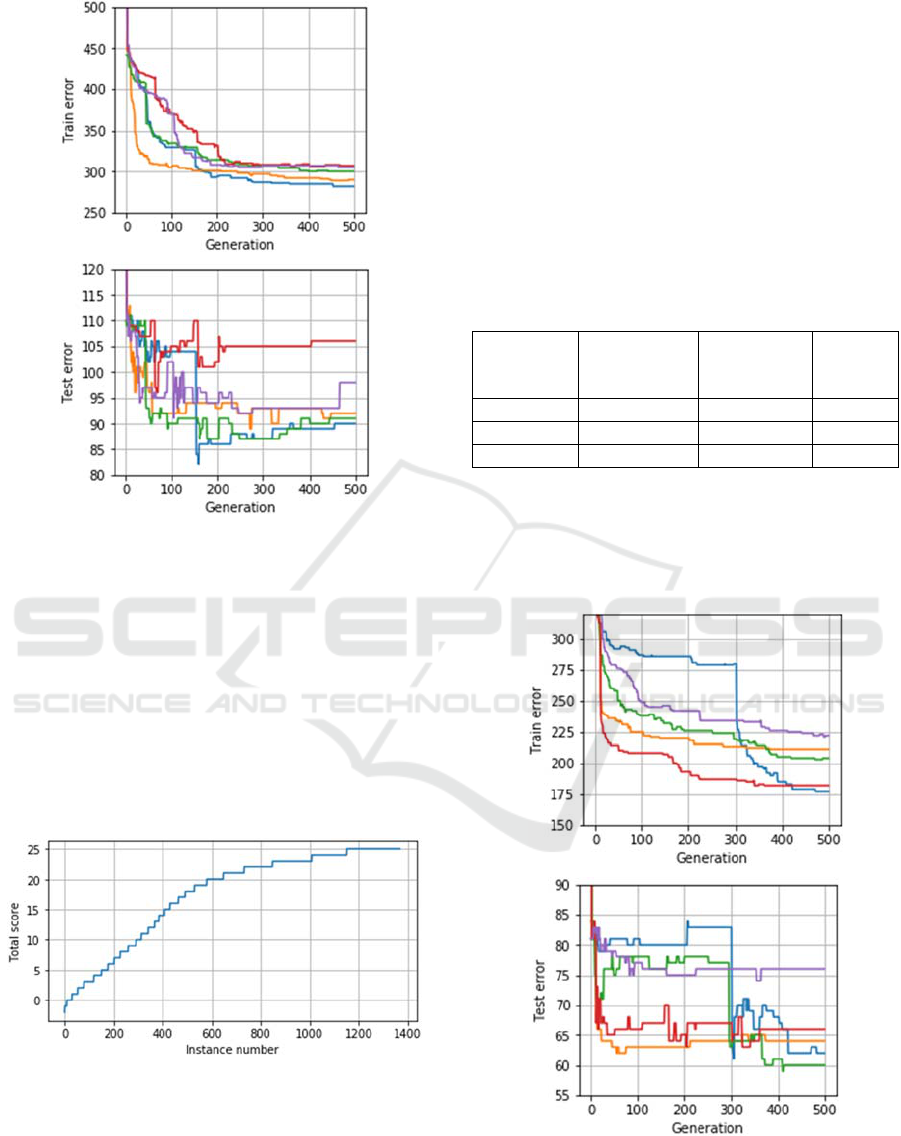
Figure 2: The number of wrong predictions on training and
test samples during each run (fold) of cross-validation.
For sample filtering, the entire available dataset
(training and test examples together) was used to
perform training within 25 independent runs of
HEFCA, and for each subject we recorded if it was
classified correctly (getting the score of 1),
incorrectly (score = 0) or not classified, i.e., not
described by any rule (score = -1). After these
independent runs, subjects were sorted by the total
scores, which are presented in a graphical form in
Figure 3.
Figure 3: Scores of outlier candidates.
From Figure 3 it can be observed that most of the
sample, around 800 subjects, is relatively easy to
classify, i.e. they are having scores of 20 and more.
However, other 600 subjects have much lower scores,
which means that these subjects are either never
classified
using the generated rule base
or have very
small chance to be classified. Moreover, some
subjects had negative scores, which mean that they
were not even covered with fuzzy rules in many
cases.
Based on these observations and the knowledge
about the sample structure, the next set of
experiments was performed using three variants of
sample filtering: deleting 5%, 10% or 15% of
instances with the lowest scores (Figure 3).
Table 3: Training and test accuracies for three filtered
samples averaged over 5 folds.
Percentage
of removed
cases
Accuracy on
the training
data
Accuracy on
the test data
The
number
of rules
5% 0.763 0.686 20.2
10% 0.796 0.731 17.2
15% 0.852 0.766 19
Removing outliers significantly improved the
classification quality of rule bases designed by
HEFCA, for both training and test samples (Table 3).
Also, the training and test errors now had similar
decreasing trends (Figure 4).
Figure 4: The number of wrong predictions on training and
test samples during each run (fold) of cross-validation, 10%
outliers removed.
FCTA 2019 - 11th International Conference on Fuzzy Computation Theory and Applications
364
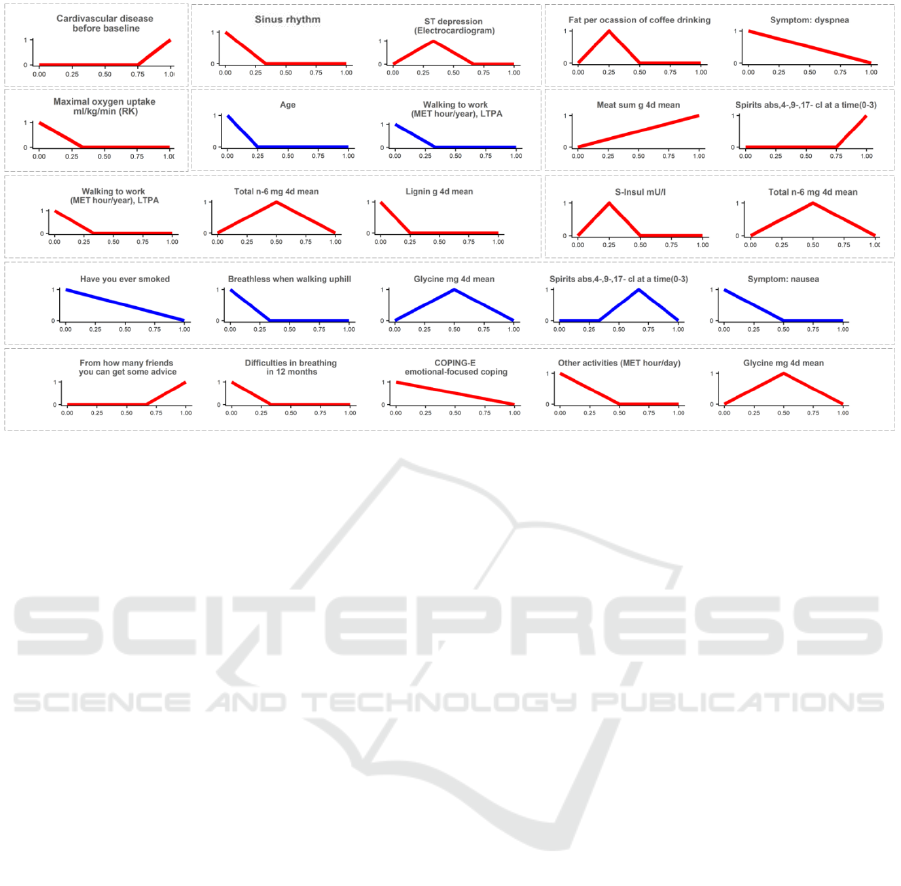
Figure 5: Examples of the rules generated by HEFCA. Each rule is separated with dashed borders. Rules of blue color
corresponds to “no progression” predictions; rules of red color represent “progression” predictions.
Additionally, we analyzed the most frequently
used rules, which were generated in the experiment
after filtering out 10% of the sample (Figure 5). Ten
rules were randomly selected from different folds of
cross-validation. There are some rules including only
one variable, which usually has clear relevance to the
output variable, e.g., cardiovascular disease before
baseline or maximal oxygen uptake. So, the binary
variable “cardiovascular disease before baseline”
took 1 if a subject had CVD before the baseline
examination and 0 otherwise. Looking at its term
shape, we see that the value of 0 has the lowest
membership, consequently, the rule is not applied in
such cases, whereas the value of 1 has the highest
membership and leads to the “CHD progression”
prediction. On the contrary, only low values of the
“maximal oxygen uptake” variable have the high
membership and correspond to the “CHD
progression” prediction. A similar analysis could be
done for other variables to understand their
relationship with the outcome.
Longer rules combine predictors from different
categories: behavioral characteristics, medication,
diet, results of some exercises and tests, even
socioeconomic variables. The most frequently used
predictor variables are age; blood pressure, oxygen
uptake, electrocardiogram in exercises; smoking and
drinking; diseases in the past.
Interestingly, having a similar term shape, the
same predictors might be included in several rules,
which correspond to different outcome values. This
implies that in combination with different risk factors
their influence on the outcome may vary.
5 CONCLUSIONS
This article introduced the results of the data-driven
predictive modeling, where the Fuzzy Logic-based
model was used to predict CHD and its progression
for the subjects from the KIHD study. The specially
modified genetic algorithm was applied to generate
the fuzzy rule base from 683 predictors, which were
available after data preprocessing. As opposed to
traditional epidemiological studies, we did not
exclude subjects with CHD diagnosed at the baseline
examination but predicted its progression, which in
fact is more reasonable from the practical point of
view.
The experimental results showed heterogeneity of
the KIHD sample: filtering out 10% of the data led to
the higher consistency between training and test sets
in the cross-validation procedure and the accuracy
improvement from 65% to 73%. The other important
result was that the variables, which were selected for
predicting CHD and its progression, were diverse but
still informative, and them created a comprehensive
and predictable set.
As a next step, we are planning to expand the
KIHD sample using genetical variables and perform
similar modeling experiments as presented in this
paper. Also, other cohorts should be involved to
Evolutionary Fuzzy Logic-based Model Design in Predicting Coronary Heart Disease and Its Progression
365

investigate advantages of Fuzzy Logic-based models
for epidemiological studies more thoroughly.
ACKNOWLEDGEMENTS
The reported study was funded by Russian
Foundation for Basic Research, Government of
Krasnoyarsk Territory, Krasnoyarsk Regional Fund
of Science, to the research project: 18-41-242011
«Multi-objective design of predictive models with
compact interpretable strictures in epidemiology».
REFERENCES
Beam, A.L., Kohane, I.S., 2016. Translating artificial
intelligence into clinical care, JAMA, 316(22), pp.
2368–69. doi:10.1001/jama.2016.17217
Brester, C., Kauhanen, J., Tuomainen, T.P., Voutilainen, S.,
Rönkkö, M., Ronkainen, K., Semenkin, E.,
Kolehmainen, M., 2018a. Evolutionary methods for
variable selection in the epidemiological modeling of
cardiovascular diseases. BioData Mining, 11:18.
https://doi.org/10.1186/s13040-018-0180-x
Brester, C., Ryzhikov, I., Tuomainen, T.P., Voutilainen, A.,
Semenkin, E., Kolehmainen, M., 2018b. Multi-
objective approach for Support Vector Machine
parameter optimization and variable selection in
cardiovascular predictive modeling. ICINCO (1) 2018,
pp. 209–215.
Ioannidis, J.P.A., 2005. Why Most Published Research
Findings Are False. PLoS Med 2(8): e124.
https://doi.org/10.1371/journal.pmed.0020124
Ishibuchi, H., Mihara, S., Nojima, Y., 2013. Parallel
Distributed Hybrid Fuzzy GBML Models With Rule
Set Migration and Training Data Rotation. IEEE Trans.
on Fuzzy Systems, vol. 21, no. 2.
Ishibuchi, H., Yamamoto, T., 2005. Rule weight
specification in fuzzy rule-based classification systems.
IEEE Trans. on Fuzzy Systems, vol. 13, no. 4, pp. 428–
435.
Gulshan, V., Peng L., Coram M., et al., 2016. Development
and Validation of a Deep Learning Algorithm for
Detection of Diabetic Retinopathy in Retinal Fundus
Photographs. JAMA, 316(22), pp. 2402–2410.
doi:10.1001/ jama.2016.17216
Kauhanen, J., 2013. Kuopio Ischemic Heart Disease Risk
Factor Study. In: Gellman M.D., Turner J.R. (eds)
Encyclopedia of Behavioral Medicine. Springer, New
York, NY. https://doi.org/10.1007/978-1-4419-1005-
9_328
Lee, C.H., Yoon, H.J., 2017. Medical big data: promise and
challenges. Kidney research and clinical practice,
36(1), pp. 3–11. doi:10.23876/j.krcp.2017.36.1.3
Riley, R.D., Ensor J., Snell, K.I., et al., 2016. External
validation of clinical prediction models using big
datasets from e-health records or IPD meta-analysis:
opportunities and challenges. BMJ 353: i3140.
Salonen, J.T., 1988. Is there a continuing need for
longitudinal epidemiologic research? The Kuopio
Ischaemic Heart Disease Risk Factor Study. Ann Clin
Res, 20(1-2), pp. 46–50.
Semenkina, M., Semenkin, E. Hybrid self-configuring
evolutionary algorithm for automated design of fuzzy
classifier, in Y. Tan, Y. Shi, C.A.C. Coello (Eds.),
Advances in Swarm Intelligence, PT1, LNCS 8794,
2014, pp. 310-317.
Shah, N.D., Steyerberg, E.W., Kent, D.M., 2018. Big Data
and Predictive Analytics: Recalibrating Expectations.
JAMA, 320(1), pp. 27–28. doi:10.1001/jama.2018.5602
Song, J.W., Chung, K.C., 2010. Observational studies:
cohort and case-control studies. Plastic and
reconstructive surgery, 126(6), pp. 2234–2242.
doi:10.1097/PRS.0b013e3181f44abc
Stanovov, V., Semenkin, E., Semenkina, O., 2015. Self-
configuring hybrid evolutionary algorithm for fuzzy
classification with active learning. IEEE Congress on
evolutionary computation (CEC 2015, Japan).doi:
10.1109/CEC.2015.7257108
Stanovov, V., Semenkin, E., Semenkina, O., 2016. Self-
Configuring Hybrid Evolutionary Algorithm for Fuzzy
Imbalanced Classification with Adaptive Instance
Selection. Journal of Artificial Intelligence and Soft
Computing Research, 6(3), pp. 173-188.
Stanovov, V., Brester, C., Kolehmainen, M., Semenkina,
O., 2017. Why don’t you use Evolutionary Algorithms
in Big Data? IOP Conference Series: Materials Science
and Engineering, 173 (1). doi: 10.1088/1757-
899X/173/1/012020
Vartiainen, E., Laatikainen, T., Peltonen, M., Puska, P.M.,
2016. Predicting Coronary Heart Disease and Stroke:
The FINRISK Calculator. Global heart, 11 2, pp. 213–
6.
Virtanen, J.K., Wu, J.H.Y., Voutilainen, S., Mursu, J.,
Tuomainen, T.P., 2018. Serum n-6 polyunsaturated
fatty acids and risk of death: the Kuopio Ischaemic
Heart Disease Risk Factor Study. Am J Clin Nutr,
107(3), pp. 427–435. doi: 10.1093/ajcn/nqx063.
Yan, F., Robert, M., Li, Y., 2017. Statistical methods and
common problems in medical or biomedical science
research. International journal of physiology,
pathophysiology and pharmacology, 9(5), pp. 157–163.
FCTA 2019 - 11th International Conference on Fuzzy Computation Theory and Applications
366
