
Things You Might Not Know about the k-Nearest Neighbors Algorithm
Aleksandra Karpus
a
, Marta Raczy
´
nska and Adam Przybylek
b
Faculty of Electronics, Telecommunications and Informatics, Gda
´
nsk University of Technology, ul. G. Narutowicza 11/12,
80-233 Gda
´
nsk, Poland
Keywords:
Recommender Systems, Collaborative Filtering, Similarity Measure, Neighborhood Size.
Abstract:
Recommender Systems aim at suggesting potentially interesting items to a user. The most common kind of
Recommender Systems is Collaborative Filtering which follows an intuition that users who liked the same
things in the past, are more likely to be interested in the same things in the future. One of Collaborative
Filtering methods is the k Nearest Neighbors algorithm which finds k users who are the most similar to an
active user and then it computes recommendations based on the subset of users. The main aim of this paper is
to compare two implementations of k Nearest Neighbors algorithm, i.e. from Mahout and LensKit libraries,
as well as six similarity measures. We investigate how implementation differences between libraries influence
optimal neighborhood size k and prediction error. We also show that measures like F1-score and nDCG are
not always a good choice for choosing the best neighborhood size k. Finally, we compare different similarity
measures according to the average time of generating recommendations and the prediction error.
1 INTRODUCTION
Recommender Systems aim at suggesting potentially
interesting items to a user. They are present in ev-
eryday life, e.g. in e-commerce shops, social media,
news portals or media services. The most common
kind of Recommender Systems is Collaborative Fil-
tering which follows an intuition that users who are
similar to each other, i.e. liked the same things in
the past, are more likely to be interested in the same
things in the future. For example, if Alice and Bob
are both fans of fantasy books and Bob read one more
book than Alice and liked the book, then we could
recommend it to her with a big probability that she
would like it too (Jannach et al., 2010).
One of Collaborative Filtering methods is the k
Nearest Neighbors algorithm (kNN). It first finds k
users who are the most similar to an active user and
then it computes recommendations based on the sub-
set of users. Similar users are called the nearest neigh-
bors. The neighborhood size k is given as a parameter
to the algorithm. We define what we mean by ”simi-
lar” by choosing a similarity measure.
The neighborhood size is very important for the
kNN algorithm. As shown in (Herlocker et al., 1999),
high k value leads to big prediction error and bad rec-
a
https://orcid.org/0000-0001-6198-1234
b
https://orcid.org/0000-0002-8231-709X
ommendations. It is also time and memory consum-
ing. However, too small k values leads to the over-
fitting problem. Therefore, it is crucial to choose the
neighborhood size wisely.
The main aim of this paper is to compare two im-
plementations of the kNN algorithm, i.e. from Ma-
hout
1
and LensKit
2
libraries, as well as six similar-
ity measures: Pearson correlation coefficient, cosine
distance, euclidean distance, Jaccard similarity, Log-
likelihood ratio and Spearman’s rank correlation co-
efficient. We investigate how implementation differ-
ences between libraries influence optimal neighbor-
hood size k and prediction error. We also show that
precision, recall, F1-score and nDCG measures are
not always good choice for choosing the best neigh-
borhood size k.
The rest of the paper is organized as follows. Sec-
tion 2 provides background for this paper. In Sec-
tion 3 we describe datasets that we used for experi-
ments. Detailed information about choosing neigh-
borhood size, differences in implementation of the
kNN algorithm and their influence on k value and pre-
diction error are given in Section 4. In Section 5 we
present average time that the kNN algorithm needs to
generate a list of top-10 recommendations depending
on a library and a similarity measure. Section 6 sum-
1
https://mahout.apache.org/
2
https://java.lenskit.org/
Karpus, A., Raczy
´
nska, M. and Przybylek, A.
Things You Might Not Know about the k-Nearest Neighbors Algorithm.
DOI: 10.5220/0008365005390547
In Proceedings of the 11th International Joint Conference on Knowledge Discovery, Knowledge Engineering and Knowledge Management (IC3K 2019), pages 539-547
ISBN: 978-989-758-382-7
Copyright
c
2019 by SCITEPRESS – Science and Technology Publications, Lda. All rights reserved
539

marizes all experiments and Section 7 concludes the
paper.
2 BACKGROUND
In this section we briefly describe similarity measures
that were used in our experiments. We also report
approaches for choosing the best neighborhood size
for the kNN algorithm that have been presented in the
literature.
2.1 Similarity Measures
The most common similarity measure is the Pearson
correlation coefficient (Pearson, 1895; Soper et al.,
1917) which is presented in the formula (1). This
measure considers the fact that users interpret rating
scale in different ways. Some of them rate just items
that they really like (only ratings 4 and 5) and some
of them use the whole rating scale.
sim(x, y) =
∑
i∈I
(r
x,i
− ¯r
x
)(r
y,i
− ¯r
y
)
p
∑
i∈I
(r
x,i
− ¯r
x
)
2
p
∑
i∈I
(r
y,i
− ¯r
y
)
2
,
(1)
where i indicates an item from the set of items I, r
x,i
is the rating that a user x gave to an item i and the
symbol ¯r
x
corresponds to the average rating of user x.
Another very popular similarity measure is the co-
sine similarity (Singhal, 2001) given by the formula
(2).
cos(x, y) =
x • y
k
x
kk
y
k
, (2)
where • indicates vector dot product and
k
x
k
is the
norm of a user vector x.
The euclidean similarity is another distance mea-
sure adapted as similarity. It is defined as a sum of
squares of differences between ratings given by two
different users. It is given by the formula (3).
d(u
1
, u
2
) =
∑
iεI(u
1
)
T
I(u
2
)
(r(i, u
1
) − (r(i, u
2
))
2
(3)
where I(u
1
) indicates a set of all items rated by the
user 1 and r(i, u
1
) is a rating given to the item i by the
user u
1
.
the Jaccard similarity (Jaccard, 1902; Jaccard,
1912) is given by the formula (4).
jacc(A, B) =
|
A ∩ B
|
|
A ∪ B
|
, (4)
where ∩ indicates the intersection and ∪ the union of
sets A and B.
The Log-likelihood ratio is similar to the Jaccard
similarity. Nevertheless, it is able to capture signifi-
cant co-occurrences. The Log-likelihood similarity of
a user with herself is not equal to 1 (Dunning, 1993).
The Spearman’s rank correlation coefficient is
based on the Pearson correlation coefficient. How-
ever, instead of user ratings it uses ranks of these rat-
ings. The rank is a place on an ordered list of user
ratings (Aggarwal, 2016).
2.2 Neighborhood Size
There are two approaches for the kNN algorithm. One
assumes to choose a threshold for similarity value,
e.g. 0.5. Neighbors that are chosen in this way,
i.e. with a higher similarity to the active user, could
be more valuable as the predictors than those with a
lower similarity (Breese et al., 1998).
The second approach just chooses a fixed number
of neighbors, i.e. neighborhood size k. It has been
proven that this technique performs better than the
one with threshold (Herlocker et al., 1999).
As shown in (Herlocker et al., 1999), too high k
value leads to the big prediction error and the bad
quality of recommendations. It is also time and mem-
ory consuming. However, too small k values leads
to the overfitting problem. Therefore, it is crucial to
choose the neighborhood size wisely.
Some papers report that a neighborhood of 20 to
50 users is reasonable, providing enough neighbors to
average out extremes (Herlocker et al., 2002; Good
et al., 1999). Nevertheless, a neighborhood size de-
pends on the data characteristics like sparsity (Syme-
onidis et al., 2014). Thus, the optimal k value should
be determined by a cross-validation (Desrosiers and
Karypis, 2011).
The idea behind a method reported in (Kim and
Cho, 2003) is to check a change in the value of the F1-
score metric depending on the given parameter of the
neighborhood size k. The values analysed are consec-
utive multiples of the number 10 in the range 10-100
and the entire interval 2-9.
The evaluation consists of examining the quality
of generated recommendations for each user from the
input set, from which the 10 best ratings of a given
user were removed. After modifying the input data,
top-10 recommendations are generated. Afterwards,
it is verified how many of removed items have been
included in the recommendation list. The whole pro-
cedure is repeated for all users and the average is cal-
culated from the outcomes.
KDIR 2019 - 11th International Conference on Knowledge Discovery and Information Retrieval
540

3 DATASETS
We performed our experiments with two publicly
available datasets: MovieLens 1M
3
and Book-
Crossing
4
.
The MovieLens 1M dataset (ML1M) contains
1,000,209 anonymous ratings of approximately 3,900
movies made by 6,040 MovieLens users who joined
MovieLens in 2000. Additionally, it contains demo-
graphic information about users and genres of movies
(Harper and Konstan, 2015).
The Book-Crossing dataset (BX) was collected in
a 4-week crawl from the Book-Crossing community.
It contains 278,858 anonymized users with demo-
graphic information, 1,149,780 ratings and 271,379
books. Ratings are made from users’ implicit and ex-
plicit feedback on books (Ziegler et al., 2005). For
further experiments we used only explicit user ratings.
Basic statistics about both datasets are presented
in Table 1.
Table 1: Basic statistics about MovieLens 1M (ML1M) and
Book-Crossing (BX) datasets.
ML1M BX
Number of users 6040 278858
Number of items 3952 271379
Number of ratings 1000209 1143780
Max number of ratings/user 2314 13602
Min number of ratings/user 20 1
Avg number of ratings/user 165.598 10.921
Rating scale 1-5 1-10
Average rating 3.582 7.601
Sparsity (in %) 4.2 0.0015
4 CHOOSING THE BEST
NEIGHBORHOOD SIZE
Since it is crucial to choose the neighborhood size
wisely, we decided to perform a series of experiments
to do so. In this section we describe two methodolo-
gies that we followed while performing experiments
and we present results obtained with both of them.
4.1 F1-score based Approach
At the beginning of our study, in order to find the op-
timal value of k, we followed the approach by (Kim
and Cho, 2003) presented in Section 2.2. We per-
formed an analysis on Book-Crossing and MovieLens
1M datasets. We used the Mahout library and its class
3
https://grouplens.org/datasets/movielens/1m/
4
https://grouplens.org/datasets/book-crossing/
GenericRecommenderIREvaluator, which calculates
metrics such as precision, recall, F1-score and nDCG.
The entire input set was taken into account for the
evaluation. The evaluate() method takes a parameter
denoting the relevance threshold, which was calcu-
lated for each set separately as the sum of the arith-
metic mean and the standard deviation of all grades
for each user separately. The Mahout library supports
the generation of this value for a user.
Since we want to compare a performance of dif-
ferent similarity measures, we repeated the procedure
six times - one per each of following measures: Pear-
son correlation coefficient, cosine distance, euclidean
distance, Jaccard similarity, Log-likelihood ratio and
Spearman’s rank correlation coefficient. Results are
presented in Figures 1 and 2 and in Table 2. Due to
the space limits, we report here only representative
subset of obtained plots.
Table 2: Best k-values for both datasets obtained with dif-
ferent similarity measures using the Mahout library and F1-
score.
Similarity ML1M BX
Pearson 2 3
Cosine 3 4
Euclidean 5 5
Jaccard 2 20
Log-likelihood 2 7
Spearman 45 6
We could observe strange curves which differ sig-
nificantly from the shape that was expected. There
is only one plot for the MovieLens dataset and the
Spearman similarity (see Figure 1) which behaves as
expected, i.e. F1-score increases along with the in-
crease of k value to some point and then starts de-
creasing. This point determines the maximum value
of F1 and the optimal neighborhood size.
Table 2 shows that the highest values of the F1-
score are in most cases achieved for small k values.
In the real systems, too low value of this parameter
causes the problem of overfitting, while too high val-
ues may contribute to the generation of recommen-
dations which are irrelevant from the user’s point of
view (Herlocker et al., 1999). Usually, the optimal k
value that is chosen for real recommendation systems
is the number from the range 40-60 (Kim and Cho,
2003).
We suspect that the problem is with the method-
ology for choosing the k value presented in (Kim and
Cho, 2003), because it is impossible to determine in
a reliable way whether the recommendations are ac-
curate. Generated recommendation list may contain
offers that the user has not assessed or seen, and yet
could be accurate for a user. The problem of how well
Things You Might Not Know about the k-Nearest Neighbors Algorithm
541
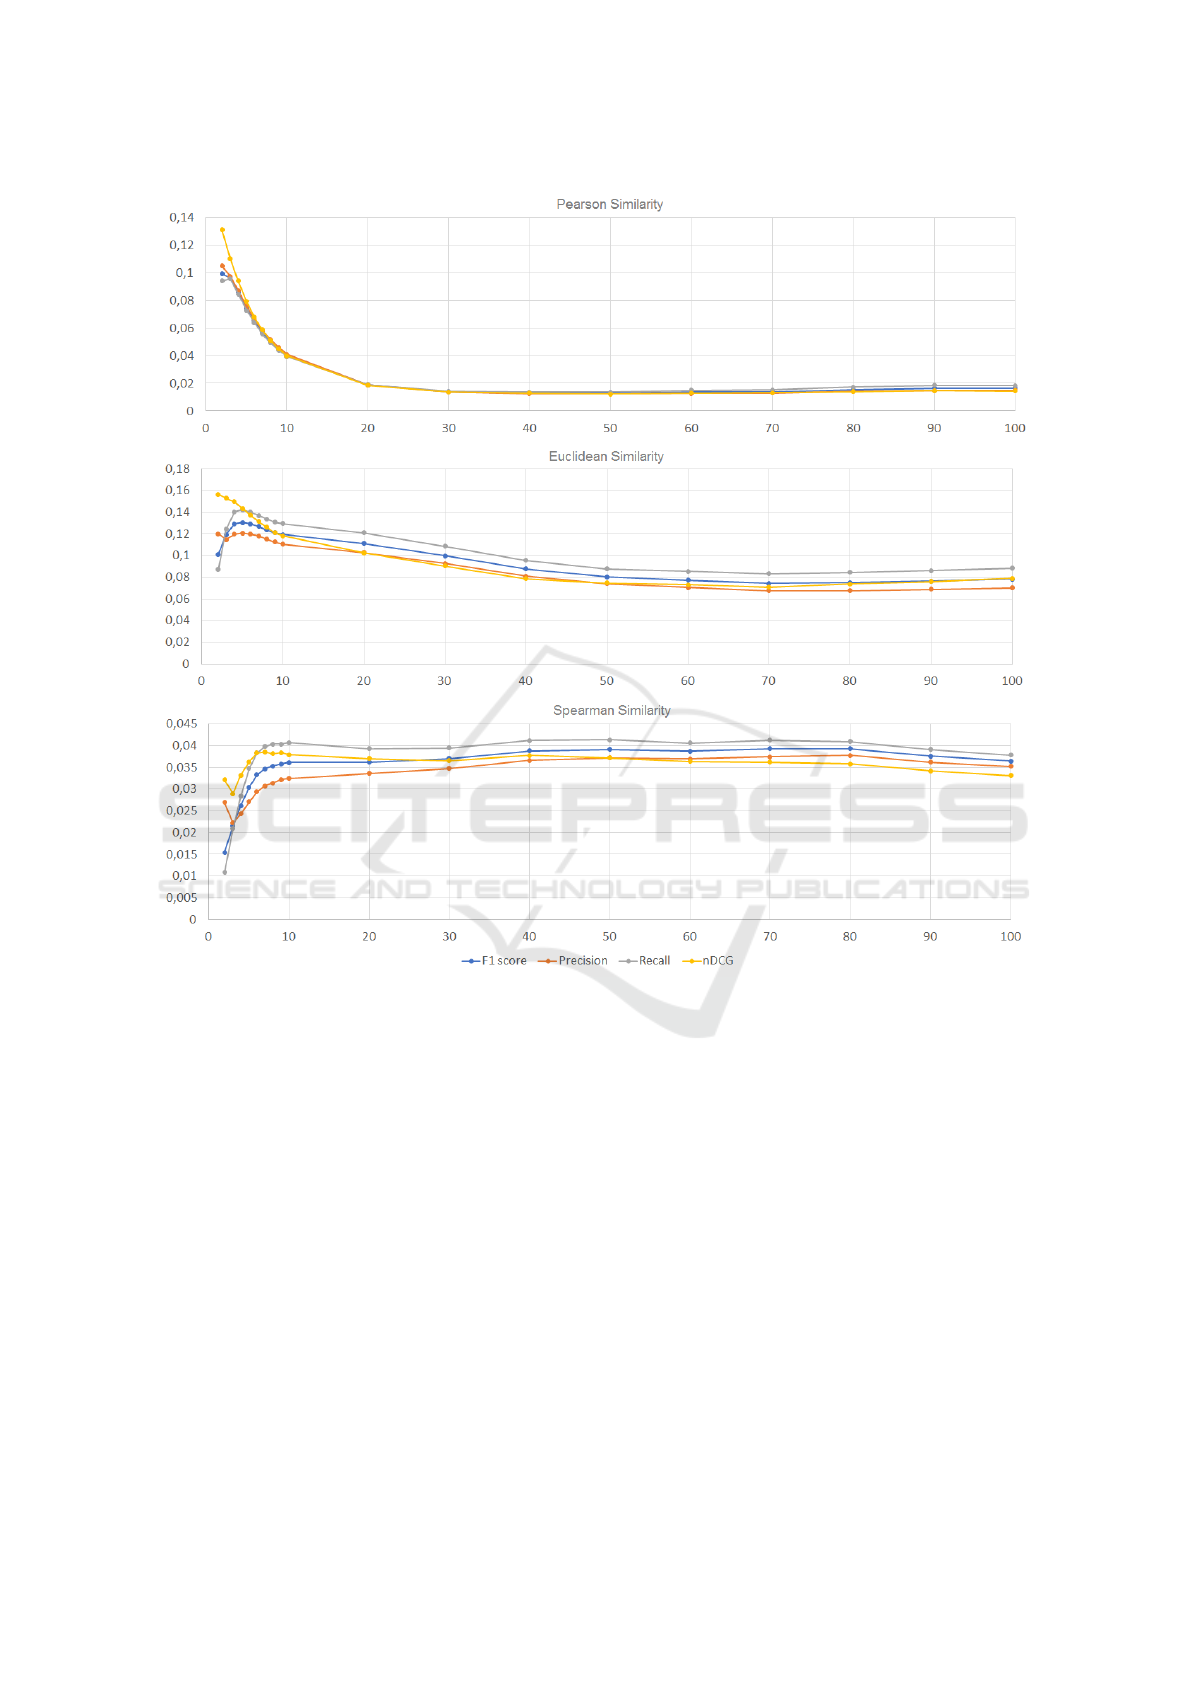
Figure 1: F1-score, Precision, Recall and nDCG depending on the k value computed for the MovieLens 1M dataset.
the generated list of recommendations is suited for a
user can not be properly validated without the partic-
ipation of real users who can give a response if the
list met their expectations after watching a movie or
reading a book from the list.
4.2 MAE based Approach
Because of the reasons mentioned above, we decided
to use the mean absolute error (MAE) for choosing
the k value, as was suggested in (Herlocker et al.,
1999). Due to decreasing MAE values at the end of
the selected interval, experiments were also carried
out on the k value equal to 150, 200, 250, 300, 400,
500, 750, 1000, 1500, 2000, 3000, 4000, 5000 and
10000. After the initial analysis of the results, a reso-
lution was also increased around the minimum MAE
value for each similarity measure separately. Unlike
the approach we followed earlier, this time we used
the 10-fold cross validation and the final MAE value
was computed as a mean of obtained results. Tables
3 and 4 present outcomes returned by Mahout and
LensKit libraries respectively. Since the LensKit li-
brary provides only two similarity measures imple-
mentations, i.e. Pearson correlation coefficient and
cosine distance, Table 4 has fewer rows than Table 3.
Please note big differences between the best neighbor-
hood size obtained with different libraries. To explain
this phenomenon we took a closer look into libraries
implementations of the kNN algorithm. We found out
that they differ significantly from each other.
The approach in the Mahout library starts with se-
lecting k nearest neighbors of an active user according
to a given similarity measure. The k value is the one
obtained as a parameter. The rating prediction for a
specific item consists of two stages. Firstly, the library
KDIR 2019 - 11th International Conference on Knowledge Discovery and Information Retrieval
542
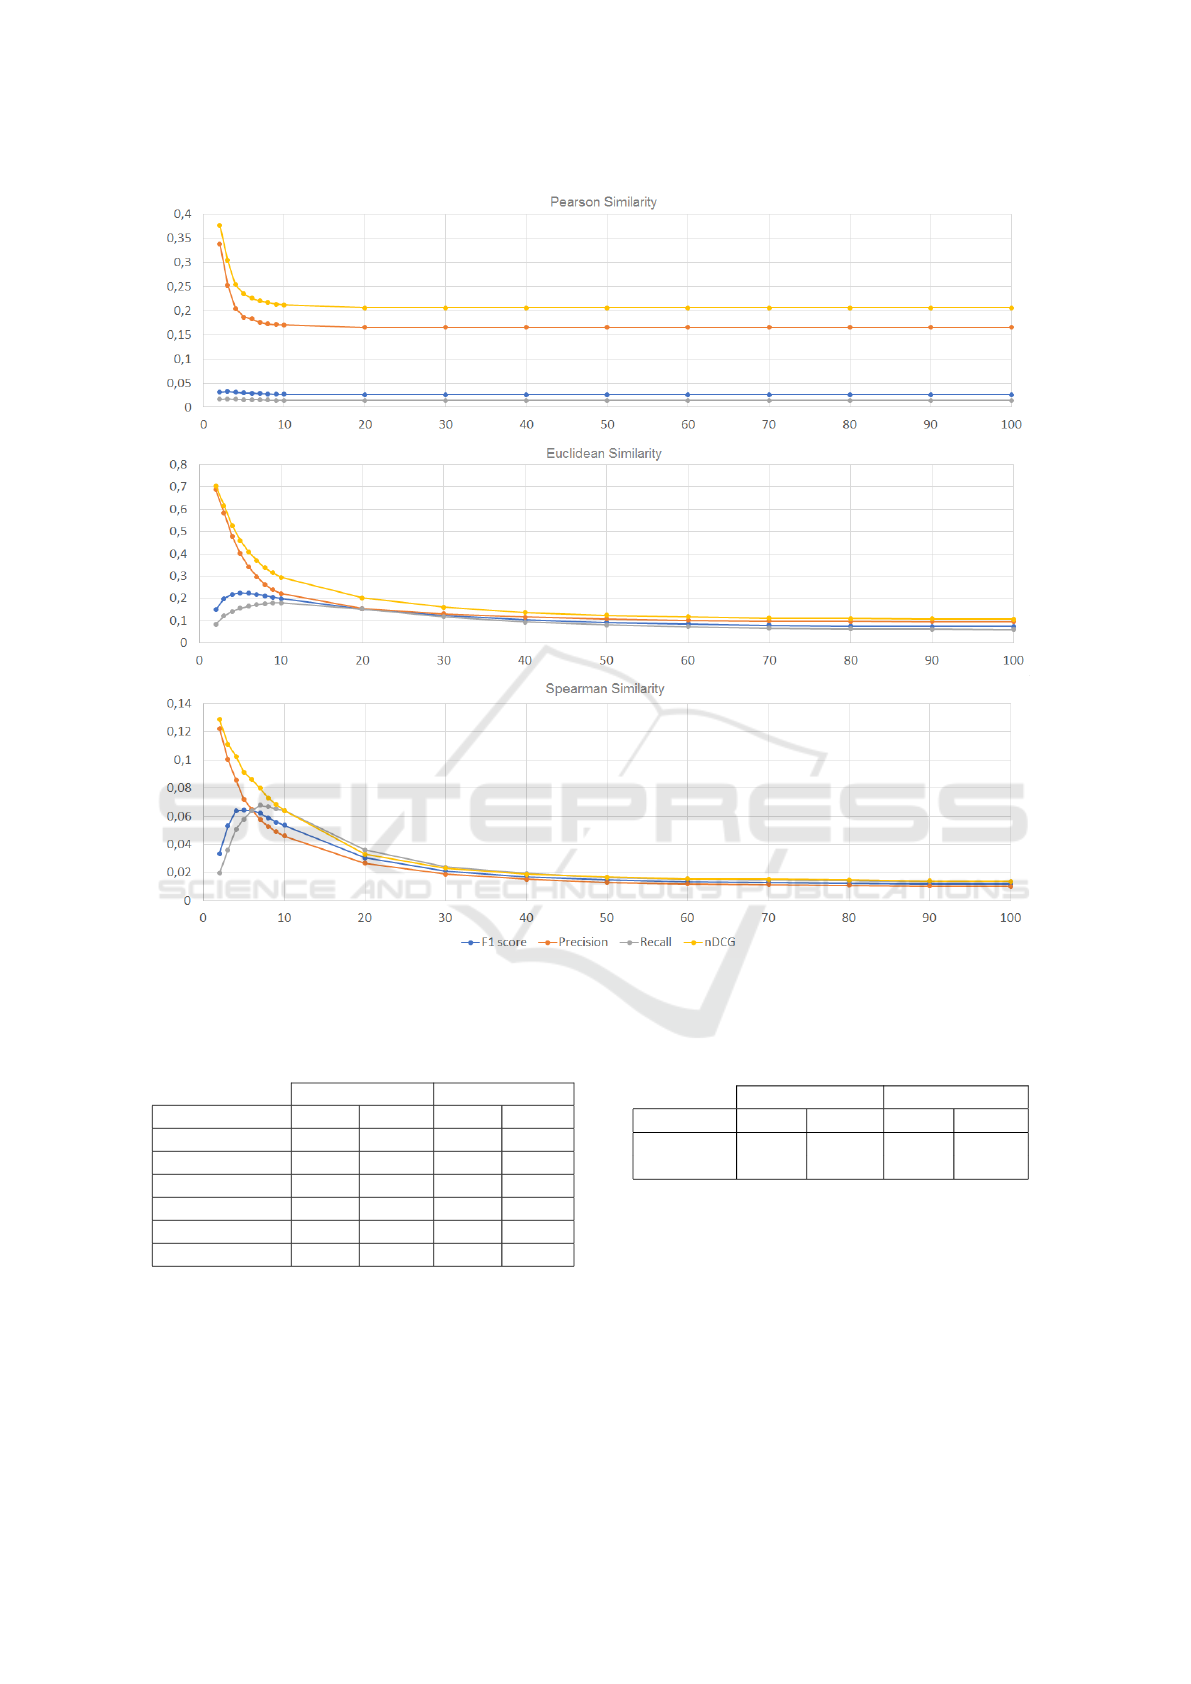
Figure 2: F1-score, Precision, Recall and nDCG depending on the k value computed for the Book-Crossing dataset.
Table 3: Best k-values for different similarity measures
received with the Mahout library on MovieLens 1M and
Book-Crossing datasets.
MovieLens 1M Book-Crossing
Similarity best k MAE best k MAE
Pearson 1400 0.760 5000 2.813
Cosine 2800 0.761 1900 1.454
Euclidean 1480 0.719 100 1.315
Jaccard 250 0.770 2950 1.489
Log-likelihood 255 0.771 4760 1.447
Spearman 1740 0.764 6000 2.211
filters out all of the nearest neighbors that have not
rated considered item. The second step is to calculate
weighted average based on the similarities and ratings
of a final set of users. The actual number of neighbors
in this implementation depends on how many users
among those selected at the beginning have rated an
item for which a rating is predicted. Figure 3 shows
Table 4: Best k-values for different similarity measures
received with the LensKit library on MovieLens 1M and
Book-Crossing datasets.
MovieLens 1M Book-Crossing
Similarity best k MAE best k MAE
Pearson 36 0,771 20 6.957
Cosine 54 0,763 56 1.590
how many users are actually taken into account (the
average of all cases in the test set) depending on the
neighborhood size given as a parameter. The analysis
was carried out on the MovieLens 1M dataset.
In the LensKit library, the k parameter specifies
the actual number of users taken into account in the
rating prediction. After analysing the approaches
used in both libraries, we modified the implementa-
tion of the LensKit library so that the method of se-
lecting the nearest users would be done in the same
Things You Might Not Know about the k-Nearest Neighbors Algorithm
543
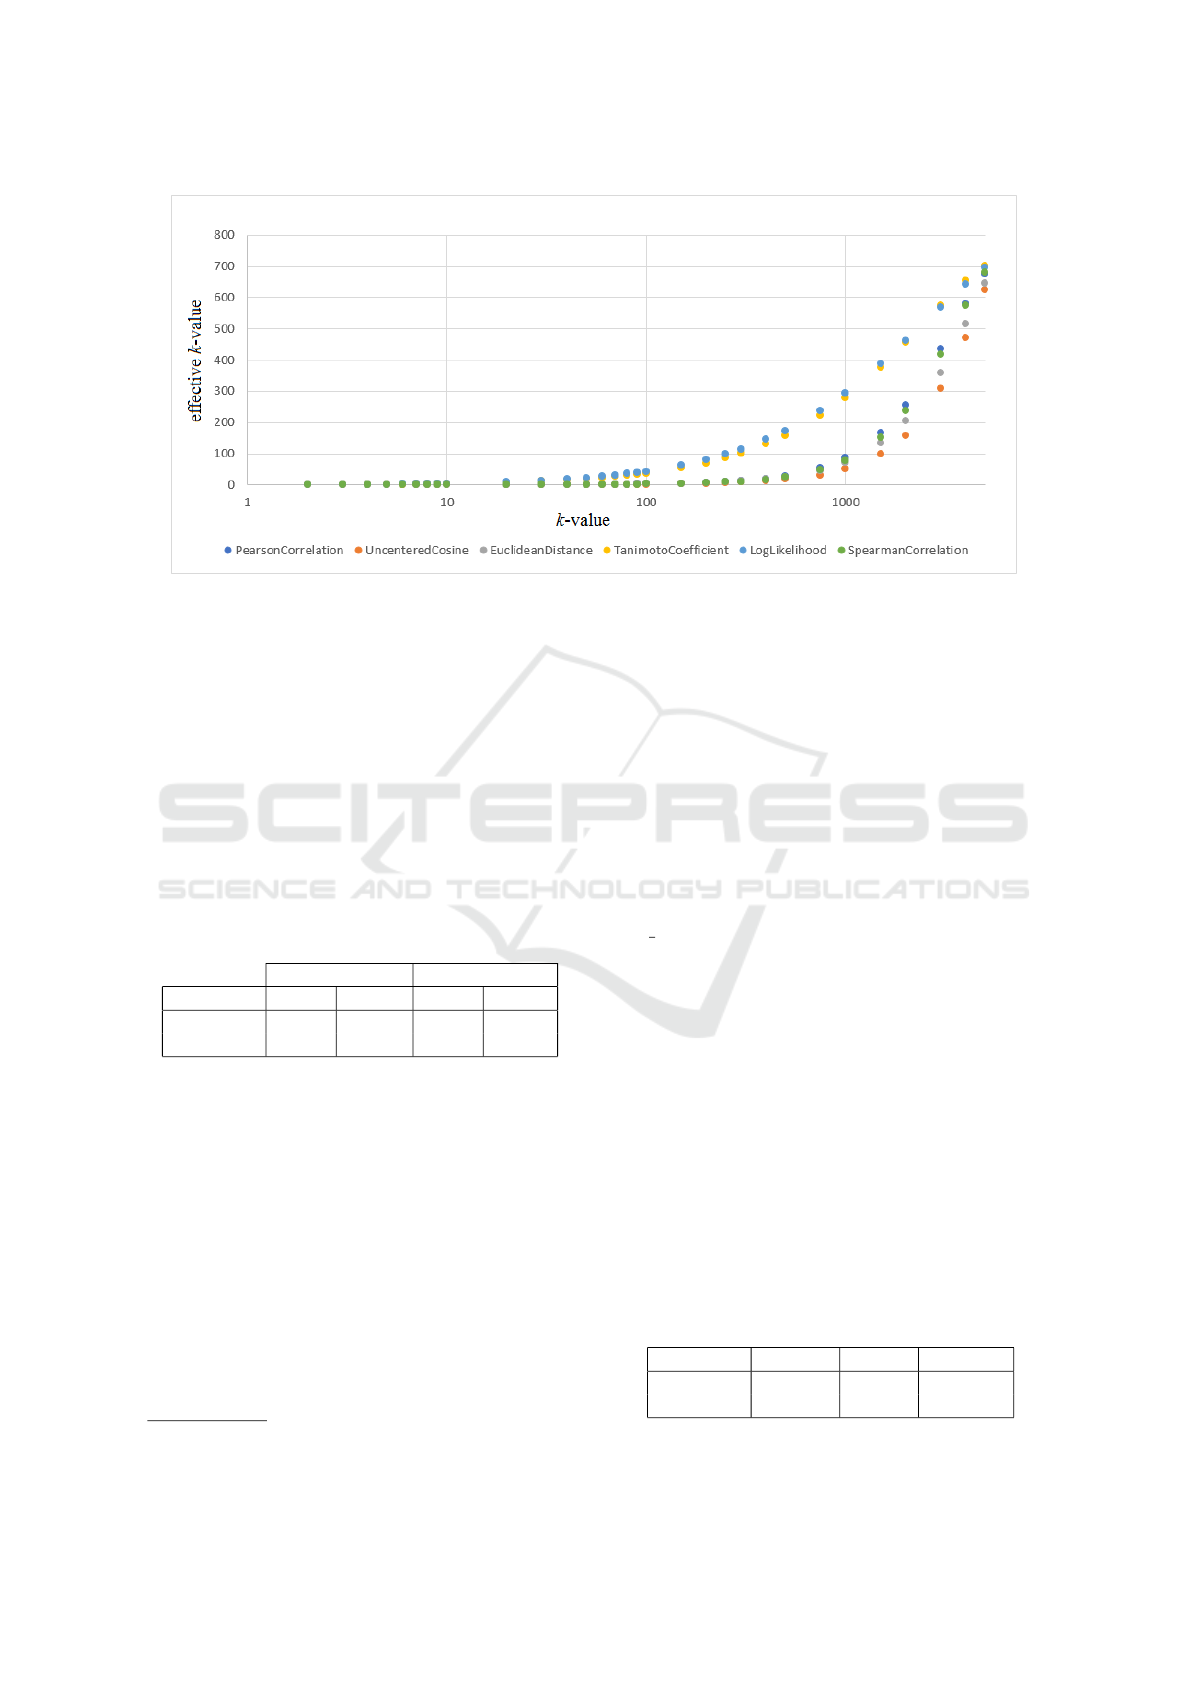
Figure 3: Dependency between an effective neighborhood size and a k value given as a parameter for the Mahout library on
the MovieLens 1M dataset.
way as in the Mahout library (see our source code
5
).
Figure 4 shows MAE value depending on the neigh-
borhood size on the MovieLens 1M dataset after
changing the implementation in the LensKit library.
The results obtained on both dataset for the Pear-
son Similarity and Cosine Similarity measures with
the LensKit library adapted to the method of select-
ing the neighborhood as in the Mahout library are pre-
sented in Table 5.
Table 5: Best k-values for different similarity measures re-
ceived with modified LensKit library on MovieLens 1M and
Book-Crossing datasets.
MovieLens 1M Book-Crossing
Similarity best k MAE best k MAE
Pearson 1000 0.765 5000 6.873
Cosine 250 0.766 6800 1.591
It should be noticed that k values increased drasti-
cally while MAE values remained almost the same
in comparison with the outcome from unchanged
LensKit library. However, all results still differ from
those obtained with the Mahout library. For further
experiments we use unchanged LensKit implementa-
tion.
5
https://github.com/marracz/praca-magisterska
5 TIME OF GENERATING
RECOMMENDATIONS FOR
KNN TYPE ALGORITHMS
In this section we focus on the time that the kNN algo-
rithm needs to generate a list of top-10 recommenda-
tions depending on a similarity measure and a library
that were used. We performed our experiments on a
computer with 16 GB of RAM and a processor In-
tel Core i5-7600K 3.80GHz with 4 1-thread cores and
x86 64 architecture. An installed operating system is
Linux 4.13.0-38-generic #43∼16.04.1-Ubuntu.
Experiments were run 20 times for each library
and similarity measure on each dataset. Based on the
results we computed average time of recommenda-
tions generation, its standard deviation (σ) and stan-
dard relative error (SRE). Because of big differences
in an execution time, some outcomes are reported in
seconds and some in minutes.
Tables 6 and 7 present results obtained with
the LensKit library on MovieLens 1M and Book-
Crossing datasets respectively. The time needed for
generating recommendations on the Book-Crossing
dataset is bigger than the one for the MovieLens. It
could be simply justified by the size of datasets.
Table 6: Average times (
¯
t) of generating recommendations
for users from the MovieLens 1M dataset with the LensKit
library.
Similarity
¯
t [s] σ [s] SRE [%]
Pearson 533.264 28.001 1.17
Cosine 523.266 20.993 0.90
KDIR 2019 - 11th International Conference on Knowledge Discovery and Information Retrieval
544
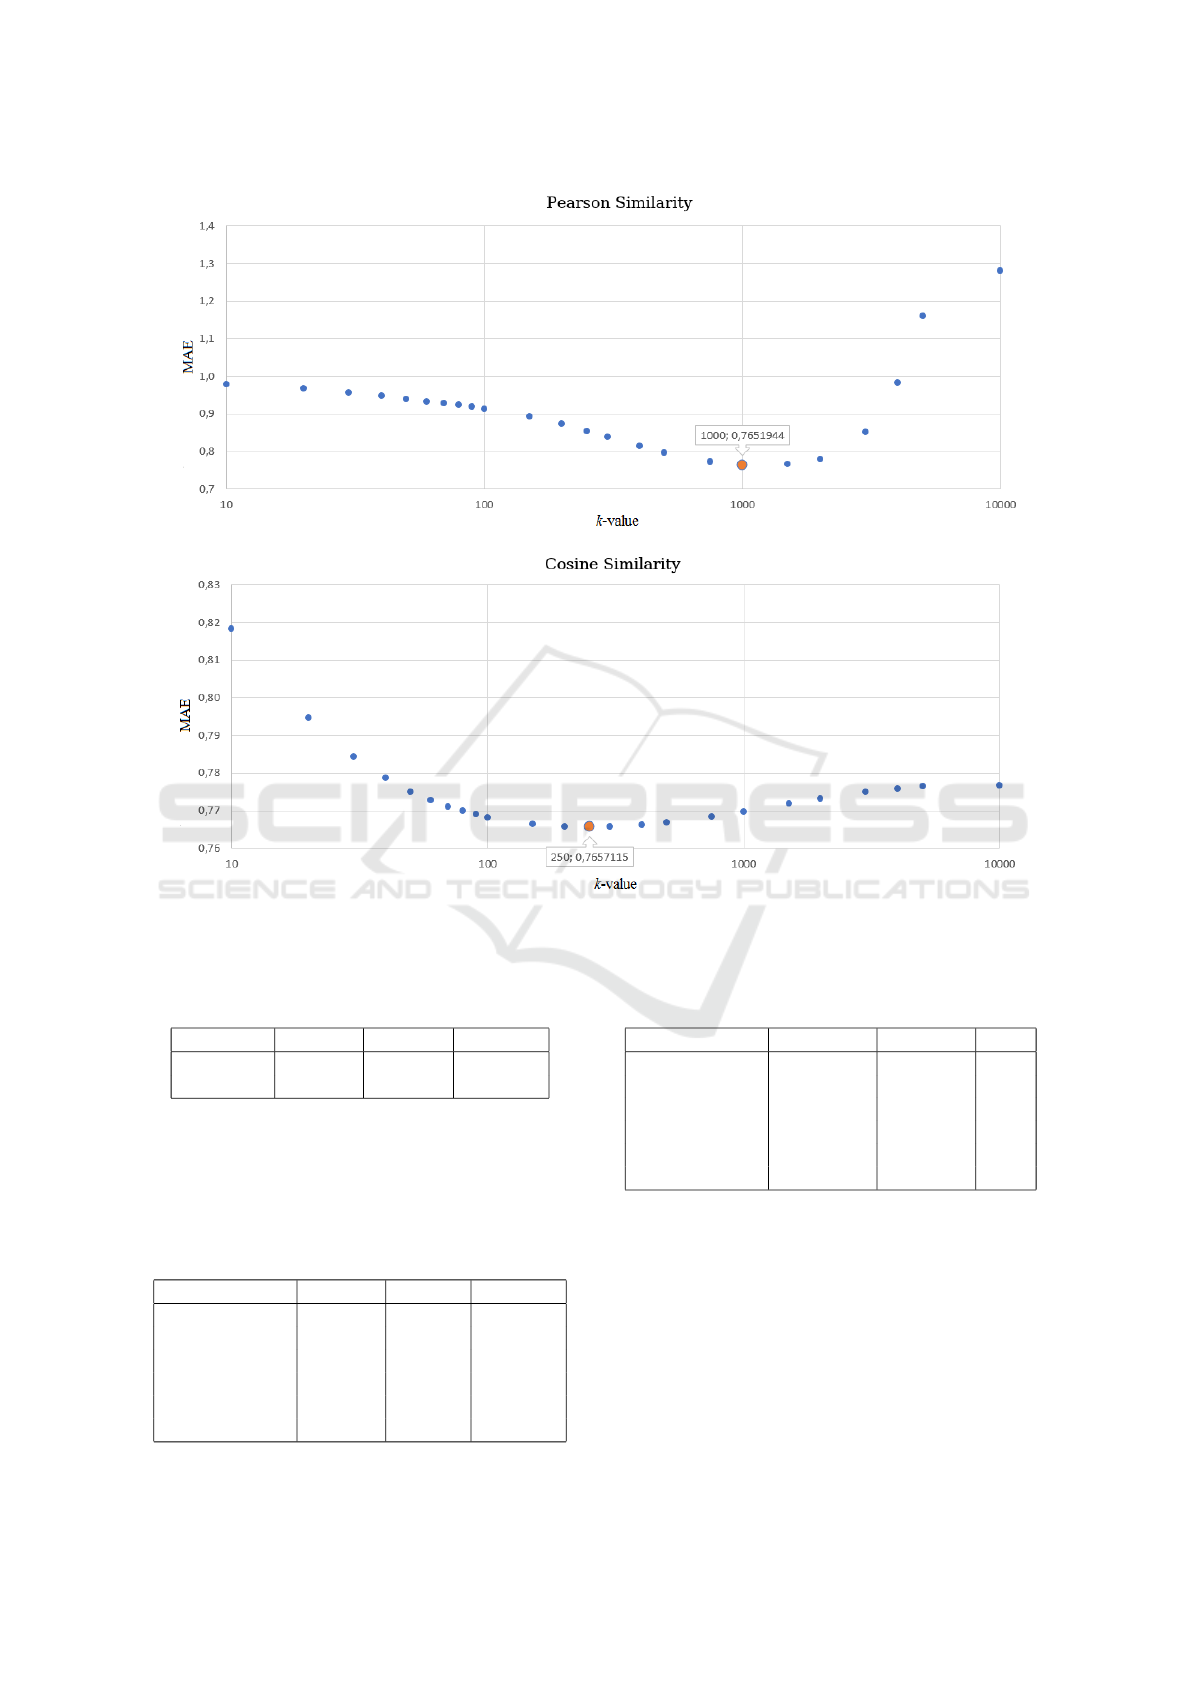
Figure 4: MAE depending on the k value computed for the MovieLens 1M dataset (modified LensKit).
Table 7: Average times (
¯
t) of generating recommendations
for users from the Book-Crossing dataset with the LensKit
library.
Similarity
¯
t [min.] σ [min.] SRE [%]
Pearson 50.359 2.303 1.02
Cosine 100.005 3.982 0.89
Tables 8 and 9 present results obtained with
the Mahout library on MovieLens 1M and Book-
Crossing datasets respectively.
Table 8: Average times (
¯
t) of generating recommendations
for users from the MovieLens 1M dataset with the Mahout
library.
Similarity
¯
t [min] σ [min] SRE [%]
Pearson 29.115 1.953 1.50
Cosine 52.105 5.249 2.25
Euclidean 21.571 1.270 1.32
Log-likelihood 50.321 2.654 1.18
Jaccard 27.891 1.044 0.84
Spearman 398.809 37.934 2.13
Table 9: Average times (
¯
t) of generating recommendations
for users from the Book-Crossing dataset with the Mahout
library.
Similarity
¯
t [s] σ [s] SRE
Pearson 244.964 34.732 2.59
Cosine 381.225 27.869 1.63
Euclidean 253.590 20.187 1.78
Log-likelihood 19450.016 1327.954 1.53
Jaccard 2581.383 166.905 1.45
Spearman 10580.837 730.008 1.54
Here, the situation is opposite as for the LensKit
library. The time of generating recommendations is
higher for the MovieLens 1M dataset. After all ex-
periments we reported in this paper it is not surpris-
ing. The Book-Crossing dataset is bigger than the
MovieLens but it is also very sparse. If we recall
how the Mahout library computes the neighborhood
for the kNN algorithm, we understand that the effec-
tive k value must be much smaller than the neighbor-
hood size parameter value.
Things You Might Not Know about the k-Nearest Neighbors Algorithm
545
Table 10: Final results obtained with the Mahout library on the MovieLens 1M dataset.
Similarity Time [min.] Ranking MAE Ranking Total ranking
Euclidean 21.571 1 0.719 1 2
Pearson 29.115 3 0.760 2 5
Jaccard 27.891 2 0.770 5 7
Cosine 52.105 5 0.761 3 8
Log-likelihood 50.321 4 0.771 6 10
Spearman 398.809 6 0.764 4 10
Table 11: Final results obtained with the Mahout library on the Book-Crossing dataset.
Similarity Time [min.] Ranking MAE Ranking Total ranking
Euclidean 4.226 2 1.315 1 3
Cosine 6.354 3 1.454 3 6
Pearson 4.083 1 2.813 6 7
Jaccard 43.023 4 1.489 4 8
Log-likelihood 324.167 6 1.447 2 8
Spearman 176.347 5 2.211 5 10
Table 12: Final results obtained with LensKit library on MovieLens 1M dataset.
Similarity Time [min.] Ranking MAE Ranking Total ranking
Cosine 8.721 1 0.763 1 2
Pearson 8.888 2 0.771 2 4
Table 13: Final results obtained with LensKit library on Book-Crossing dataset.
Similarity Time [min.] Ranking MAE Ranking Total ranking
Cosine 100.005 2 1.590 1 3
Pearson 50.359 1 6.957 2 3
We can not clearly say which library is better con-
sidering the time that is needed for generating rec-
ommendations. The Mahout library performs faster
than the LensKit on the Book-Crossing dataset, while
for the MovieLens 1M dataset the opposite is true.
The reasons behind this behaviour are the same as
mentioned before: the size of datasets and their spar-
sity. We could conclude that the Mahout library is less
time consuming than the LensKit while run on sparse
dataset, even if this dataset is large.
6 OUTCOMES COMPARISON
Since the main aim of this paper is to compare simi-
larity measures and recommendation libraries, we had
to summarize obtained results. To do so, we prepared
rankings based on two comparison parameters, i.e. an
average time of generating recommendations and a
prediction error MAE. We report them in Tables 10-
13.
The euclidean similarity obtains the best results
with the Mahout library according to the average time
of generating recommendations and the prediction
error MAE. It outperforms other measures on both
datasets irrespectively of the dataset size or sparsity
(see Tables 10 and 11). The worst similarity mea-
sure regarding the considered datasets is the Spear-
man’s rank correlation coefficient. The kNN algo-
rithm with that similarity performs really slow and
achieves big prediction errors, as shown in Tables 10
and 11. It is actually quite interesting, since similar
measure which is Pearson correlation coefficient ob-
tained much better results for both criteria: an execu-
tion time and a prediction error.
It is hard to decide which similarity measure from
those available in the LensKit library performs the
best. According to Table 12, we could say that the
cosine similarity is better than the Pearson correlation
coefficient on the MovieLens 1M dataset. However,
the differences in the average time of generating rec-
ommendation and the prediction error MAE are very
small. If we also consider results reported in Table
13, we should notice that the kNN algorithm with the
cosine similarity achieves good prediction accuracy,
but it performs two times slower than the same algo-
rithm that uses the Pearson correlation coefficient as
a similarity measure.
To conclude, we could say that the LensKit li-
brary generates recommendations on the MovieLens
KDIR 2019 - 11th International Conference on Knowledge Discovery and Information Retrieval
546

1M dataset much faster than the Mahout library while
achieves similar prediction error values. However, the
Mahout library works pretty well on the sparse and
large Book-Crossing dataset.
7 CONCLUSIONS
This paper focuses on one of the most popular recom-
mendation algorithm, i.e. k Nearest Neighbors and
similarity measures that could be used with it. We
showed that evaluation measures for a ranking task,
i.e. precision, recall, F1-score or nDCG are not al-
ways a good choice for choosing the best neighbor-
hood size k. Better results could be obtained with
a simple prediction error like MAE. Simultaneously,
we identified differences in the kNN algorithm imple-
mentation between Mahout and LensKit libraries and
show that it influences the k value, which is much big-
ger for the Mahout library.
We compared different similarity measures ac-
cording to the average time of generating recommen-
dations and the prediction error MAE. The euclidean
similarity obtains the best results with the Mahout li-
brary according to considered criteria. The LensKit
library generates recommendations on the MovieLens
1M dataset much faster than the Mahout library while
achieves similar prediction error values. Neverthe-
less, the Mahout library is less time consuming than
the LensKit while run on sparse dataset, even if this
dataset is large.
REFERENCES
Aggarwal, C. C. (2016). Recommender Systems: The Text-
book. Springer Publishing Company, Incorporated,
1st edition.
Breese, J. S., Heckerman, D., and Kadie, C. (1998). Empir-
ical analysis of predictive algorithms for collaborative
filtering. In Proc. of the 14th Conf. on Uncertainty
in Artificial Intelligence, UAI’98, pages 43–52, San
Francisco, CA, USA. Morgan Kaufmann Publishers
Inc.
Desrosiers, C. and Karypis, G. (2011). A Comprehen-
sive Survey of Neighborhood-based Recommendation
Methods, pages 107–144. Springer US, Boston, MA.
Dunning, T. (1993). Accurate methods for the statistics of
surprise and coincidence. COMPUTATIONAL LIN-
GUISTICS, 19(1):61–74.
Good, N., Schafer, J. B., Konstan, J. A., Borchers, A., Sar-
war, B., Herlocker, J., and Riedl, J. (1999). Combining
collaborative filtering with personal agents for better
recommendations. In Proc. of the 16th National Conf.
on Artificial Intelligence and the 11th Conf. Innova-
tive Appl. of Artificial Intelligence, AAAI ’99/IAAI
’99, pages 439–446, Menlo Park, CA, USA. Ameri-
can Association for Artificial Intelligence.
Harper, F. M. and Konstan, J. A. (2015). The movielens
datasets: History and context. ACM Trans. Interact.
Intell. Syst., 5(4):19:1–19:19.
Herlocker, J., Konstan, J. A., and Riedl, J. (2002). An
empirical analysis of design choices in neighborhood-
based collaborative filtering algorithms. Information
Retrieval, 5(4):287–310.
Herlocker, J. L., Konstan, J. A., Borchers, A., and Riedl,
J. (1999). An algorithmic framework for performing
collaborative filtering. In Proc. of the 22Nd Annual
Int. ACM SIGIR Conf. on Research and Development
in Information Retrieval, SIGIR ’99, pages 230–237,
New York, NY, USA. ACM.
Jaccard, P. (1902). Lois de distribution florale dans la zone
alpine. Bulletin de la Soci
´
et
´
e vaudoise des sciences
naturelles, 38:69–130.
Jaccard, P. (1912). The distribution of flora in the alpine
zone. New Phytologist, 11:37 – 50.
Jannach, D., Zanker, M., Felfernig, A., and Friedrich, G.
(2010). Recommender Systems: An Introduction.
Cambridge University Press, New York, NY, USA, 1st
edition.
Kim, J. K. and Cho, Y. H. (2003). Using web usage min-
ing and svd to improve e-commerce recommendation
quality. In Lee, J. and Barley, M., editors, Intelligent
Agents and Multi-Agent Systems, pages 86–97, Berlin,
Heidelberg. Springer Berlin Heidelberg.
Pearson, K. (1895). Note on regression and inheritance in
the case of two parents. Proc. of the Royal Society of
London, 58:240–242.
Singhal, A. (2001). Modern information retrieval: a brief
overview. Bulletin of the IEEE Computer Society
Technical Committee on Data Engineering, 24(4):35–
42.
Soper, H. E., Young, A. W., Cave, B. M., Lee, A., and
Pearson, K. (1917). On the distribution of the corre-
lation coefficient in small samples. appendix ii to the
papers of ”student” and r. a. fisher. a cooperative study.
Biometrika, 11(4):328–413.
Symeonidis, P., Ntempos, D., and Manolopoulos, Y. (2014).
Recommender Systems for Location-based Social Net-
works.
Ziegler, C.-N., McNee, S. M., Konstan, J. A., and Lausen,
G. (2005). Improving recommendation lists through
topic diversification. In Proc. of the 14th Int. Conf. on
World Wide Web, WWW ’05, pages 22–32, New York,
NY, USA. ACM.
Things You Might Not Know about the k-Nearest Neighbors Algorithm
547
