
How 802.1x Enhances Knowledge Extraction from Large Scale
Campus WiFi Deployment
Mukhammad Andri Setiawan
Department of Informatics, Universitas Islam Indonesia, Yogyakarta, Indonesia
Keywords: WiFi Knowledge Extraction, 802.1x, Campus WiFi.
Abstract: In recent years, the world has witnessed how internet connectivity is exponentially growing in cities around
the world. Universitas Islam Indonesia (UII) as one of biggest private universities in Indonesia is also seeing
the similar trend like the rest of the world. With more than 700 high density access points and roughly 30,000
users, most of internet connectivity in campus is provided from WiFi access. After 802.1x WiFi
authentication-method deployment, UII saw an opportunity to utilise WiFi metadata as a source of business
intelligence. Previously, many business processes or managerial decisions in the university were decided by
some hidden assumptions and approximations. These assumptions and approximations sometimes created
sub-optimal managerial decisions. To improve the strategic decision, we proposed an evidence-based
management based on WiFi data. We utilise this data to extract spatial knowledge, movement behaviour,
seamless attendance record, and traffic analysis for marketing purpose. The results show promising result
where many of university decision is helped by the result given from the knowledge extraction system.
Managements can act faster as information is elicited from tacit knowledge within WiFi metada in real time
and more accurate.
1 INTRODUCTION
In recent years, the world has witnessed how internet
connectivity is exponentially growing in cities around
the world. Indonesia itself doesn’t immune from this
trend. In 2018, almost two third of Indonesia
population are accessing the internet i.e. 171.17
million people (APJII, 2019).
Universitas Islam Indonesia (UII) as one of the
biggest private university in Indonesia has more than
700 high density access points deployed across
campus to cater 30,000 users. According to UII’s
internal survey, WiFi has become default internet
connectivity within the campus compared to 4G/4G+
connectivity. However, this was not the situation
before 2016.
Before 2016, even though university had
hundreds of access points deployed across campus,
approximately only one thousand users on daily basis
who were connected to WiFi networks. Thanks to the
availability of 4G/4G+ connectivity, students and
staffs don’t really need WiFi on their smartphones to
get connectivity within campus. Users might only use
WiFi when they run out of mobile data or if they
would like to access streaming services that consume
so much data such as YouTube, Netflix, etc, or when
they used laptop, as the the only way to connect to
internet on laptop is via WiFi networks.
Before 2016, the traditional way to authenticate
WiFi access in UII was with captive portal, a very
common method to authenticate users before they are
able to access the internet. This captive portal is so
common and happens in many organisations in the
world and also especially in Indonesia. According to
author observation, most of authentication method to
let user to use internet connectivity using WiFi in
hotels, cafes, universities, and other public hotspots
in Indonesia, is with captive portal. Users either have
to agree on somethings then click a button to
authenticate themselves or to insert correct username
and password before internet access is available.
However, since the birth of 4G in Indonesia in late
2013 (Puspitasari and Ishii, 2016), UII saw a
declining trend on users connected to WiFi networks.
Users were able to get fast internet with their 4G
connection and they no longer rely only on WiFi
networks to get internet connectivity. Having to insert
username and password in a captive portal based
system every time they would like to connect to
internet was really cumbersome activity and might
hinder users to access the internet.
Setiawan, M.
How 802.1x Enhances Knowledge Extraction from Large Scale Campus WiFi Deployment.
DOI: 10.5220/0008366403910397
In Proceedings of the 11th International Joint Conference on Knowledge Discovery, Knowledge Engineering and Knowledge Management (IC3K 2019), pages 391-397
ISBN: 978-989-758-382-7
Copyright
c
2019 by SCITEPRESS – Science and Technology Publications, Lda. All rights reserved
391

Most users in Indonesia use internet connectivity
to access instant messaging services such as
WhatsApp or Line and social media such as
Facebook, Twitter, and Instragram (APJII, 2019).
The similar trend is also happened in UII. As the
usage of this kind of internet access doesn’t really
need much data, many times, connecting to WiFi
networks is quite often an optional choice. This was
the cause of the declining trend of WiFi networks
usage from students and staffs in UII pre 2016. At that
time, UII was only able to consume 125 Mbps out of
500 Mbps capacity that it had.
However, things started to change when in mid
2016, UII started to use 802.1x technology as WiFi
authentication method. UII promoted the 802.1x
authentication as a “set and forget” method where
users need to only insert username and password
once, and forget the rest of their day in the university
as they no longer need to insert username and
password every time they would like to connect to the
internet. The authentication part is handled by the
operating system of smartphone where it will re-
authenticate with the RADIUS server every few
minutes behind the scene without user interactions.
Since then, the popularity of WiFi in the UII soars
again, with almost half of UII users connect to the
WiFi during the day.
With ubiquitous WiFi coverage and soaring
number of users, UII started to see an opportunity to
explore how WiFi can give insight from multiple
points of view e.g. campus planner, security personel,
marketing department, human resources department,
etc.
Why collecting this kind of data is important? It’s
not common that managerial decisions in many
organisations, are based on hidden assumptions and
approximations with less data analytics involved
(Barends and Rousseau, 2018), and UII is not
immune to it as well. These assumptions and
approximations sometimes created sub-optimal
managerial decisions.
Many of UII’s strategic decisions to improve
campus life are often based on reactive activities. For
example, in the property and facility department, it
only started to add power sockets at faculty hall when
request is being asked either by staffs or students.
Whenever no requests been made, the property and
facility department will not add the power sockets.
This paper introduces multiple analysis approaches of
WiFi networks usage as an evidence-based
management system to improve the business
practices of the university.
A number of studies have been done on how ones
can extract knowledge from WiFi (Sevtsuk et. al.,
2009; Meneses and Moreira, 2012; Prentow et. al.,
2015). Most of the methods to extract the knowledge
employ ‘sniffing’ method to quantify the information
that will be transformed to knowledge.
However, this kind of approach is exhausting as it
involves huge amount of storage and processing
capability. In deploying access points, UII uses a
wireless controller (WLC) appliance and associate all
access points in the WLC according to physical area
of the building, including their physical coordinates.
Instead of capturing data from access points directly,
we implemented a sytem that captures logs from
WLC and then transform them to meaningful data
that will be used by multiple departments in the
university. A real time system was set up to collect
logs, filter, transform and visualize the data, allowing
UII to view and act upon presented information.
The remainder of this paper is structured as
follows. Section 2 provides background to this work.
Sections 3 explains data collection. Section 4
provides the data processing methods. And lastly, the
last section provides conclusions and future works.
2 BACKGROUND
2.1 802.1x as WiFi Authentication
Method
Campus-wide WiFi service has become a standard to
any major university in Indonesia. UII started to
deploy WiFi as an experimental in 2004 and has
started to deploy campus-wide WiFi networks since
2007. Within years followed, the usage of campus
WiFi increased as more people adopted WiFi-enabled
laptops, and with the rise of smartphone since 2008,
more and more users connected to WiFi.
However, as previously mentioned in the
introduction, with the birth and the rise of 4G since
2013 in Indonesia, UII saw a downward trend since
early 2015 when the adoption of smartphone with 4G
enabled smartphone were widely used in UII. Less
users utilise WiFi network in campus as more users
prefer to use their 4G connectivity.
Due to the lack use of WiFi networks, UII
couldn’t really measure how good or how bad the
campus-wide WiFi deployment was. Also, even
though many literatures presented on how WiFi can
generate knowledge from collected data or metadata,
UII was barely able to collect the data as less people
in the campus were connected to the network. Only
small amount of data can be collected from users, and
it was hard to analyse.
KMIS 2019 - 11th International Conference on Knowledge Management and Information Systems
392

In early 2016, UII started the digital
transformation project to improve digital readiness of
the university. One of the key projects is to improve
network infrastructures with the focus of providing
better internet connectivity through WiFi. It was then
decided that UII would deploy 802.1x authentication
method to authenticate WiFi enabled devices within
campus.
UII has roughly 25,000 students and 5,000
employees and contractors. UII has tens of buildings
at 5 different campus location. In total, UII occupies
for more than 35 hectares area and today has 720
active wireless access points providing full coverage
of indoor WiFi in all academic and residential
buildings.
UII wireless networks currently supports 802.11a,
802.11g, 802.11n, and 802.11ac exclusively. UII
dropped its support to 802.11b in 2017 as it reduced
the quality of WiFi services within campus. The SSID
broadcasted within campus are UIIConnect,
UIIGuest, and eduroam. Out of three, UIIConnect and
eduroam both use 802.1x authentication mode, and
UIIGuest uses captive portal as the authentication
mode.
The purpose of 802.1x wireless authentication is
to accept or reject users who want full access to a
network using 802.1x protocol (Stanley et. al. 2005).
The difference between 802.1x authentication and
captive portal authentication is that, in captive portal,
user will associate first with the network (receiving
resources such as IP addresses) and then authenticate
the connectivity with captive portal landing page.
Unless user is authenticated, user can’t really browse
the internet. Unlike captive portal, 802.1x
authentication method prevents user from associating
with the network unless they were authenticated first.
From security point of view, 802.1x provides
more secure access to the network. Users will not
receive IP address and network connectivity before
getting authenticated. In users’ point of view, the
difference is that, in 802.1x authentication users only
need to insert username once, and the rest is handled
by the device itself, but in captive portal, the process
of authentication is necessary every time users want
to access the internet resources.
All access points are Cisco Aironet which are
controlled by Cisco Wireless Controller (Cisco WLC
5520 series). Each access point serves a distance from
25 to 40 meters and allow high density users from 60-
150 users at a time for each access point. The backend
of the authentication is based on freeRADUS and
Active Directory and tied with our next generation
firewall, Palo Alto 5000 series, to identify type of
applications accessed by users within university
network.
Each classroom is equipped with access points
with few exceptions for small tutorial class room
where one access points are utilised by more than one
classroom. Each access point is named according to
the physical location e.g. building name, floor, and
code number. UII also make note of each access
point’s coordinate for future cross referencing. This
information will enable us to map all access points
and overlay it on top of building diagrams.
Unlike pre-2016 approach where individual
departments are able to offer their own network, all
networks in UII after mid-2016 are all controlled
centrally from university. This strategy is used to
ensure the delivery of exactly the same internet
quality in all area within campus. Before mid-2016,
the internet quality among departments and buildings
were quite differs, some are good, and some others
are not. By centralizing the connectivity, we can
provide bandwidth for each user for up to 150Mbps.
After the implementation of 802.1x authentication
method, the culture of the people changes. They
appreciate the easiness and the security provided by
the WiFi network. No actions required, and they
automatically connected to the network. The
appreciation in return is that more people are
working, studying, and doing many other activities
within campus. The convenience of “set and forget
concept” and also fast internet speed attracts those
users. Users are always connected to WiFi networks
within campus unless they intentionally preferred not
to connect to the network. In return, the number of
users increased tenfold to more than 12,000 users
during its peak time (mid of semester) in 2019
compared to end of 2015 where we only saw 1000
users during the day at peak time.
2.2 Impact of 802.1x WiFi
Authentication Deployment
With the 802.1x deployment, where it always
connected to a highspeed internet access , many users
use internet for more than 5 hours a day which
indicate that these users stayed in campus most of the
time during the day. UII started to see people flocking
into certain areas. Some areas are fuller than others
due to close proximity to e.g. cafes, amenities, health
care, or student centre. More non-laptops users are
connected to the network.
The association of this users with the WiFi
networks provides a lot of opportunity on how exactly
users are behaving in the university. For example, UII
starts to collect data from users movements, as now
How 802.1x Enhances Knowledge Extraction from Large Scale Campus WiFi Deployment
393
the WiFi networks supports roaming technology,
users’ type of access, the utilization of the networks
and also how are access points are being used. To
understand how WiFi is used and how WiFi can
determine the behaviour of users, we created a
knowledge extraction project to quantify user
behaviour and how it affects other things than the
WiFi itself. We elicit the knowledge to help
management to determine important decisions with
regards to equipments investment, social network,
safety issues, and many more.
3 DATA COLLECTION
In UII, more than 85% of internet traffic is coming
from WiFi. With bandwidth consumption reaching
3Gbps during peak hours, and mostly from WiFi, the
metadata gathered can help us to portray internet and
users’ behaviour better. To extract the knowledge
from our WiFi network, the system collects data from
multiple sources. The first source was obtained from
department of property and facilities where UII has
the information about buildings, rooms, and where
the access points are located. This source will be cross
referenced with the location of installed access points.
The second source data log from Cisco WLC that
constantly streams the data to the server and filtered
to reduce the size of the log storage.
The collected data are number of users per access
point per certain time frame (within 15 minutes
interval), and SSID. Table 1 explains log data streams
from Cisco WLC. These records are stored in MySQL
database and managed by IT Services.
Table 1: Data Sources from Cisco WLC.
Item
Remark
Username
Who is the user?
Access
point identifier
Name of access point and its
association with building identifier
(building name, floor of building,
access point code)
Timestamp
User timestamp associated with
access point
The third source of data is extracted from Palo
Alto log. The log gets all information of what kind of
traffics are transmitted from users when they use the
network, for example, access on social-media, SSL-
based website, streaming services, etc. The data is
continuously recorded in an external server to
improve the maintainability and data is preserved for
at least one-year period.
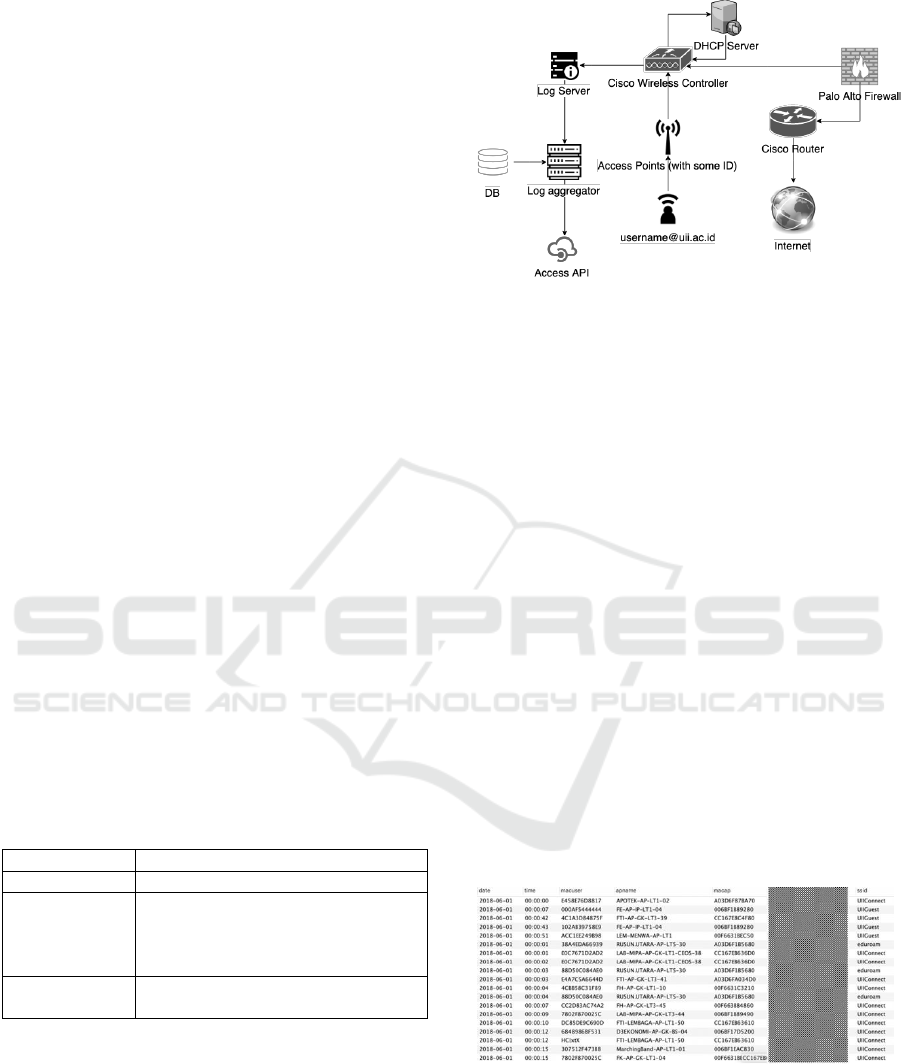
Figure 1: Data Collection Process.
Figure 1 presents the flow of the data collection
process. Any activity triggered by user who is
connected to the network is the stored in log server,
which then aggregate the data. The system provides
interfaces for other analytic tools to utilize the
aggregator server.
All data are in aggregate form to preserve privacy
except for WiFi based attendance system which is
needed by HR Department that cannot by
anonymised.
4 DATA PROCESSING
Real-time WiFi Usage.
Cisco WLC provides a simple dashboard, even
though it shows real time data, but the data itself only
a snapshot of what is currently happening. Cisco
WLC doesn’t provide a time series data, for example
one day data, one-week data, or one-month data.
Our systems collect the log file for 24/7 365 days.
The data stream is refreshed every 15-minutes time
interval.
Figure 2: Access Point filtered raw data.
Figure 2 explains how raw data from Cisco WLC
log is collected and filtered. Our system collects date,
time connected, MAC address of each user,
associated access point, MAC address of each access
point, username, and its SSID.
KMIS 2019 - 11th International Conference on Knowledge Management and Information Systems
394
Subsequently, the system able to visualise the data
to allow UII to view how access points are being
utilised. As an example, using the visualisation, UII
can see where the most populated access point is.
Details are shown in Figure 3.
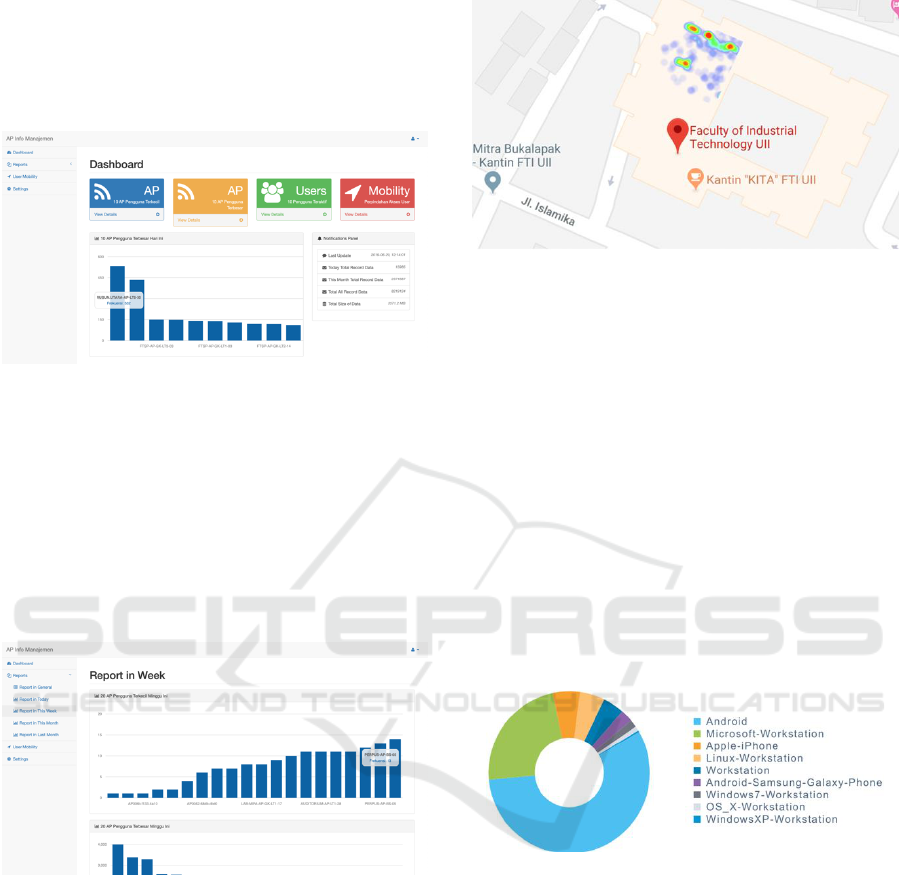
Figure 3: Real-time Wireless Dashboard.
Figure 3 explains most used access points, least
used access points, how does users roam from one
place within university to another place in the
university. One of the decisions made from this
information is that, university is now able to analyse
which access points are actually not being used by
users within university, for investment and energy
reference. The details of the data are presented in
Figure 4.
Figure 4: Weekly Report of Access Point usage.
Figure 4 shows where in campus that no one is
using the access point at all or where access point is
only being utilized be a small number of users. This
data can help IT Services department to evaluate the
ROI of access point. For example, in certain location,
during certain amount of time, no one is actually
using the access point. In the future, IT Services can
decide to dismantle the device, and relocate the access
point to somewhere else where more users are there.
The data presented in those two figures are
displayed as bar chart. From the raw data, our system
can further transform to overlay the number of users
of each access point on a map as presented by Figure
5.
Figure 5: Example of heatmap overlay.
Not only that, the system can also track user
movement to understand life in campus and gain
knowledge of how places in campus related to user.
The system utilised this kind this information later in
the daily attendance dashboard that will be discussed
later.
Using the dashboard, UII can set a time-defined
report (daily, weekly or monthly), and generate
reports. A one-week graph of WiFi can reveal lots of
information e.g. peak times around 11:00 AM and
secondary peak around 1:00 PM. This peak usually
corresponds with students coming to campus before
having class at 12:30 PM (peak) or students who just
finished class before lunch time (secondary peak).
The system also analysed devices that are being used
as means to get the connectivity.
Figure 6: OS Distribution.
Figure 6 explains that most connectivity is coming
from smartphone devices. This back up our argument
that back in the day, pre mid-2016, WiFi is used
mostly by laptop. As 4G already gives user fast
connectivity, only few users were connected to WiFi.
But after UII deployed 802.1x authentication that
provides easy and seamless connectivity while
maintaining secure connectivity, most users switch
their connectivity from 4G to WiFi.
Daily Attendance Dashboard.
As number of WiFi users drastically increase after
802.1x deployment, based on our peak number, UII
start to find a way to utilise the data gathered. It is
How 802.1x Enhances Knowledge Extraction from Large Scale Campus WiFi Deployment
395
found that almost 1 out of 2 users in UII are connected
to WiFi network on weekdays. Nowadays, it is safely
to say that users in UII can’t live and work without
internet (and) or smartphone. With this assumption,
we setup a seamless employee attendance system
with WiFi with the assumption that most users will
bring their smartphone to the office.
Today, to record daily attendance, employees at
UII need to use a finger print system, and need to log
in every morning at 8:00 AM. Using the assumption
that most users always carry their smartphone, we
proposed a system to record the attendance of staffs
in UII. As the system can record when users start to
connect to the network, we utilised that data to record
the attendance whenever staffs started to connect to
the network. System will record a check-in in the
morning and check-out in the late automatically
during prescribed time period.
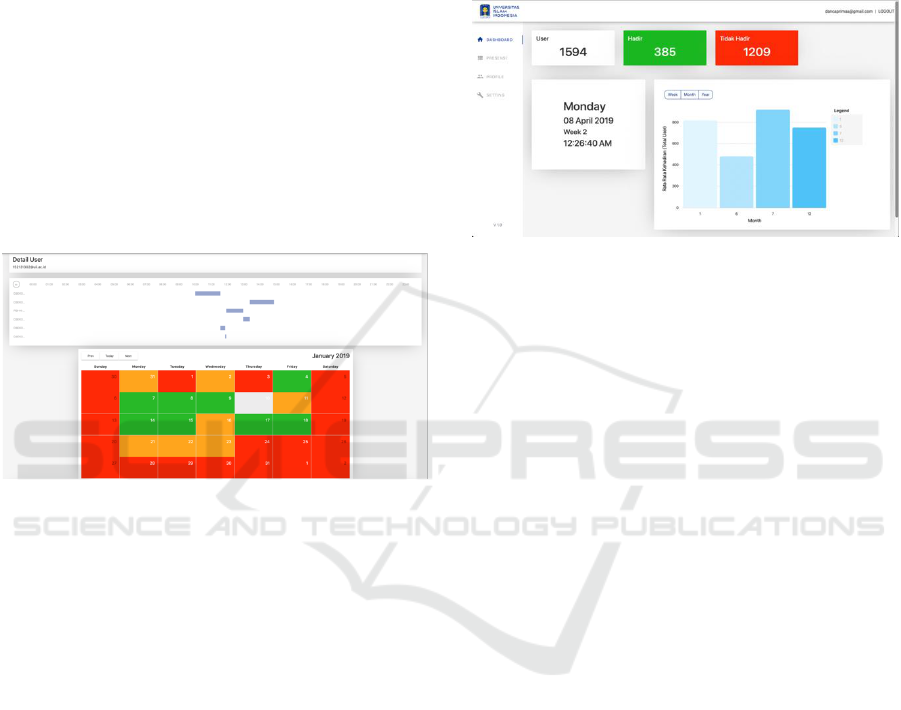
Figure 7: Attendance system record.
Figure 7 shows how the system records users’
attendance. In the figure, a record of certain users
during January 2019 is presented. Any on time
attendance will be indicated by green color, late
attendance with orange color, did not attend the office
with red color. When user clicks on a certain date,
user can also look up the location of where staff is
working. The data also shows user movement, from
which access point to other access point. We plan to
anonymize the data in the future by aggregating the
data and shows how users move from one place to
another within campus, not only looking into staffs
but also students’ movement, or basically every
body’s movement.
Our approach is much simpler than similar studies
(Meneses and Moreira, 2012), as no “math” is
involved to determine indoor position movement but
provides the similar result.
We can enhance heatmap from Figure 5 and add
some animation movement. Using this system, HR
department can see accurately of how staffs’
behaviour in campus, whether they are always on
time, or come late, etc. HR needs this kind of
information to calculate, for example additional
bonus on staff’s payroll as a reward for their on-time
attendance record.
Figure 8 explains how in overall the look of staff
attendance in certain department on certain date. This
information will help management to decide a
decision in improving staffs’ commitment to campus.
Figure 8: Attendance system dashboard.
Traffic Analysis.
Other than to analyse spatial usage by users through
WiFi data, we also utilise our traffic data from WiFi
to gather intelligence on how internet is utilised. The
information extracted from the traffic can help us to
set some strategy in communicating with staffs and
students.
For example, in Figure 9, we presented of how
internet is being used in UII. One of the examples that
is now being used by university is that, since most
students are accessing Instagram on daily basis, the
student centre, marketing department, and many other
bodies in university use Instagram intensively to send
messages to students or potential students. In addition
to traditional CRM methods, university starts to use
intensively social media as message delivery platform
as acceptance ratio is higher compared to traditional
CRM. UII intensively used both Instagram (for
younger generation AKA students) or Facebook
(slightly older generation AKA staffs) to disseminate
messages. The system is able to profile internet access
based on some aggregate form of data to validate the
marketing approach.
In overall, the best thing of extracting knowledge
from WiFi analysis using this approach is that
decisions are made in a quicker way and addressing
any potential problems immediately, as all
information presented is based on real-time data.
KMIS 2019 - 11th International Conference on Knowledge Management and Information Systems
396
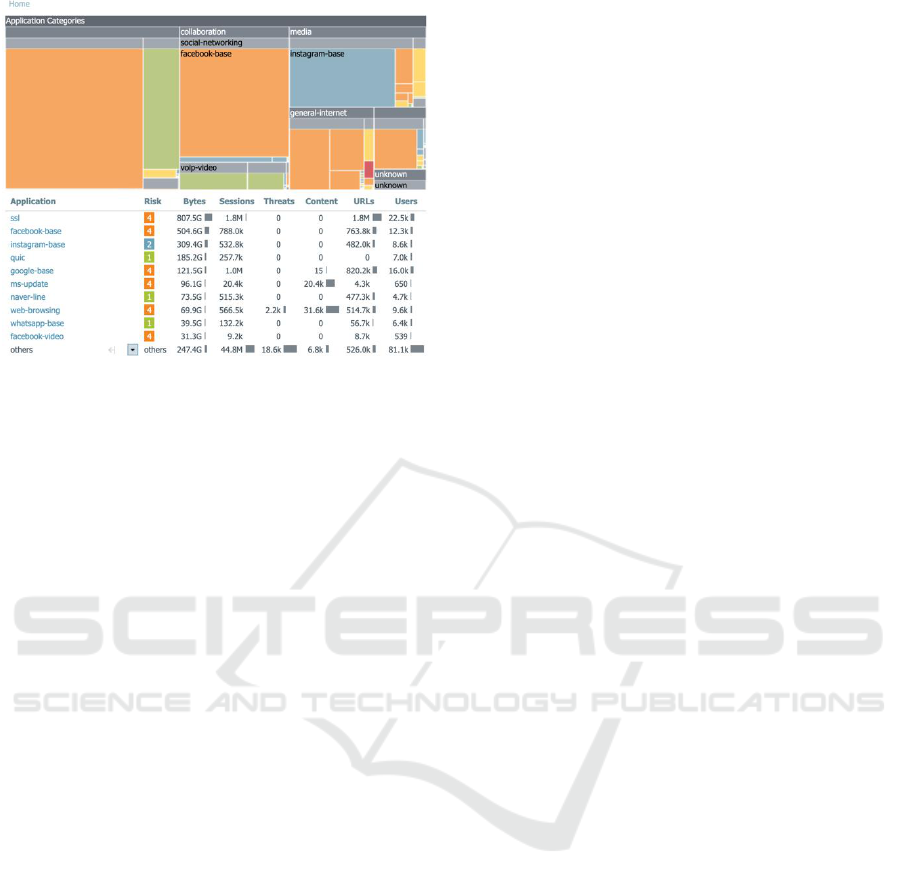
Figure 9: Daily traffic analysis.
5 CONCLUSION AND FUTURE
WORK
802.1x authentication method in our WiFi
infrastructure has proven to increase the number of
internet users in UII almost 10 times than previous
technology. Huge number of users improve our
ability to analyse metadata of internet access such as
access points, kind of devices, timestamps, etc.
Our system processed log data from multiple
sources such as Cisco WLC and Palo Alto Firewall
and convert them to easier form in MySQL database.
Using 802.1x authentication can ensure only
authenticated users are able to connect to the network
infrastructures and clean up our dataset with only
relevant information.
With 100 percent indoor coverage, a lot of stories
can be told, not only a story of user connects to an
access point, but also to learn behaviour of those users
in using WiFi. The 802.1x environment allows us to
study human mobility, accessing behaviour,
relationships between places (and its amenities) and
users. Moreover, the information harnessed from
WiFi activities’ log offer faster decision making and
reflects the reality in the field. In the future we expect
to extend this work by adding more data from more
sources as we plan to deploy lots of IoT sensors
within university.
REFERENCES
APJII, 2019. Penetrasi dan Perilaku Pengguna Internet.
Survey (In Bahasa Indonesia).
Barends, E. and Rousseau, D.M., 2018. Evidence-based
management: How to use evidence to make better
organizational decisions. New York: Kogan Page
Publishers.
Meneses, F. and Moreira, A., 2012. Large scale movement
analysis from WiFi based location data. In 2012
International Conference on Indoor Positioning and
Indoor Navigation (IPIN) (pp. 1-9). IEEE.
Prentow, T.S., Ruiz-Ruiz, A.J., Blunck, H., Stisen, A. and
Kjærgaard, M.B., 2015. Spatio-temporal facility
utilization analysis from exhaustive wifi
monitoring. Pervasive and Mobile Computing, 16,
pp.305-316.
Puspitasari, L. and Ishii, K., 2016. Digital divides and
mobile Internet in Indonesia: Impact of
smartphones. Telematics and Informatics, 33(2),
pp.472-483.
Sevtsuk, A., 2009. Mapping the MIT campus in real time
using WiFi. In Handbook of Research on Urban
Informatics: The Practice and Promise of the Real-
Time City (pp. 326-338). IGI Global.
Stanley, D., Walker, J. and Aboba, B., 2005. Extensible
authentication protocol (EAP) method requirements for
wireless LANs. Request for Comments, 4017.
How 802.1x Enhances Knowledge Extraction from Large Scale Campus WiFi Deployment
397
