
Measures of Effectiveness (MoEs) for MarineNet: A Case Study for a
Smart e-Learning Organization
Ying Zhao
a
, Tony Kendall and Riqui Schwamm
Naval Postgraduate School, Monterey, CA, U.S.A.
Keywords: Measures of Effectiveness, MoEs, Distance Learning, Online Learning, Personalized Learning.
Abstract: MarineNet is an US Marine Corps system that provides one-stop shop and 24/7 access to thousands of online
courses, videos, and educational materials for the whole Marine Corps. The need for the e-learning
organization is to identify the significant capabilities and measures of effectiveness (MoEs) for appropriate e-
learning, and then design and identify how to collect and analyze the big data to achieve an effective
integration of analytic within the MarineNet learning ecosystem. We show this as a use case and the sample
data of the MarineNet CDET website on how to design MoEs that can guide how to collect big data, analyze
and learn from users’ behavior data such as clickstreams to optimize all stakeholders’ interests and results for
a typical e-organization. We also show the processes and deep analytics for exploratory and predictive
analysis. The framework helps e-organization determine where investment is best spent to create the biggest
impact for performance results.
1 INTRODUCTION
MarineNet is an US Marine Corps system that
provides one-stop shop and 24/7 access to thousands
of online courses, videos, and educational materials
for the whole Marine Corps. Many MarineNet
courses meet specific Marine Corps training
requirements and are extensions of resident schools.
Other MarineNet courses are commercially
developed and licensed to support individual skill
development.
We initially investigated the College of Distance
Education and Training (CDET)’s current content
management systems (CMS) and their future needs
(MarineNet, 2018). The first need is to 1) identify the
significant capabilities and measures of effectiveness
(MoEs) for appropriate electronic learning (or
distance/distributed learning); 2) design and identify
how to track this data, and proper analytic techniques
to achieve an effective integration of analytic within
the MarineNet learning ecosystem. The MoEs of the
learning outcomes for MarineNet users reside in the
following four specific areas:
• User Profiles
• Courseware
• Video Services
• Site Collaboration
a
https://orcid.org/0000-0001-8350-4033
Analytic methodologies are needed in the following
areas
• Data Capture
• Dashboard
• Machine Learning
• Predictive analytics
Part of the research questions are listed as following:
1.What constitutes appropriate measures of
effectiveness (MoE) for training and education
distance learning materials in an enterprise level
collaboration learning environment?
2. As a distance learning website with many different
stakeholders (e.g., students, instructors, sponsors, and
developers), what data need to be collected to support
the identified MoEs and support the total value of the
website and business processes?
3. What analytic attributes are essential for CDET to
collect, analyze, and present useful information in a
real-time, intuitive, adjustable, and visual manner
(dashboard) to support the identified MoEs?
4. How can the CMS support a dashboard that allows
for data manipulation, aggregation, and visualization
of identified MoEs?
In this paper, we show how to answer these
research questions. Answers to the research questions
are related to a broader research area such as data-
driven education (Boudett, City, & Murname, 2013;
146
Zhao, Y., Kendall, T. and Schwamm, R.
Measures of Effectiveness (MoEs) for MarineNet: A Case Study for a Smart e-Learning Organization.
DOI: 10.5220/0008480701460156
In Proceedings of the 11th International Joint Conference on Knowledge Discovery, Knowledge Engineering and Knowledge Management (IC3K 2019), pages 146-156
ISBN: 978-989-758-382-7
Copyright
c
2019 by SCITEPRESS – Science and Technology Publications, Lda. All rights reserved

Dunlosky, Marsh, Nathan, & Willingham, 2013)
clickstream analysis (Nasraoui, Cardona, Rojas &
Gonzalez, 2003), effectiveness of online learning or
Massive open online course (MOOC, 2019;Kaplan &
Haenlein, 2016; Balakrishnan, 2013; Hew, 2016),
content management (CMS, 2018), and high level
cognition and learning models (Heer, 2010;
Kirkpatrick, 2019).
2 DESIGN MEASURES OF
EFFECTIVENESS (MoEs) AND
DATA COLLECTION
We see the potential for the MarineNet platform to
deliver personalized learning including micro-
learning--targeted learning either for certain groups, a
specific student, or perhaps identified learning styles
of the student. The technology can support
personalized learning through Experience API (xAPI,
2019)— an e-learning software specification that
allows learning content and learning systems to speak
to each other in a manner that records and tracks all
types of learning experiences. However, the
technology isn’t the full solution because content
must support learning outcomes/objectives and
learning must be assessed to measure and improve the
learning process. This is accomplished first by
designing valid measures of effectiveness (MoEs). To
answer the research questions, we studied current
learning theories and, using existing and available
MarineNet data, designed and selected MoEs to
support those constructs based on accepted
pedagogical theory and practice as well as on our
exploration and evaluation of various deep analytics
models.
Initial research identified 36 MoEs, among them,
content profiles, student profiles, and student learning
behavior are the most important categories as follows:
1 Content Alignment Data.
At the enterprise level, measures of program
effectiveness (to a lesser extent learning) are typically
tracked by completion rate, GPA, and stated course
outcomes or objectives. A CMS must capture this
information first. One consideration is that course
content must align with the course objectives which
could greatly impact the course outcomes (e.g.
completion rate and GPA) and provide students
suitable learning experiences, appropriate
assessment, and measurable progress.
For example, a MoE in this category can compute
the correlation of a course content with its predefined
objectives. However, this may require text analysis
which is out of the initial scope of this project. As an
alternative, an instructor could tag the various content
such as pre-tests, progress tests, and post-tests with
the corresponding learning objectives so that the test
scores, GPA, and complete rates can accurately be
measured if the learning objectives are achieved. If
the instructor is trained to develop
objectives/outcomes for higher levels of learning for
example, critical thinking can be measured using
content tags as well.
2 Student Profile Data.
Measures for learning are often unique to disciplinary
fields or individual cohorts or communities.
Measuring learning must consider the level of
knowledge the student has before the course as
compared to after the course, the delta. This delta
would then measure the transference of new
knowledge not what the student already knows. These
MoEs can be supported by a pre-course survey to
collect demographic, biographical information.
Motivation reflected in the information can
significantly enhance retention and transfer and can
be the unique differences among individual learners.
3 Student Learning Result Data.
A MoE in this category can be the degree to which
targeted outcomes occur as a result of the training, for
example, grades, rubric, rewards, GPA, and the
number of attempts for competency-based quizzes—
i.e. required score of 80%? For example, MarineNet
Distance Education Programs and training courses
typically use 80% to demonstrate the required
knowledge master level.
4 Student Learning Behavioral Data.
Through the MarineNet website, a student can
interact with content, instructors, and peers. These
interactions can be recorded as student learning
behavior data.
The average time and frequency that students
access different content are the important measures of
student learning behavior. A MoE in this category can
be the frequency (or clickstream patterns) for each
type of content accessed.
Since an instructor could tag that content (or not)
that he or she deems that repetitive learning would be
beneficial. MoEs in this category could be aggregated
counts or percentages if tagged by objectives or by
type of content.
Interaction with instructors with guided practice
and timely, formative feedback improves learning
and performance. A MoE in this category can be the
frequency (or clickstream patterns) for such
interactions: the number of times (counts)
instructors/students communicate through email
Measures of Effectiveness (MoEs) for MarineNet: A Case Study for a Smart e-Learning Organization
147
(recorded by the system) or forums and blogs. The
quality of the interaction is also important for
example such as the duration of interaction.
Interaction with other fellow students measures if
active participation of the online communities,
discussion forums, and group studies exist for a
student. Educators indicate there is a strong
correlation between learning results and the level of
interaction among the students.
With the MoEs and corresponding big data from
the website pages (clickstream counts, eyeball time),
we apply different types of analytics such as
exploratory analysis, visualization in a dashboard,
and predictive analytics to discover basic patterns and
trends towards a framework for personalized learning
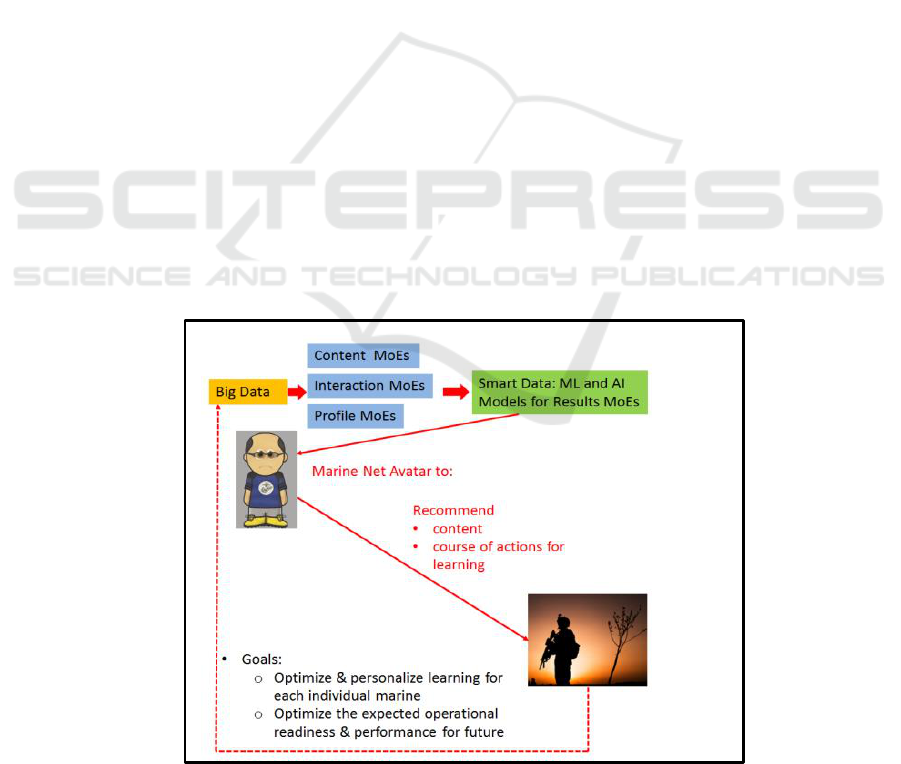
as in Figure 1, showing how big data and analytics
can be used for personalizing MarineNet learning by
recommending personalized materials.
The framework helps CDET determine where
investment is best spent to create the biggest impact
for learning.
3 IDENTIFY TOOLS
In order to perform data analytics and build machine
learning models, we first identified various big data
and deep learning tools such as Tableau, Orange,
Jump, MATLAB, D3, Python SciPy, Plotly, Pandas,
NetworkX, RapidMiner, R, Octave, WeKa, and
Google Analytics. We have tested the tools and
processes using an open source online learning data
set (NIH data set, 2018, consisting of 22 courses, 32K
students and daily summaries of student clicks (about
10 million entries).
Since as an organization providing e-learning for
a government entity such as the Marine Corps,
MarineNet cannot store data in a commercial cloud
and therefore requires secure and cost-effective
analytics for the continuous analysis of the enterprise.
Free and standalone tools are recommended for
research and developers can later integrate the
research results coded in Python into the production
system.
4 DATA EXTRACTION AND
PRE-PROCESSING
Part of the MarineNet currently uses Moodle
(Moodle, 2019) as the distance learning management
system (LMS). We obtained sample data from the
existing Moodle system, which does not contain the
comprehensive required data elements for MoEs,
however, it does include the essential student learning
results (part of student profile data) and learning
behavior, i.e., the interaction with the website
contents for a few courses. We used the data sets to
validate part of the MoEs and analytic process to
integrate deep analytics including exploratory data
analysis, visualization, predictive models with a few
machine learning and artificial intelligence models
Figure 1: MarineNet avatar to leverage big data and machine learning mdoels for personalizing MarineNet materials.
KMIS 2019 - 11th International Conference on Knowledge Management and Information Systems
148
with an MoE focus. Ultimately the results will indicate
to the learner recommended content for an
individualized learning path and a course of action for
mediation of training objective knowledge
discrepancies.
Moodle data from three different classes were used
(BCOC 1-19, LCC 1-19, and LCC 3-18). There were
two types of data highlighting the student learning
behavior (class logs) and student profile (grades) that
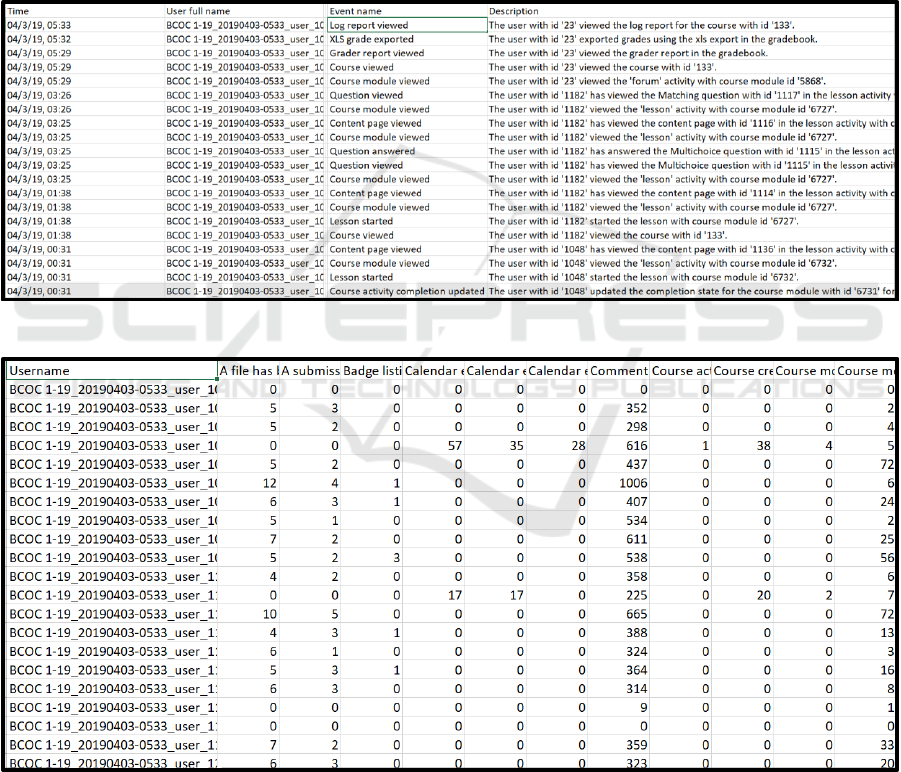
were extracted. Figure 2 shows an example of class
logs and how many events (via different names) were
extracted. Figure 3 shows number of events listing
what method and how frequent each student interacts
with the website. Figure 4 shows the grades data
containing the quiz grades and final grade for the class.
The grade data also included numbers of forums and
discussions participated by students. The class logs and
grades were joined using the user names. The user
names have been anonymized before any data pre-
processing. The final student grade were put into three
bins: ‘3’ represents the grades greater than the mean
plus one standard deviation; ‘2’ represents the grades
between the mean minus one standard deviation and
the one plus one standard deviation; ‘1’ represents the
grades less than the mean minus one standard
deviation; and ‘0’ representing no grade.
Figure 2: An example of class logs, how many events (via different names) were extracted.
Figure 3: Number of events showing the frequency and methods for each student interacted with the website.
Measures of Effectiveness (MoEs) for MarineNet: A Case Study for a Smart e-Learning Organization
149
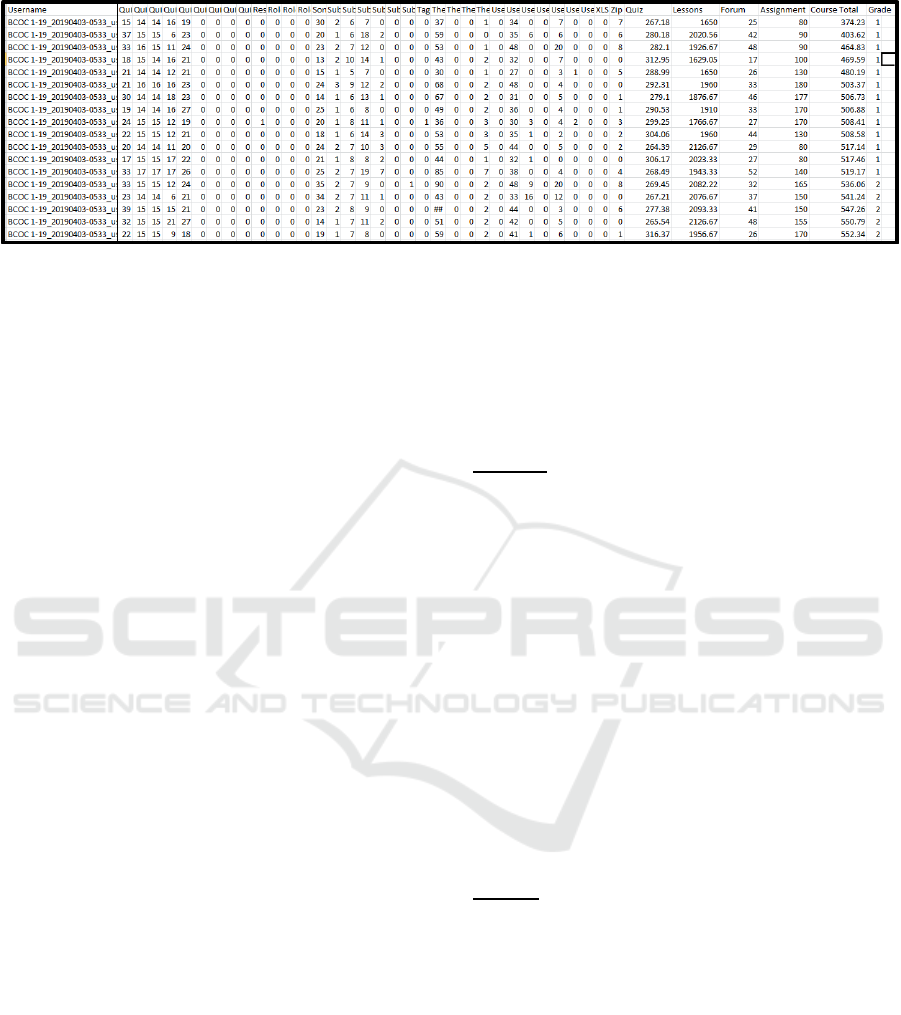
Figure 4: The grades data contain the quiz grades and final grade for the class. They also included numbers of forums and
discussions participated by students. The class logs and grades were joined.
5 EXPLORATORY DATA
ANALYSIS (EDA)
The dataset included three MarineNet courses
consisting of events such as “content page viewed.”
Event logs and grades were merged by user name.
Logs and grades from the three different courses were
used. Number of events per user were listed and basic
relationships between events were compared to
performance (learning) as measured by final grade
which is used as the dependent variable. The candidate
independent attributes (student activity) included:
File uploaded
A submission submitted
Comment created
Content page viewed
Course module viewed
Course viewed
Discussion viewed
Post created
Question answered
Some content posted
status of submission viewed
…
Total about 120 of the different events and aggregated
attributed were extracted from the data.
The four independent variables of student activity
selected for initial EDA: Content page viewed, Course
module viewed; Course viewed, and Discussion
viewed. These four attributes had the highest
coefficients of variation (CV) and were selected
because the higher variability may be the source of
variability with student grades and therefore possibly
correlated. Those other variables with lower CVs and
very narrow dispersion about the mean, with almost
zero SD, would unlikely result in meaningful
correlations with course grades.
The example below uses the data set BCOC1-19
since it has the greatest number of students (84 total
students and 64 had grades in the end of the class).
Tableau.
Tableau is a cloud-based business intelligence for
enterprises (Tableau, 2019), which allows many
different views and visualizations of a data set. We
used a desktop version of Tableau which is limited in
terms of big data size and does not use cloud
computing.
Figure 5 shows a Tableau view of number of
specific events (size of the rectangles and final grades
(color) for each student. Different learning behavior
exhibited here: Student 8826 has a higher grade
(darker) and large number of events of “Course
viewed” and “Course module viewed;” Student 6466
has a lower grade (lighter), however fewer number of
events of “Course viewed” and “Course module
viewed;” Student 2293 has a higher grade (darker),
however, fewer number of “Course viewed.”
Sankey.
Sankey diagrams ( Sankey, 2019) are a specific type of
flow diagram, in which the width of the arrows is
shown proportionally to the flow quantity. This
extends the capability of the Tableau view above to
view and visualize more attributes in the data set.
Figure 6 shows a Sankey plot for a class log. The
attributes from left to right are “user name,”
“component,” “event name,” and “grades”. There are
6.91k events linking “Course module viewed” and “3
(Grade > mean + std).” The graph shows initial
correlation between the higher grade (3) and the
learning behavior “Course module viewed.”
KMIS 2019 - 11th International Conference on Knowledge Management and Information Systems
150
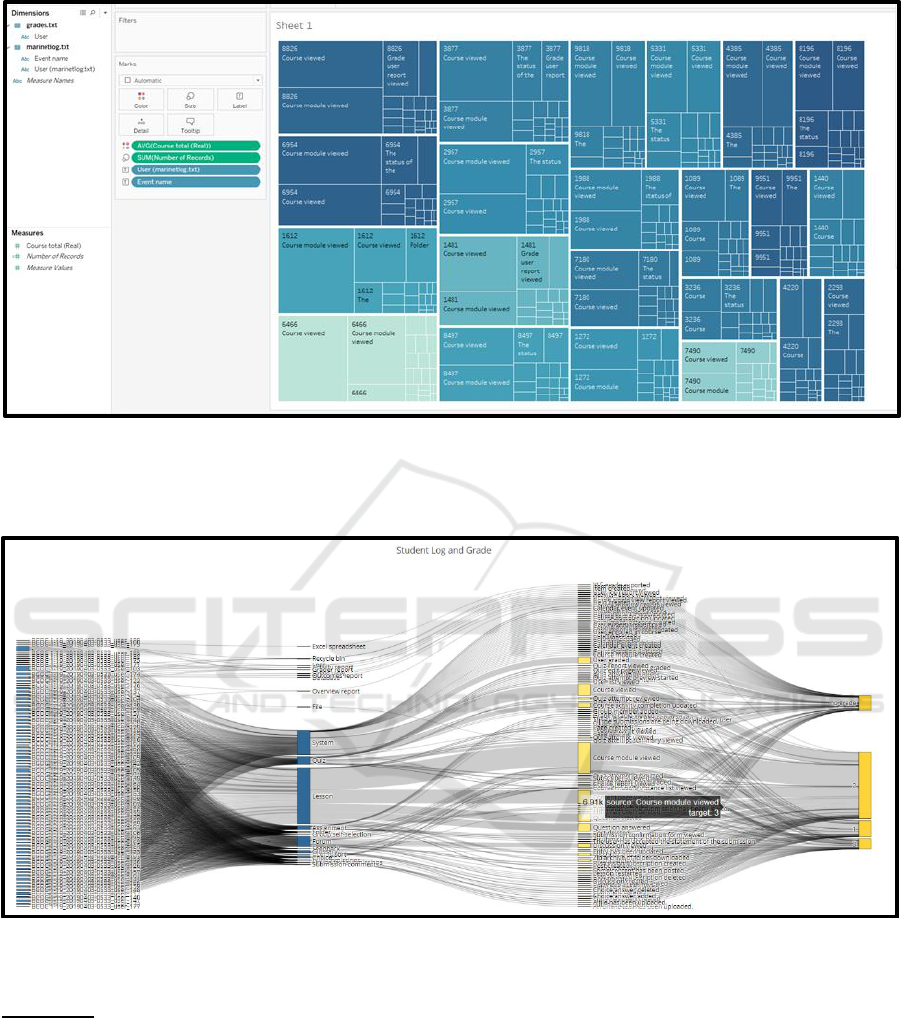
Figure 5: A Tableau view shows number of specific events (size of the rectangles and final grades (color) for each student.
Different learning behavior exhibited: user 8826 has a higher grade (darker) and large number of events of “Course viewed”
and “Course module viewed;” Student 6466 has a lower grade (lighter), however fewer number of events of “Course viewed”
and “Course module viewed;” Student 2293 has a higher grade (darker), however, fewer number of “Course viewed”.
Figure 6: Sankey plot for a class log. The attributes from left to right are “user name,” “component,” “event name,” and
“grades”. There are 6.91k events linking “Course module viewed” and “ 3 (Grade > mean + std)”.
MATLAB.
Exploratory analysis tools included MATLAB
(Matlab, 2019), Excel Analysis ToolPak and the open
source tool, Orange. MatLab includes multiple
regression as well as other powerful exploratory tools
but for an educational analyst the Excel Analysis
ToolPak provides a quick an easy way to initially
explore the data. Multiple regression analysis of the
four attributes with the dependent variable of final
course grade resulted in an R square of .13 and an
adjusted R square of .08. Simple regression shows
“Course Viewed” with the highest R Square of .12
(adjusted R square of .11) which is low but it is
intuitive that one must view the course more than
once to learn the content (at least for some students.
There were only 65 observations and the analysis goal
was to demonstrate how generated data from an LMS
could be initially analyzed. Figure 7 is an Excel
residual plots which shows a probable non-
randomness suggesting a better fit for a non-linear
model.
Measures of Effectiveness (MoEs) for MarineNet: A Case Study for a Smart e-Learning Organization
151
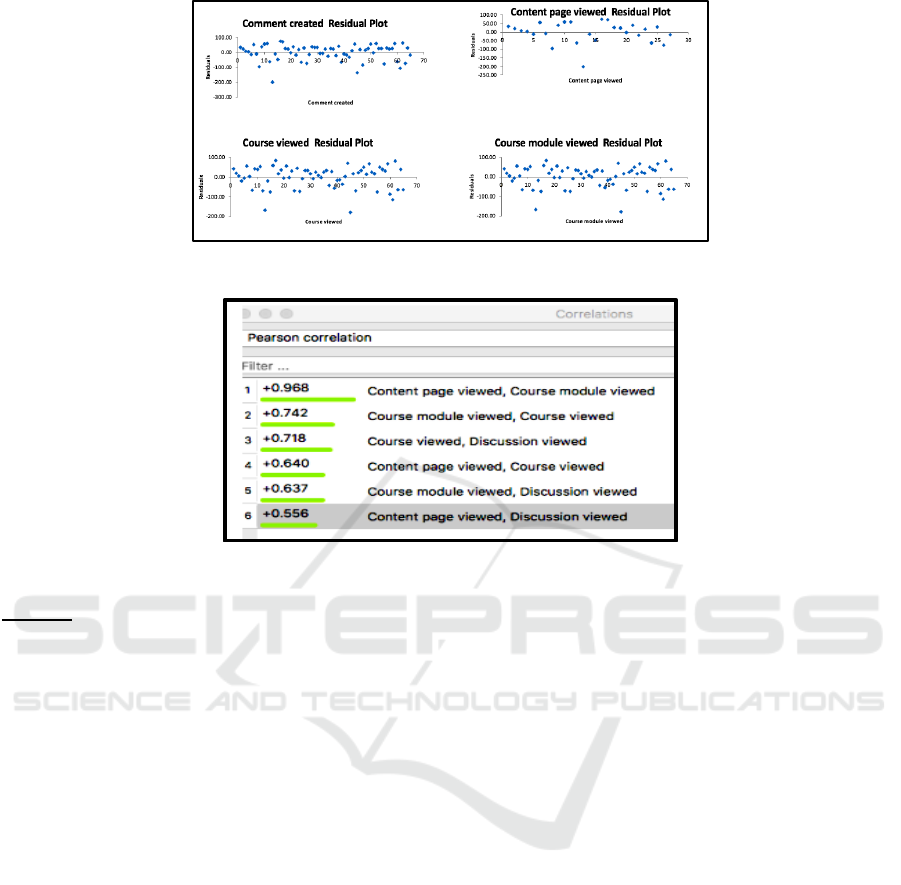
Figure 7: Excel residual plots.
Figure 8: Orange Tool (Pearson correlation).
Orange.
Another exploratory tool used was Orange (Orange,
2019). It features a visual programming front-end for
explorative data analysis and interactive data
visualization. Orange consists of data and pre-
processing tools including importing relational and
unstructured databases, filtering, merging, data
sampler, and discretizing. Visualizing tools include
statistical functions such as box plots, distributions,
scatter plots, and heatmaps. Orange includes
implementations of many advanced statistical and
machine learning algorithms such as linear and
logistic regression, decision trees, naïve Bayes,
random forest, and neural networks. One useful data
tool in Orange is Pearson’s correlation, which quickly
identifies correlations between many attributes.
Figure 8 shows “content page viewed” and “course
module viewed” are almost synonymous and
therefore one or the other could probably not be used
in the analysis.
6 PREDICTIVE MODELS
In order to improve online learning to help students
achieve the best results, we need to predict a student’s
end result (e.g., report) before the end of the class,
identify the reasons for predictions, and then send
early warnings or personalize the content so the
student can improve their behavior or obtain more
personalized content, and therefore receive better
learning results.
Figure 9 shows an Orange workflow for building
typical machine learning models including decision
trees (Weka, 2019), neural networks, kNN, naive
Bayes, and logistic regression for predictive models
of grades. Figure 10 shows the decision tree output
for the total 83 students in BCOC 1-19. The goal of a
predictive model is to predict grade level 1, 2, and 3
based on the students’ interactions/activities (events)
in the website, where 1: total grade scores <520, 2:
640> total grade scores>520; 3: total grade scores
>640. The decision rules for the two green box (i.e.,
the highest grade bin “3”) are as follows
“Number of events for a file uploaded >0”,
“course viewed >395,” “Quiz attempt submitted
>15;”
“Number of events for a file uploaded >0”,
“course viewed >395,” “Quiz attempt submitted
<=15,” “Course viewed <=406.”
KMIS 2019 - 11th International Conference on Knowledge Management and Information Systems
152
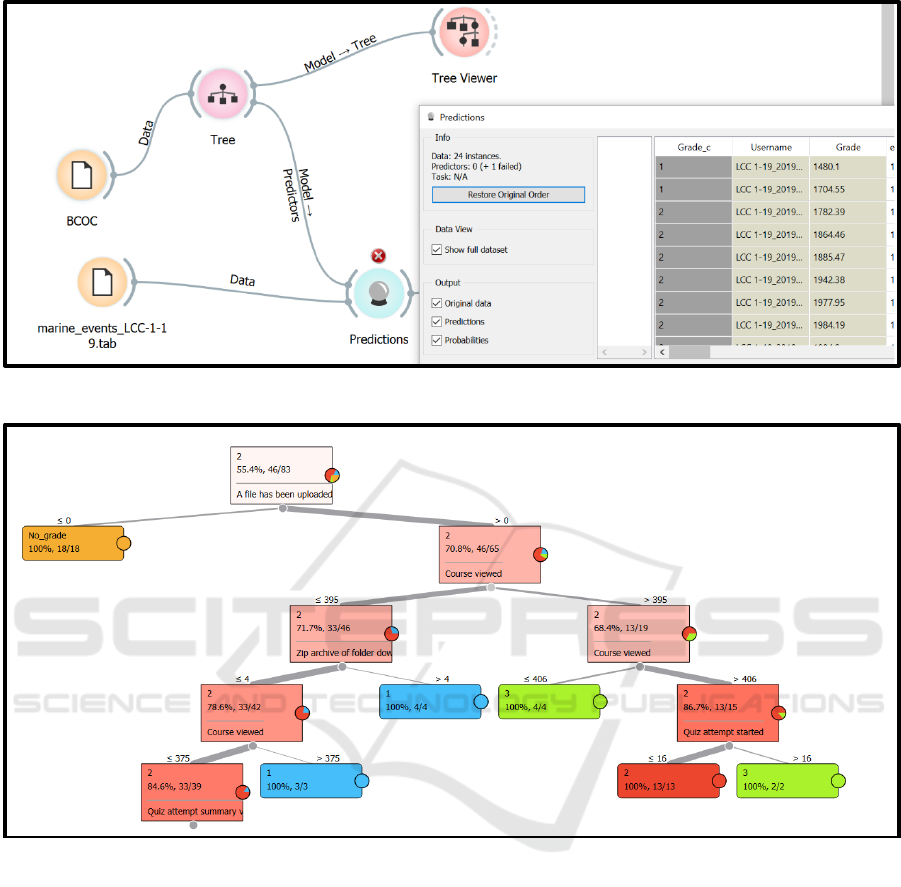
Figure 9: An Orange work flow for building models.
Figure 10: The decision tree output for the students in BCOC 1-19. The decision rules for the two green boxes (i.e., the highest
grade bin “3”) are 1) “Number of events for a file uploaded >0”, “course viewed >395,” and “Quiz attempt submitted >15;”
2) “Number of events for a file uploaded >0”, “course viewed >395,” and “Quiz attempt submitted <=15,” “Course viewed
<=406”.
The decision rules for the two blue boxes (i.e. the
lowest grades bin “1”) are listed as follows:
“Number of events for a file uploaded >0”, “course
viewed <=395,” and “Zip archive of folder
downloaded > 4;”
“Number of events for a file uploaded >0”, “course
viewed <=395,” “Zip archive of folder downloaded
<= 4;” and “Course viewed >=375.”
Note that the rules for the low performers compared to
the high performers seem different in terms of the
attributes “Course viewed” and “Zip archive of folder
downloaded.” The zip archive could be the quiz
materials on which the students tried to work. Proactive
actions may be taken, for example, to remind students
to finish the quizzes on time before they attempted too
many times. The decision trees algorithm
automatically discovered the rules and thresholds used
in the rules.
The question is that if these rules apply to the test
set (e.g., LCC-1-19 in Figure 9). We scored the test set
using the output rules from the training set (i.e.,
BCOC-1-19) to generate predictions of high (3), low
(1), and average grades (2) for the students in this class
and then compared the predictions with the ground
truth.
Measures of Effectiveness (MoEs) for MarineNet: A Case Study for a Smart e-Learning Organization
153
(a) (b)
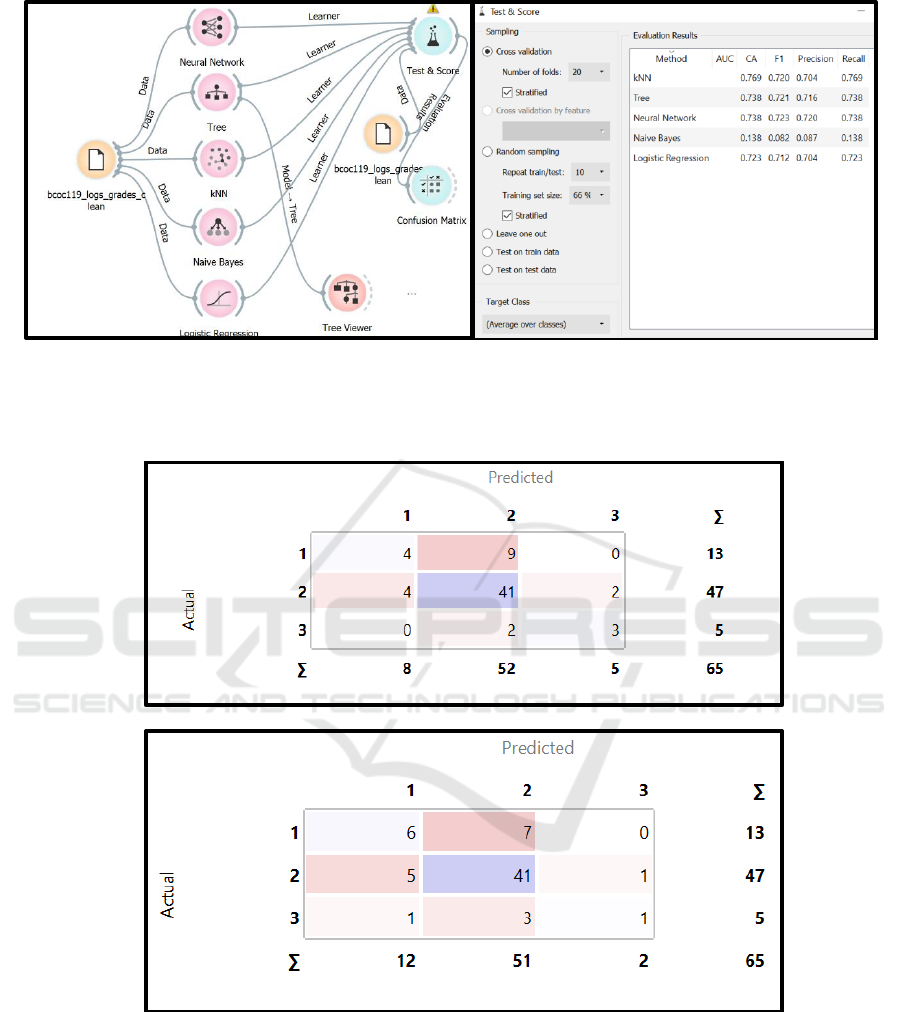
Figure 11: (a) An Orange work flow for building multiple predictive models; (b) Test & Score shows a 20-fold cross-
validation of classification accuracy (CA), precision (% of true positives out of predicted), recall (% of true positives out of
actual).
(a)
(b)
Figure 12: (a) Confusion matrix of the cross-validation model for the decision trees method; (b) Confusion matrix of the
cross-validation model for the neural network method.
Since the number of students in each class is low and
the classes are quite different, a low accuracy of test
prediction is expected. Nevertheless, the machine
learning algorithm can pick up more relevant
attributes.
We examined more predictive methods using
class BCOC-1-19 data and taking out 18 students
without grades which left only 65 students in the data
set. We used the cross-validation method for these
predictive models which splits the data into a given
number of folds (20 folds in this case).
KMIS 2019 - 11th International Conference on Knowledge Management and Information Systems
154
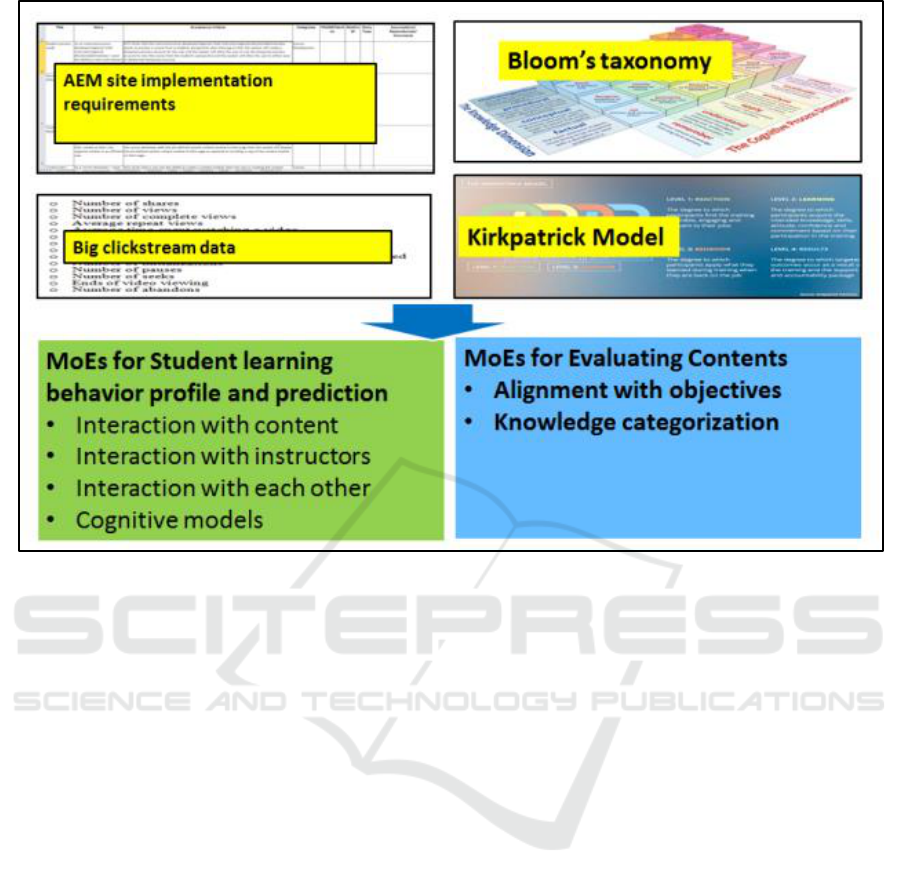
Figure 13: Future work combining contents and learning models.
The algorithm is tested by withholding examples
from one fold at a time; the model is induced from
other folds and examples from the held out fold and
classified. This is repeated for all the folds (Orange,
2019). The fused grades and logs result in 119
variables in total. Figure 11 (a) shows the Orange
workflow for multiple predictive models. Figure 11
(b) shows the a 20-fold cross-validation results of
classification accuracy (CA), precision (% of true
positives out of predicted), recall (% of true positives
out of actuals) for multiple predictive models. The
predictive models have similar results except the
naïve Bayes method. Figure 12 (x,y axes grade level)
shows detailed confusion matrices for the decision
trees (a) and neural networks methods (b). The
decision trees method has a better confusion matrix
(errors confuse “2” with “3” and “1” and “2”) than the
neural networks method only predicted 20% correctly
for the grade level 3.
7 DISCUSSION
We show an example using the sample data of the
MarineNet CDET website on how to design MoEs
that can guide on how to collect big data, analyze
online behavior data such as clickstreams correlated
with performance assessment data, therefore measure
and improve all stakeholders’ interest and results for
an e-learning organization. Many of the analytical
tools indicate that useful analytics and predictive
power can be derived from website logs and
assessment data. To extend the project for a future
prospective for distance e-learning and the MoEs we
develop in this project, one can leverage more
technology to support personalized learning and
collect student learning behavior data such as
Experience API (xAPI, 2019).
More challengingly in terms of measuring how
students learn, we could use more content based
MoEs which are not of the focus of this paper. The
related subset of MoEs were based on accepted
pedagogical theory and practice as well as on our
exploration and evaluation of various learning models
that may measure learning or training or at least
measure some of their correlations. For example, how
to measure Bloom’s Taxonomy (Heer, 2010) related
data, which classifies learning into factual,
conceptual, procedural, and metacognitive and the
subsequent cognitive dimensions required, and it is a
classic learning model and very in use today. MoEs
related to the Kirkpatrick Model (Kirkpatrick, 2019)
focus on the degree the learner interacts with the
content in each of the four levels, for example, 1)
Reaction: degree to which training is favorable,
Measures of Effectiveness (MoEs) for MarineNet: A Case Study for a Smart e-Learning Organization
155

engaging and relevant to their jobs; 2) Learning:
degree to which participants acquire intended
knowledge, skills, attitude, confidence and
commitment based on their participation in the
training; 3) Behavior: degree to which participants
apply what they learned during training; 4) Results:
degree to which targeted outcomes occur as a result
of the training. Figure 11 shows a holistic view of
potential future work of the integration of the
concepts and models for total personalized smart
online learning leveraging big data and machine
learning.
8 CONCLUSION
We show a use case using the sample data of the
MarineNet CDET website on how to design MoEs
that can guide how to collect big data, analyze
website behavior data such as clickstreams with
performance assessment data, therefore measure all
stakeholders’ interests and results for an e-learning
organization. We also show the processes and tools
for exploratory and predictive analysis.
ACKNOWLEDGEMENTS
Thanks to the support of the Naval Research Program
at the Naval Postgraduate School and the College of
Distance Education and Training (CDET) at the US
Marine Corps University (USMCU). The views and
conclusions contained in this document are those of
the authors and should not be interpreted as
representing the official policies, either expressed or
implied of the U.S. Government.
REFERENCES
Balakrishnan, G., 2013. Predicting Student Retention in
Massive Open Online Courses using Hidden Markov
Models, EECS Department Technical Report No.
UCB/EECS-2013-109, University of California,
Berkeley. Retrieved from http://www2.eecs.berkeley.
edu/Pubs/TechRpts/2013/EECS-2013-109.pdf
Boudett, K. P., City, E. A., and Murname, R. J., 2013. Data
Wise: A Step-by-Step Guide to Using Assessment
Results to Improve Teaching and Learning. Cambridge,
MA: Harvard Education Press.
CMS, 2019. Content Management System.
https://www.adobe.com/experience-cloud/topics/
content-management-system.html
Dunlosky, J., Rawson, K. A., Marsh, E. J., Nathan, M. J., &
Willingham, D. T. , 2013. Improving students' learning
with effective learning techniques promising directions
from cognitive and educational psychology.
Psychological Science in the Public Interest, 14(1), 4-
58.
Heer, R., 2010. Bloom's Taxonomy. IA: Iowa State
University. Retrieved from http://www.celt.
iastate.edu/wp-ontent/uploads/2015/09/RevisedBlooms
Handout-1.pdf
Hew, K. F., 2016. Promoting engagement in online courses:
What strategies can we learn from three highly rated
MOOCS. British Journal of Educational Technology.
47 (2): 320-341.
Kaplan, A. M., Haenlein, M., 2016. Higher education and
the digital revolution: About MOOCs, SPOCs, social
media, and the Cookie Monster. Business Horizons. 59
(4): 441-50.
Kirkpatrick 2019. Kirkpatrick Model. Retried from
https://www.kirkpatrickpartners.com/Our-
Philosophy/The-Kirkpatrick-Model
MarineNet, 2018. Pilot project capability requirement
document for AEM.
Matlab, 2019. Retrieved from http://www.matlab.com
MOOC, 2019. https://en.wikipedia.org/wiki/Massive_
open_online_course.
Moodle, 2019. Retrieved from https://moodle.org/
Nasraoui, O., Cardona, C., Rojas, C., & Gonzalez, F., 2003.
Mining Evolving User Profiles in NoisyWeb
Clickstream Data with a Scalable Immune System
Clustering Algorithm. Proc. of KDD Workshop on Web
mining as a Premise.
NIH data set, 2018. Retrieved from
https://analyse.kmi.open.ac.uk/open_dataset
Orange, 2019. Retrieved from https://orange.biolab.si/
Sankey, 2019. Sankey flow charts. Retrieved from
https://en.wikipedia.org/wiki/Sankey_diagram
Tableau, 2019. Retrieved from https://www.tableau.com/
Weka, 2019. Retrieved from https://en.wikipedia.org/wiki/
Weka_(machine_learning)
xAPI, 2019. Experience API. Retrieved from:
https://www.adlnet.gov/research/performance-tracking-
analysis/experience-api/xapi-architecture-overview/
KMIS 2019 - 11th International Conference on Knowledge Management and Information Systems
156
