
Ambulance Car Logistics using Shortest Path Achievement Tree in
Plant Simulation
Jolana Sebestyénová
a
and Peter Kurdel
b
Institute of Informatics, Slovak Academy of Sciences, Bratislava, Slovakia
Keywords: Discrete Event Systems, Object Oriented Modelling, Simulation, Logistics, Graph, Shortest Path,
Achievement Tree, Tecnomatix Plant Simulation, Resource Statistics, In Memory Database, SQlite, Data
Retrieval.
Abstract: Tecnomatix Plant Simulation software based on discrete-event modelling and simulation provides all the
necessary equipment to operational modelling of real-world systems. Models created in it can be useful in
different ways. Running long time simulation of some model, the user can retrieve a sufficiently big amount
of information and data, in adequate degree similar to real world data because of wide range possibilities to
use random parameters in the model. These data retrieved from simulation can be further used to analysis and
test of new design, control, or decision strategies. Model of a simple tracks network with an ambulance car
serving patients from houses along the tracks is used as a test case. The motion of the car is controlled using
a shortest path achievement tree, prepared in an Excel file and read into the Plant Simulation model. Part of
the data received from the model simulation is stored in SQLite in-memory database to be exported for further
analysis.
1 INTRODUCTION
Discrete event modelling and simulation of dynamic
systems present a wide range of research effort for
many years. For example, heuristic scheduling of a
production process using a statecharts model was
described in (Kurdel & Sebestyénová, 2011).
Creation of a distributed flexible manufacturing
system’s model with logistics requires data exchange
and intensive communication between distributed
places. In earlier works of the authors, workflow for
a multi-agent system with voice user interfaces in a
changing environment was described in
(Sebestyénová & Kurdel, 2014a) and multimodal
aspects of communication was given in
(Sebestyénová & Kurdel, 2014b).
All the necessary equipment to operational
modelling of real-world systems is prepared in Plant
Simulation software based on discrete-event
modelling and simulation (Bangsow, 2015). Dealing
with just substantial aspects, it can simulate long-
lasting manufacturing plant operation in seconds.
a
https://orcid.org/0000-0003-4677-9972
b
https://orcid.org/0000-0002-8080-2411
To reflect the natural hierarchy of systems to be
simulated requires a well-structured simulation
models. To this purpose, Plant Simulation offers a
basic object Frame which can be put into the
RootFrame (the main object of the model) or in
another Frame. In this way, complex tasks can be
broken down into manageable parts, using object-
oriented modular design and programming.
Smith (2013) presents a review on the usage of
simulation for construction and functioning of
manufacturing systems. Blaga et al. (2018) compares
modelling based on Petri nets to Tecnomatix Plant
Simulation for management of manufacturing
process. Vavrík, Gregor & Grznár (2017) described
Computer simulation as an instrument for the
optimisation of logistics using automated guided
vehicles.
In the paper, an extension of the authors’ work
(Sebestyénová & Kurdel, 2019) is presented. Model
of a simple tracks network with an ambulance car
serving patients from houses along the tracks,
partially inspired by (Mes, 2017, pp. 91-92) will be
used as a test case. Part of the data received from the
model simulation will be stored in SQLite in-memory
214
Sebestyénová, J. and Kurdel, P.
Ambulance Car Logistics using Shortest Path Achievement Tree in Plant Simulation.
DOI: 10.5220/0008493402140220
In Proceedings of the 3rd International Conference on Computer-Human Interaction Research and Applications (CHIRA 2019), pages 214-220
ISBN: 978-989-758-376-6
Copyright
c
2019 by SCITEPRESS – Science and Technology Publications, Lda. All rights reserved
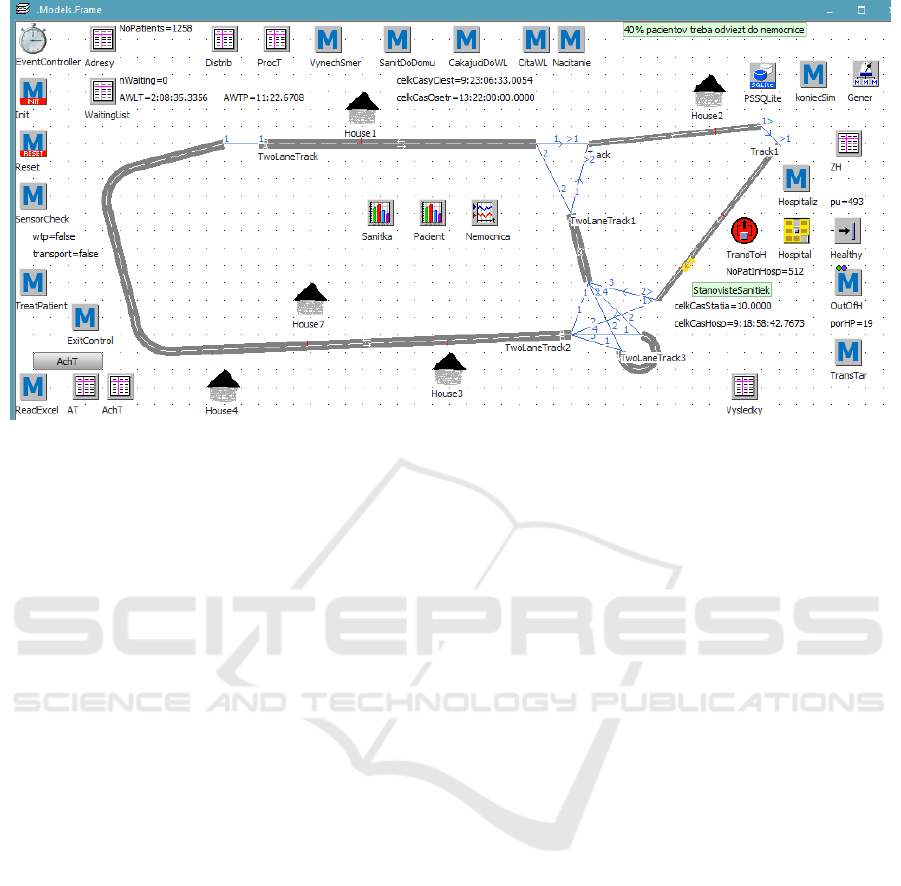
Figure 1: Model’s main frame in Plant Simulation with 2 one-way tracks and 4 two-lane tracks at end of simulation.
database to be exported for further analysis, which
can be done in the model as well as outside of it.
2 MODEL OF A TRACKS
NETWORK WITH AN
AMBULANCE CAR
The tracks network considered in the paper consists
of 4 two-lane tracks where cars can move in two
directions and 2 one-way tracks with two crossroads.
Connectors between two-lane tracks work for both
traffic directions, but connectors connecting one-lane
tracks distinguish the traffic directions. The
TwoLaneTrack3 is only used to change the moving
direction of the car, if needed. Along the routes there
are 5 houses where patients turn up at some random
time and one hospital where some of the patients need
to be transported after a short treatment at home.
In commercial applications, animation and
visualisation of results are often used to
communication with the user. In research works, it is
adequate to concentrate on functional aspects and use
animation only during debugging. This enables to run
long time simulation retrieving sufficiently big
amount of data. The Interpreter executes the source
code written in programming language SimTalk
entered into any Method object. SimTalk 2.0 is used
in the model. In the proposed model’s main frame, the
most important objects are the routes of a tracks
network, as can be seen in Fig. 1.
The model contains one ambulance car (AC)
derived from a Transporter type mobile unit from the
Plant Simulation Class library (corresponding class is
named CarGP, meaning a general practitioner in the
car). It is created by Init method, at the start of the
simulation. The AC waits at parking place near the
hospital until an order appears, and it also moves to
this place if no more patients are waiting for
treatment.
The parking place, the hospital, as well as all of
the houses have assigned its position sensor on the
track which indicates a stop position of the car serving
this place. In case of two-lane tracks, the sensor is
assigned only to one half of the track with proper
traffic direction. Each time the car approaches the
sensor, SensorCheck method starts to control further
simulation run.
2.1 Shortest Path Achievement Tree
Shortest path problem between vertices in the
weighted directed graph, shortest path tree,
bidirectional search etc. are widely described in the
literature (Wikipedia, 2009). Dijkstra's Shortest Path
algorithm enables to find the shortest paths between
nodes in a graph, which may a.o. stand for road
network. It was published in the year 1959. The
problem is defined for simple graphs without cycles,
negative weights, multigraphs, or loops. For
problems similar to the described one, the negative
weights are not needed, but the other properties will
occur with high probability. The structure of Bellman
Ford's algorithm and Dijkstra's algorithm is very
Ambulance Car Logistics using Shortest Path Achievement Tree in Plant Simulation
215

Figure 2: Two graphs created according to the model of the
tracks network.
similar. While Dijkstra takes into account only the
immediate neighbours of a node (breadth first),
Bellman looks into each edge in every iteration (depth
first search). Many different, enriched algorithms are
available for graphs with widened properties.
Given a graph G = (V, E) and a source vertex u,
the shortest distance from u to every other vertex v in
V could be found e.g. by Dijkstra’s algorithm, but in
the test case some tracks need to enable move in both
traffic directions. For this reason, creation of the
graph from the model’s routes network must take it
into consideration, as can be seen in the top part of
Fig. 2. The nodes consist of the position sensors near
the houses, the parking place and the hospital, and of
connectors of the routes. The edges represent the
routes with directions. The routes length are specified
during creation of the model. Positions of the houses
on the routes are specified in the TableFile Adresy,
which enables to compute the routes parts lengths.
One can prepare the shortest path achievement
tree from any place on the route specified by a sensor
to any other place. Another possibility (as can be seen
in the bottom part of Fig. 2) is to create the graph in
which nodes represent the tracks. The paper suggests
that the shortest path achievement tree (based on the
route length) received from the graph is prepared in
an Excel file. The creation of the tree is out of the
scope of the paper, but e.g. Kurdel & Sebestyénová
(2013) described routing optimization for ATM cash
replenishment for ATM‘s places received from
Google maps of town Bratislava and its surroundings.
To illustrate the achievement tree of the presented
model, a part of it is given in the top part of Fig. 3,
where rows specify starting tracks and columns
specify destination tracks.
Using a method ReadExcel, this data is imported
into Plant Simulation table and lists, as can be seen in
the bottom part of Fig. 3. The table at the left contains
lists representing branches of the tree, and an example
list at the right contains tracks names and traffic
Figure 3: Shortest path achievement tree: at the top, in Excel file (as input file to the model); at the bottom, after being read
into Plant Simulation table and lists (list23 is one branch of the tree - from TwoLaneTrack.B to Track1).
Two loops (in light gray)
TwoLaneTrack3 with its
traffic directions are not
necessary in top graph.
The node
representing the
TwoLaneTrack3.B
(TLT3.B) is not
necessary, as this
direction of the
track is not used.
…
CHIRA 2019 - 3rd International Conference on Computer-Human Interaction Research and Applications
216
directions (A/B). These lists will be used to control
the car driving to its destination (which may be one
of the houses / the hospital / the parking place) during
the simulation.
3 PATIENTS REQUIREMENTS,
TREATMENT AND
HOSPITALISATION
The Patient class is derived from Entity type mobile
unit (MU) from the Class library. The house instances
are derived from the House class created in
UserObjects category in Plant Simulation Class
library. As both classes and instances are named
objects in Plant Simulation software, the users must
take care to properly distinguish between them.
The model works with two sub-classes of patients.
While some of them can be served by care at home
(sub-class Pat), another part needs to be transported
to the hospital, after a short treatment at home (sub-
class PatHosp). Distribution of instances of the sub-
classes is specified in Distrib TableFile of the main
frame of the model; in the simulated case about 40%
of the patients need transport to the hospital.
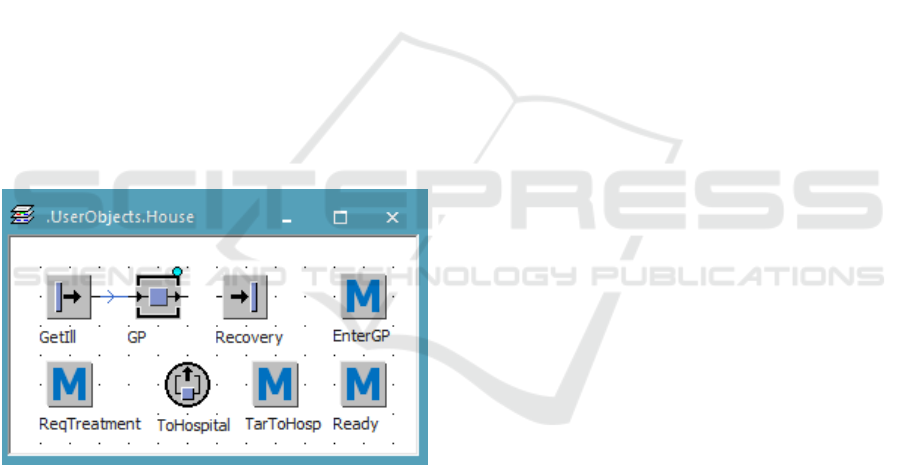
Figure 4: Sub-frame of one of the houses where patients
emerge (the class of the House, from which 5 instances will
be derived).
Fig. 4 presents a sub-frame of one of the houses
where sometimes someone gets ill, which is
represented by a Source type icon called GetIll. If
someone gets ill in the house, ReqTreatmet method
starts the AC moving to the house if the AC is free. If
the AC is not free, e.g. moving to another patient or
waiting to the end of the treatment provided to the
patient by the GP, etc., the new requirement data is
stored in a WaitingList TableFile. The next patient to
be served will be read from the WaitingList file in
FIFO order, after finishing the previous patient
treatment, or after the transport of the patient to the
hospital.
When the AC stops at the house, the patient in the
house frame moves from the source to a station
entitled GP, which represents the general
practitioner‘s work in the house. If the treatment at
home is sufficient, after some random treatment time
the patient (Pat) moves to a drain icon entitled
Recovery and ceases to exist in the model. If the
patient needs further hospitalization, the AC will
transport him/her (PatHosp) to the hospital. To
accomplish this, the patient moves to a
TransferStation entitled ToHospital after a short
random treatment time. The TransferStation
ToHospital enables boarding the patient on the AC.
In both cases, the movement of the patient out of the
GP station starts a Ready method in the House frame.
The method writes some statistics data into an in-
memory database (will be described latter).
Another TransferStation entitled TransToH in the
model’s main frame enables transport of the patient
from the AC to the hospital. The hospital is created as
a Store type object from the Plant Simulation Class
library. A random hospitalization time is specified for
arriving patient. After this time, the patient moves
from the hospital to a Drain type object entitled
Healthy by means of the method OutOfH in the
model’s main frame and ceases to exist in the model.
This method also writes some data into the database.
4 DATABASE
Tecnomatix Plant Simulation object ODBC enables
to import data from an ODBC database on a server,
e.g. to read parameters of the model to be created and
re-export the changed data back into the database.
Data exchange with an SQL database is also enabled
using SQLite object from the Class library. The object
SQLite uses a database which can be stored in a file
on the local hard disc, but also in main memory. In
that case, a string “:in memory:“ is specified instead
of the file pathname. In Plant Simulation software,
writing/reading data into/from in-memory SQLite
database is faster than writing/reading them into/from
the TableFile object.
As previously mentioned, some of the methods
write data into the SQLite database. The presented
use-case works with only one DB table entitled
Pacienti with 4 columns: MUType, MUName,
StartTime, and EndTime. The first two are texts, the
last two are reals. MUType is a primary key.
After the elapse of 1 month simulation time
(specified in EventController as 31:00:00:00
Ambulance Car Logistics using Shortest Path Achievement Tree in Plant Simulation
217
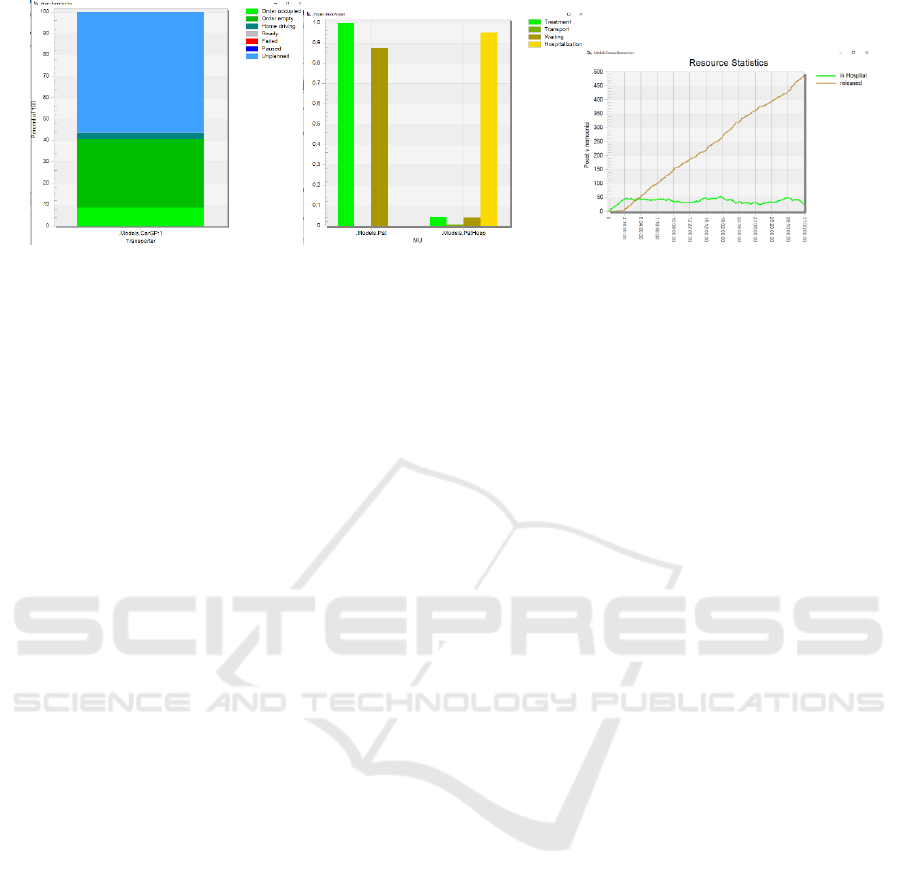
Figure 5: The ambulance car statistics (left), the patients statistics (centre), the hospital statistics (right).
[dd:hh:mm:ss]), a method koniecSim reads the data
from the DB into a TableFile Vysl and subsequently
writes the data into an Excel file for further analysis.
The next lines present a part from the code of the
method reading data from SQLite:
var sql,sql2:string
var r:integer
sql := "CREATE TABLE IF NOT EXISTS
Pacienti (MUType TEXT PRIMARY KEY,
MUName TEXT, StartTime REAL, EndTime
REAL)"
sql2 := "SELECT * FROM Pacienti"
PSSQLite.open
PSSQLite.exec(sql)
PSSQLite.prepare(sql2)
r := 1
while PSSQLite.step
Vysl[1,r]:=PSSQLite.getColumnString(0)
Vysl[2,r]:=PSSQLite.getColumnString(1)
Vysl[3,r] := PSSQLite.getColumnReal(2)
Vysl[4,r] := PSSQLite.getColumnReal(3)
r += 1
end
PSSQLite.close
Vysl.writeExcelFile("E:\PlantSim\Pacien
ti.xls")
Last line instruction writes data into an Excel file.
4.1 Resource Statistics
The AC statistics can be seen at the left side of Fig. 5.
The instance name of AC object in the model is
CarGP:1, as only one AC is used in the use-case. The
AC‘s whole time of existence (1 month) is divided to
coloured parts of column chart according to: Order
empty part of time (representing the driving part of
time of AC without any patient), Order occupied part
of time (representing the driving part of time of AC
with any patient transported to the hospital),
Unplanned part of time (used to represent treatment
part of time, when the AC is waiting near the house),
Home driving and Ready parts of time, when the AC
actually has no order, i.e. no patient is waiting for
treatment (the AC then drives to the parking place
near the hospital and waits for an order, being ready
to serve).
The Patient statistics are represented in the central
part of Fig. 5. Two sub-classes of the Patient class are
used in the use-case, so statistics of the time usage are
given for the patients from the class Pat (needing only
treatment at home) and for patients from the class
PatHosp (that also need to be transported to the
hospital).
In case of the patients needing hospitalization, the
biggest part of existence time of these patients in the
model is the hospitalization part of the time.
Treatment and Waiting time of these patients are
smaller. The smallest part of the time is the transport
time of these patients. This is influenced also by the
fact that the shortest paths to the hospital are in most
of the cases shorter in presented use-case than the
shortest paths from any house to another house, where
often the change of the traffic direction is needed,
although houses may be on the same track. The
presented very simple tracks network was used to
show the usefulness of similar models, that could also
be created e.g. for optimisation of logistics between
manufacturers, sub-providers, warehouses, and
customers. For the patients cared for only at home,
there are only two slopes in the graph representing the
waiting and treatment time of these patients.
Resource statistics for the hospital can be seen at
the right side of Fig. 5. The number of the patients in
the hospital from start to end of simulation is
represented by the curve named inHospital. The
second curve named released gives the growing
number of released patients from the hospital during
the month.
CHIRA 2019 - 3rd International Conference on Computer-Human Interaction Research and Applications
218
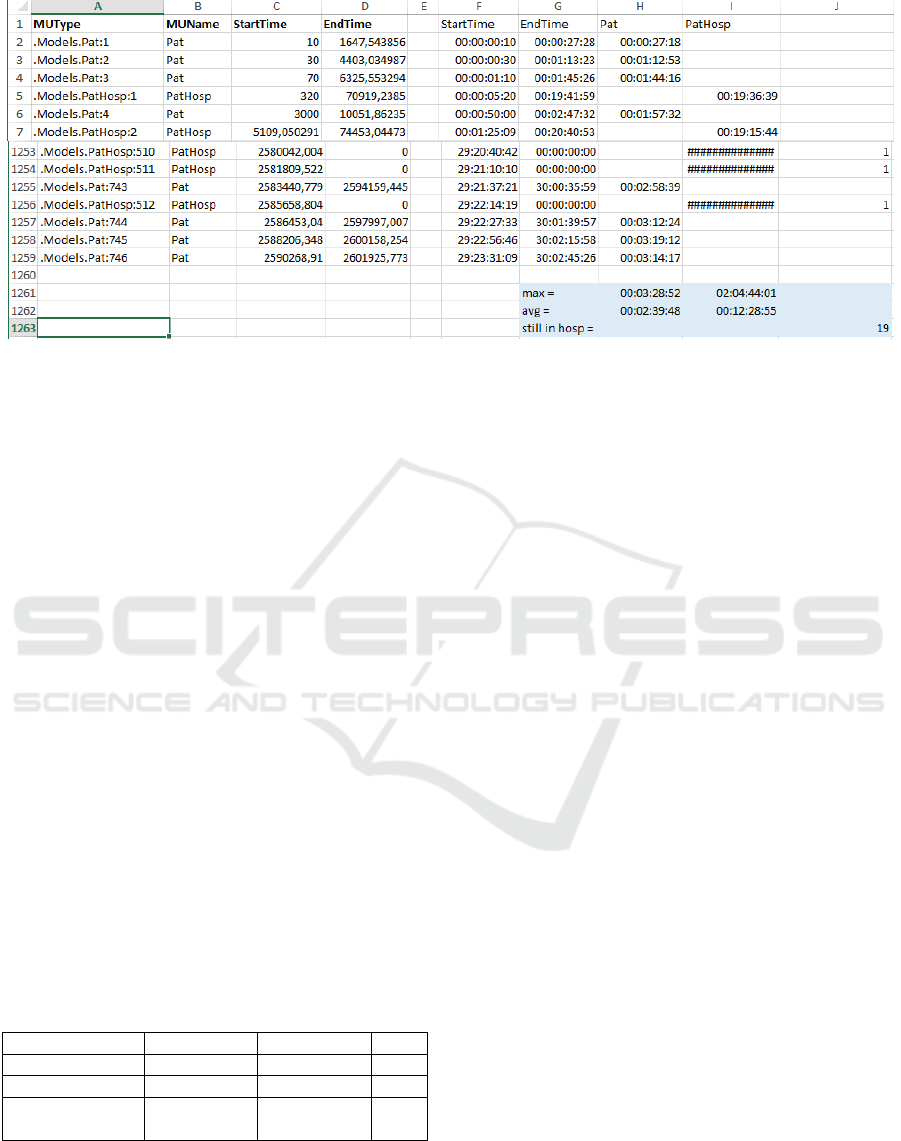
Figure 6: The time of existence of two types of patients in the model exported from SQLite to Excel file for further analysis
of retrieved data.
5 DATA ANALYSIS
The time of existence of two types of patients in the
model exported from SQLite to Excel file to further
analysis of data are given in Fig. 6. DB table columns
(two of type string, and two of type real) mentioned
in section 4 represent for each patient its instance
name, class name, and start/end times of his/her
appearance/disappearance in the model.
In many cases, it is better to transform time data
given in real format to time data given in time format
[dd:hh:mm:ss], which can be done by division by
86400. The existence time of the patient in the model
can be received by subtraction operation (EndTime -
StartTime). At the end of the simulation some of the
patients (instances of the PatHosp class) are still in
the hospital. The end time data for them equals to zero
(initial value), so a result of the subtraction is
negative. This can be used e.g. to obtain the number
of the patients still in the hospital (by a simple count).
In presented use-case there are 19 patients in the
hospital at the end of the simulation.
Table 1: Results from data analysis in the Excel file
exported from SQLite.
Pat
PatHosp
No
Max time
00:03:28:52
02:04:44:01
Avg time
00:02:39:48
00:12:28:55
Still in hospital
at end
19
The existence time of each patient consists of the
waiting, treatment, transport, and hospitalization
time. For illustration, maximum/average existence
time calculated for two categories of the patients are
given in Table 1.
6 CONCLUSIONS
Plant Simulation software and models created in it
can be useful in different ways. Running long time
simulation of some model, the user can retrieve a
sufficiently big amount of information and data, in
adequate degree similar to real world data because of
wide range possibilities to use random parameters in
the model. These data retrieved from simulation can
be further used to analysis and test of new design,
control, or decision strategies. Model of a simple
tracks network with an ambulance car is presented.
Some of the data received from the model simulation
is stored in SQLite in-memory database to be
exported for further analysis.
The model contains one ambulance car (AC)
waiting at parking place near the hospital until an
order for treatment appears and returning to this place
if there are no more patients waiting for treatment.
Shortest path achievement tree from any place on the
routes network to any other place is prepared before
the start of simulation run in a form of an Excel file.
This data is imported into Plant Simulation table and
lists and is then used to control the car moving over
to the destination during the simulation. Some of the
methods write data into SQLite database. After the
elapse of 1 month simulation time (running
approximately 12 s for this simple test case), the data
from the DB is read into a TableFile and subsequently
written into an Excel file for further analysis.
Ambulance Car Logistics using Shortest Path Achievement Tree in Plant Simulation
219

Results presented in the paper can be seen as part
of the project research. Creation of the routes network
model in Plant Simulation is planned (to be done in
future) using Google maps and GPS coordinates of
some important places. Influence of Blockchain on
the transportation industry is described in (Robinson,
2019). In further work, the authors plan to create a
distributed flexible manufacturing system model with
logistics. In such a task, intensive data exchange and
communication between distributed places will be
needed. BlockChain distributed database (Zigurat,
2019) connected to Plant Simulation model will
contain data on products, sub-parts, manufacturers,
sub-producers, customers, orders, etc. and this data
will become the subject of further sophisticated
analysis.
ACKNOWLEDGEMENTS
The authors are grateful to Scientific Grant Agency
of Slovak Republic and Slovak Academy of Sciences
for partial support of this work by projects VEGA
2/0167/16 and VEGA 2/0155/19.
REFERENCES
Bangsow, S, 2015, Manufacturing Simulation with Plant
Simulation and SimTalk- Usage and Programming
with Examples and Solutions, Springer-Verlag,
Berlin Heidelberg, viewed 10/12/2018
https://link.springer.com/content/pdf/10.1007%2F978-
3-319-19503-2.pdf
Blaga, F, Stanasel, I, Pop, A, Hule, V & Karczis, A, 2018,
´The use of modeling and simulation methods to
improve the performance of manufacture lines´ in
ModTech2018 IOP Conf. Series: Materials Science and
Engineering 400 (2018) 042006, viewed 20/2/2019
https://www.researchgate.net/publication/327731392_
The_use_of_modeling_and_simulation_methods_to_i
mprove_the_performance_of_manufacture_lines
Kurdel, P, Sebestyénová, J, 2011, ´Statecharts model and
heuristic scheduling of a production process´ in IEEE
INES 2011 - Budapest, pp. 309-314. ISBN 978-1-4244-
8955-8.
Kurdel, P, Sebestyénová, J, 2013, ´Routing optimization for
ATM cash replenishment´ in International Journal of
Computers, 2013, vol. 7, p. 135-144. ISSN 1998-4308.
Mes, M, RK, 2017, Simulation Modelling using Practical
Examples. A Plant Simulation Tutorial. University of
Twente, viewed 15/10/2018 https://www.utwente.nl
/en/bms/iebis/staff/mes/plantsimulation/tutorialplantsi
mulation13v20170726.pdf
Robinson, A, 2019, Blockchain Technology in Logistics,
viewed 10/4/2019 https://cerasis.com/blockchain/
Sebestyénová, J, Kurdel, P, 2019, ´Modelling,
Optimization, and Simulation of several First Aids in an
Area with Plant Simulation´ in 9th Int. Conf. on
Simulation and Modelling Methodologies,
Technologies and Applications SIMULTECH 2019,
Prague. INSTICC, in print.
Sebestyénová, J, Kurdel, P, 2014a, ´ Workflow for a multi-
agent system with voice user interfaces in a changing
environment´ in IEEE 12th International Symposium
on Applied Machine Intelligence and Informatics SAMI
2014, p. 117-122, ISSN 978-1-4799-3440-9.
Sebestyénová, J, Kurdel, P, 2014b, ´ Multimodal aspects of
communication and data storage and managing
systems´ in IEEE 18th International Conference on
Intelligent Engineering Systems INES 2014, p. 209-214,
ISBN 978-1-4799-4616-7.
Smith, JS, 2013, ´Survey on the use of simulation for
manufacturing system design and operation´ in Journal
of Manufacturing Systems 22(2), pp. 157-171, viewed
20/2/2019 http://dx.doi.org/10.1016/S0278-6125(03)
90013-6
Wikipedia, 2009, ´Shortest path problem´ in
https://en.wikipedia.org/wiki/Shortest_path_problem
Vavrík, V, Gregor, M & Grznár, P, 2017, ´Computer
simulation as a tool for the optimization of logistics
using automated guided vehicles´ in Procedia
Engineering 192, pp. 923-928.
Zigurat, 2019, ´Blockchain Success cases: Supply Chain
and Logistics´ in https://www.e-zigurat.com/
innovation-school/blog/blockchain-success-cases/ vie
wed 20/2/2019.
CHIRA 2019 - 3rd International Conference on Computer-Human Interaction Research and Applications
220
