
NEW NON-ADAPTIVE DISTRIBUTED SYSTEM-LEVEL
DIAGNOSIS METHODS FOR COMPUTER NETWORKS
Hiroshi MASUYAMA
Information and Knowledge Engineering, Tottori University
Koyama-cho Minami 4-101, Tottori, 680-8552, Japan
Koji WATANABE
Graduate School, Tottori University, Tottori, 680-8552, Japan
Keywords: Computer networks, System-level diagnosis, Diagnosability, Test graph
Abstract: A hierarchical non-adaptive diagnosis algorithm is presented for testing total
N nodes of computer
networks. Since general computer networks can be regarded as an
N -nodes complete graph, then for the
efficient testing, it is essential that the test process be parallelized to enable simultaneous test of multiple
nodes. In order to attain this object, we propose a noble test graph enabling to test as many nodes as possible
in a network due to a hierarchical architecture of test processes. The amount of test times is evaluated as the
diagnosis latency. Optimal diagnosability
t
is analyzed under clustered fault distribution. In order to
reduce the amount of required test times, two revised approaches are discussed and evaluated.
1 INTRODUCTION
There have been significant theoretical researches in
the area of system-level diagnosis by which every
node receives diagnosis. This system-level diagnosis
approach was introduced first by Preparata et al.
(F.Preparata et al., 1968) where
t
-diagnosability
was introduced. The
t
-diagnosability is the ability
to diagnose a fault situation with
t or fewer faults
given in the network. This means that every node
must be tested by more than
t
other nodes if a
network is said to be
t
-diagnosable. The problems
of fault detection (testing) and fault location
(diagnosis) have been mostly studied by using
testing networks which is reduced to some test
graphs, whose vertices denote the nodes and whose
an edge or test link
ji
pp , from node
i
p to node
j
p indicates that
i
p tests
j
p (C.Feng et al.,
1996) ~ (N.H.Vaidya et al., 1994). Since a general
graph contains many vertices, one by one test
approach requires significant test time.
The fault model of the network characterizes
the outcome of test results. The first model of system
diagnosis is introduced as PMC Model (F.Preparata
et al., 1968). In this model, the outcome of a test
performed by a fault-free node is correct and equals
fault state of the tested node. On the other hand, the
outcome of a test performed by a faulty node is
unreliable, that is, arbitrary. Classical system-level
diagnosis approaches (F.Preparata et al., 1968),
(S.L.Hakimi et al., 1974) have a central observer
by which all test results are gathered to make a
syndrome of the network. In the most of these
approaches, a distributed model is assumed where
each node performs independently its own local
diagnosis, that is, performs tests of only its definite
subset of nodes. If the choice of the next tests, that is,
the subset is known in advance, these test
approaches are also called a non-adaptive test. The
central observer uses the results obtained from all
test nodes to determine the fault situation, that is,
locates the faults in the network.
On condition that a ring can be judged
correctly whether the ring has at most one locatable
fault or more than one un-locatable faults, a single
loop testing (N.H.Vaidya et al., 1994) of one of
adaptive diagnosis techniques where the choice of
the next tests depends on the results of previous tests
and not on a fixed pattern, is developed. There exist
considerable presented schemes on the condition
that the maximum number of faulty nodes
distributed in a network is bounded by a predefined
limit, and they have been improved to reduce the
diagnosis latency (R.P.Bianchini et al., 1992),
(E.P.Duarte Jr et al., 1998). However, since test
graphs for general computer networks contains
161
Masuyama H. and Watanabe K. (2004).
NEW NON-ADAPTIVE DISTRIBUTED SYSTEM-LEVEL DIAGNOSIS METHODS FOR COMPUTER NETWORKS.
In Proceedings of the First International Conference on E-Business and Telecommunication Networks, pages 161-168
DOI: 10.5220/0001384401610168
Copyright
c
SciTePress

many vertices, these adaptive diagnosis techniques
require significant overhead, that is complex
analysis of the test results.
In this paper, we consider a classical system-
level diagnosis algorithm in which only the nodes
fail because a faulty communication link can be
accommodated by treating as a faulty node. And we
present a hierarchical non-adaptive diagnosis
algorithm for testing total
N nodes of computer
networks. Since general computer networks can be
regarded as an
N -nodes complete graph, then for
the efficient testing, it is essential that the test
process be parallelized to enable simultaneous test of
multiple nodes. In order to attain this object, we
propose a regular graph of connectivity-
()
1
+
t with
N nodes as test graphs. In this test graph, a self-
tested node is placed at a key location in a
hierarchical structure, and at first the node tests the
adjacent nodes. Only adjacent nodes that passed the
test can become new monitors and test their adjacent
nodes, and so on. This process is propagated to
higher levels of the test graph. At each level, all
monitors send the announcements of their own test
results “ I passed the test ” when they received a
qualification as a monitor first, and in addition send
only the test failed results of their test targets when
they finish their tests, back to their monitors by
which they are tested first. Each monitor also sends
data transferred from its test target back to the
monitor by which he is tested first. Then all test
results are gathered in a host ( that is , a central
observer ) directly connected the original monitor,
and then the host can locate all faults in the network.
Optimal diagnosability
t
is analyzed under
clustered fault distribution.
Recently, several diagnosis techniques based
on this self-testing (F.J.Meyer et al., 1989) have
proposed, and achieved a successful diagnosis of a
large number of faults. Though most of drawbacks
of self-testing are to require many self-testing,
papers (L.Zakrevski et al., 1998), and
(H.Masuyama et al., 2001) made the drawbacks
light by preparing the limited number of monitors, as
shown in our approach. However, their target
networks are multi-processor networks consisting of
homogeneous nodes connected by bi-directional
links. Each node can be viewed as a combination of
a router and processor along with associated RAM,
bus and I/O circuitry, then they differ from us in
target networks.
In non-adaptive or even adaptive tests, since each
node must performs a certain number of nodes and
report to somewhere in the network, then a traffic
problem must be cleared. Therefore, not only the
time elapsed for testing all nodes and the time
complexity of diagnosis algorithm but also the
traffic condition are essential to evaluate diagnosis
algorithms. In this paper, diagnosis latency, that is,
the time elapsed for testing all nodes is evaluated as
the total number of test times where each test
executes in different time. This time is also called as
testing round. In order to reduce the amount of
required test times, two revised approaches are
discussed and evaluated.
2 ALGORITHMS
In this section, we will discuss three algorithms for
constructing our test graph, for obtaining necessary
test orders, and for test.
2.1 Test graph
For given N and diagnosability t , we will plan to
construct a test graph whose connectivity is over
t
by the following algorithm:
[Algorithm A]
Step 1: Prepare
α
hypercubes of dimension
β
independently, and number to
these
α
hypercubes. Each node in a
hypercube corresponds to
(
)
1
−
α
nodes in each different hypercubes.
Step 2: For total
β
sets of
α
corresponding nodes, connect
α
corresponding nodes with a
completed graph.
Step 3: Select one node as an original monitor
arbitrary from
N nodes. Set the
edges connected with the original
monitor and the adjacent nodes as
unidirectional edges and all other
edges as bidirectional edges.
The graph obtained by Algorithm A has
β
α
2⋅ nodes, and the degree of each node is
α
+
(
)
1
−
β
. Then,
α
and
β
are restricted by
given
N and
t
as follows:
β
α
2⋅=N and
(
)
2
−
+
≤
β
α
t . The longest distance
m
d from an
original monitor is
1
+
β
.
On the strength of algorithm A for
constructing test graph, we can give test orders to
every adjacent nodes of each node by the following
algorithm:
[Algorithm B]
Each node of a
β
-dimensional hypercube
can be indexed 0 to
1
2
−
β
, and each of
α
hypercubes can be numbered 0 to
1−
α
. Assume
node
i is indexed
j
and hypercube which
contain node
i is numbered
()
10 −≤≤
α
kk . The
test orders of each adjacent node of node
i are as
follows: The adjacent nodes indexed
(
)
,1
+
j
(
)
(
)
(
)
1,2,,2
−
−
+
jjj L
(
)
β
2.mod
on hypercube
numbered
k , the adjacent nodes on hypercubes
numbered
(
)
(
)
(
)( )
1,2,,2,1 −−
+
+
kkkk L
()
α
.mod .
ICETE 2004 - SECURITY AND RELIABILITY IN INFORMATION SYSTEMS AND NETWORKS
162

2.2 Test algorithm
On the strength of Algorithms A and B, we can
construct a test algorithm for an
(
)
β
α
2⋅=N
-node
network as follows:
[Algorithm C]
First, the monitor tests its adjacent nodes in
the test order of the adjacent nodes, and hands a
message “faulty node name” to the host if it decides
an adjacent node faulty. The monitor hands a
qualification as a monitor to its adjacent node if it
decides the adjacent node non faulty.
Each node hands first its own test result “I
passed the test” to its the first tester when it received
a qualification as a monitor. Each node starts testing
its adjacent nodes in the test order, and hands a
message “faulty node name” to the adjacent node by
which it is tested first if it decides its testing adjacent
node faulty. It hands a qualification as a monitor to
its adjacent node if it decides the adjacent node non
faulty. Each node hands messages of “faulty node
name” to the adjacent node by which it is tested first
if it receives the messages from the adjacent node to
which it tested previously.
Then, with Algorithm C all test results can be
gathered in a host directly connected the original
monitor, and then the host can locate all faults in the
network.
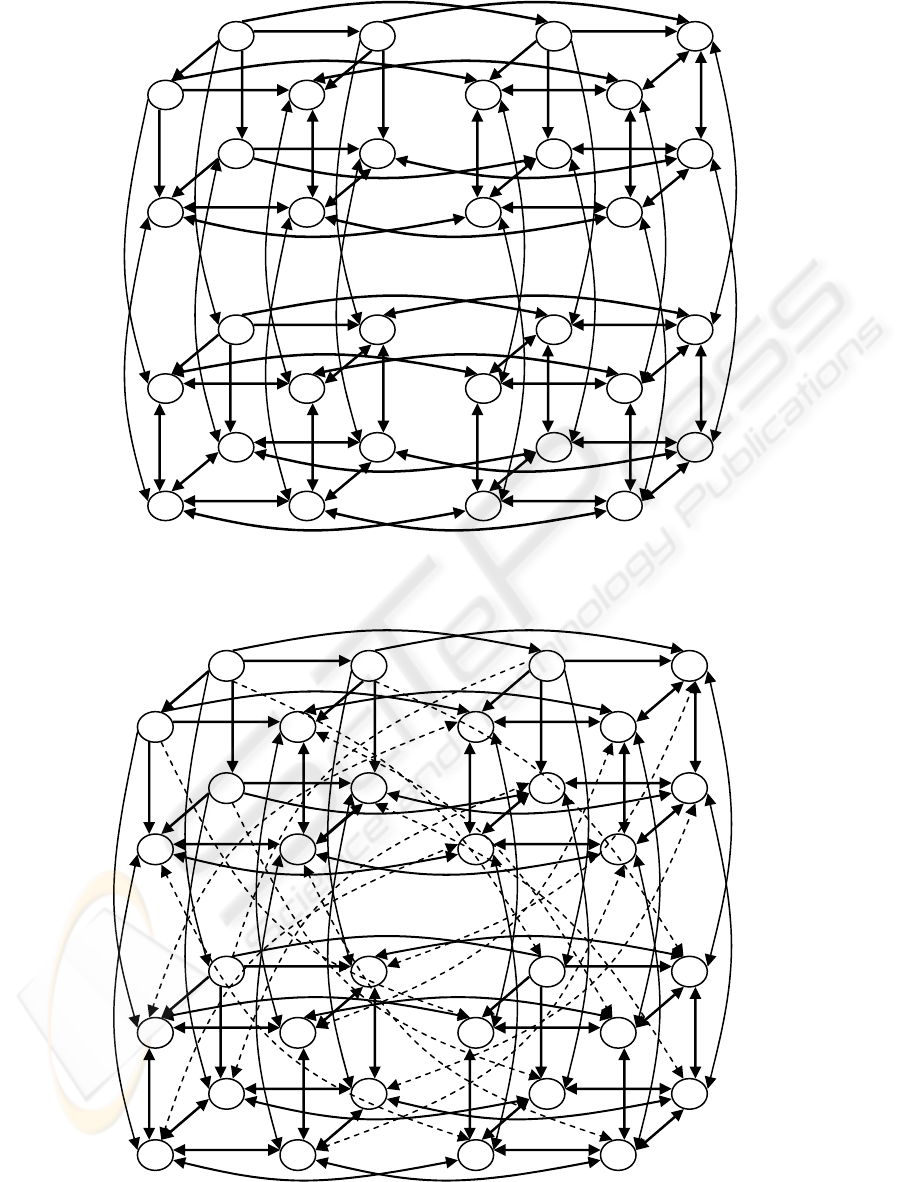
Example 1: Figs.1(a) and (b) show two test graphs
with
N
=16 labeled the test orders in the cases of
()
2,4,1 === t
βα
and
()
4,2,4 === t
βα
,
respectively. Figs.2(a) and (b) show two test graphs
with
N
=32 in the cases of
()
4,4,2 === t
βα
and
()
5,3,4 === t
βα
, respectively.
3 EVALUATION
3.1 Number of test times
The total number of edges in a test graph with
β
α
2⋅=N
and
()
2−+=
β
α
t is
(
)
(
)
(
)
(
)
11
−
+
+
+
+
−
β
α
β
α
tN , where we count a
bidirectional edges as 2 edges. This value becomes
close to
(
)
1
+
tN when N is large. Let the total
number of test times where each test executes in
different time be
T
. Since the total number of
nodes is
N , then the number of tested arcs can
increase exponentially up to
N by taking test time
γ
which satisfies
γ
2=N
. After the time
γ
, since
the total number of tested arcs is
∑
−
=
1
0
2
γ
i
i
,the number
of untested arcs is
()
∑
−
=
−+
1
0
21
γ
i
i
tN
. These
()
∑
−
=
−+
1
0
21
γ
i
i
tN
untested arcs can be tested N to
N every test time, then it takes total
()
−−
∑
−
=
NtN
i
i
/21
1
0
γ
times.
Therefore,
T
is given as follows:
()
−++=
∑
−
=
NtNT
i
i
/21
1
0
γ
γ
t
+
=
γ
tN
+
=
log
(1)
3
6
3
1
9
7
5
7
3
7
2
2
38
96
6
5
6
5
9
59
4
5
4
5
5
4
6
4
7
8
6
8
7
4
7
5
4
75
5
7
4
5
7
4
66
886
6
8
8
(b) In the case of
,2,4 =
=
β
α
and
4=t
Figure 1: Two test graphs with
16
=
N
.
4
5
41
6
4
6
2
6
5
5
42
5
373
555
44
66
6
63
6
3
65565
5
4
4
(a) In the case of
,4,1 =
=
β
α
and
2=t
NEW NON-ADAPTIVE DISTRIBUTED SYSTEM-LEVEL DIAGNOSIS METHODS FOR COMPUTER NETWORKS
163
1
2
2
3
3
3
3
44
44
44
44
55
5
55
5
5
5
5
5
5
5
5
5
6
6
6
6
6
6
6
6
6
6
6
6
6
6
6
6
6
6
6
6
6
6
6
6
6
6
7
77
77
77
7
7
77
77
77
77
77
77
77
7
7
8
8
8
8
8
88
8
8
8
8
8
8
8
88
8
8
8
8
8
8
8
8
9
9
9
9
9
9
9
9
9
9
9
9
9
9
9
9
9
9
99
9
9
5
10
10
1010
101010
10
10
10
10
1010
10
10
10
10
10
11
11
11
11
11
11
11
11
11 11
11
(b)In the case of
,3,4
=
=
β
α
and
5
=
t
Figure 2: Two test graphs with
=
N
32.
4
6
4
1
10
8
77
9
2
7
4
42
6
66
8
10
8
8
88
1010
3
3
3 1010
10
10
7
7
77
7
7
7
666
4
4
4
4
6666
9
9
9
883
1010
1010
99
9
9
9
9
9
99
9
5
555
666
66 66
7
7
88
8
8
8
8
88
88
8
7
77
7
7
7
599
99
55
588
8
5
55
5
6666
6
6
66
97
7
5
7
77
5
58 7
7
(a)In the case of
,4,2
=
=
β
α
and
4
=
t
.
ICETE 2004 - SECURITY AND RELIABILITY IN INFORMATION SYSTEMS AND NETWORKS
164
3.2 Time complexity of diagnosis
algorithm
Each node can test its adjacent nodes
asynchronously in the test order which is given
automatically by the test graph. Therefore, on the
assumption that the time complexity of algorithm to
test a node by the adjacent monitor is 1, the time
complexity of diagnosis algorithm can be evaluated
as the same as
T
.
3.3 Amount of transmit messages
Each node hands a message “faulty node name” to
the adjacent node by which it is tested first if it
decides its testing adjacent node faulty. Then, these
messages “faulty node name” pass through at most
()
m
dtt 1+ edges in a test graph. The average
amount of transmit messages on an edge is given as
() ()
1/1 ++ tNdtt
m
, that is Ntd
m
/ .
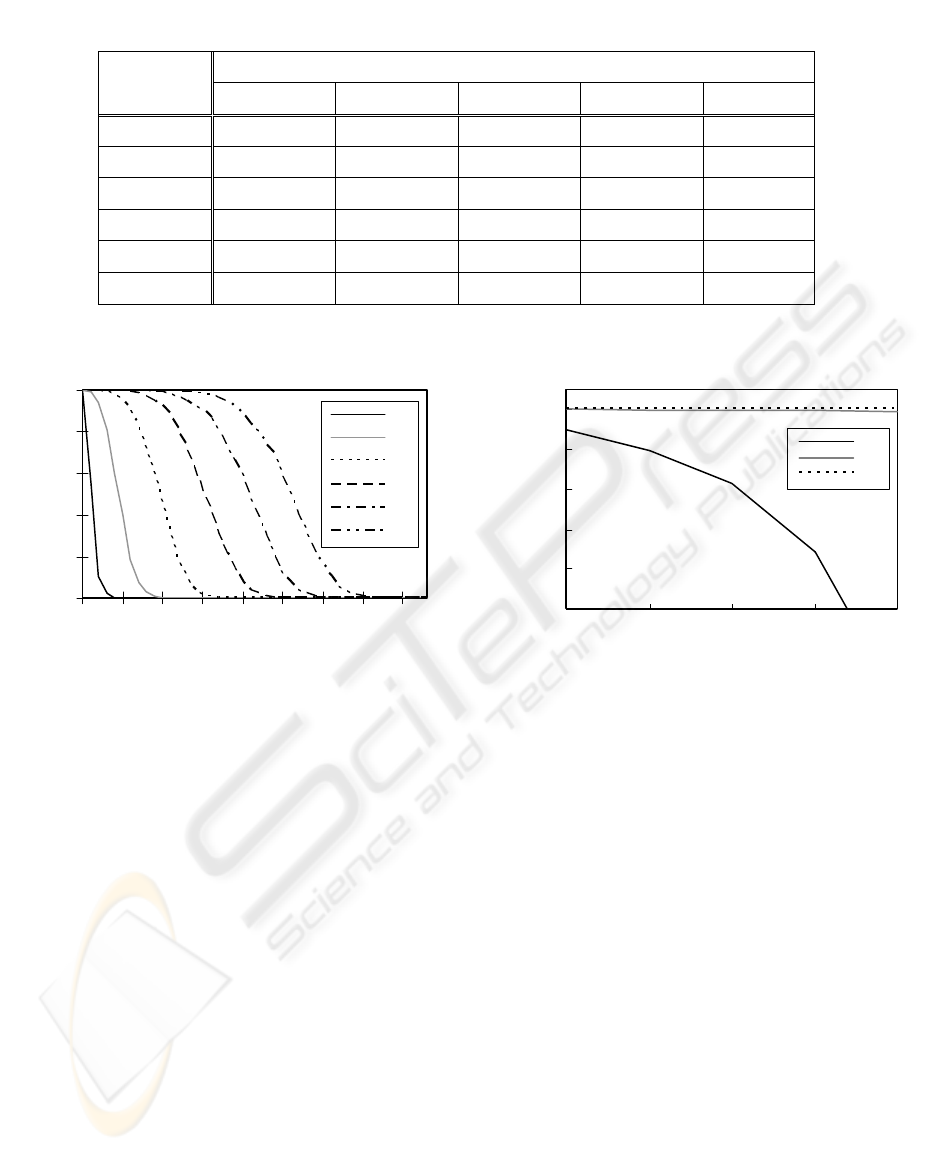
3.4 Analysis of diagnosability t under
clustered fault distribution
Extensive simulations were performed for evaluating
the diagnosability when faulty nodes are clustered in
a system. The examined systems consist of
1310
2
~
2 nodes. A thousand different
configurations of clustered faulty nodes in a system
were simulated using negative binominal
distributions. The diagnosis algorithm was run on all
these configurations. Fig.3 gives the probability of
correct diagnosis for the 6 scenarios of
diagnosability and N=
13
2
. It can be observed from
Fig.3 that, for any yield Y, the probability of correct
diagnosis is higher for higher diagnosability. Thus,
the diagnosis with
t=1 has the least probability of
correct diagnosis over all yields, as was expected.
What we need to know is the smallest diagnosability
by which diagnosis is correctly performed under the
limits of realistic circumstances. Table 1 gives the
probability within the realistic yield values in
Yield (%)
t
99.999 99.750 99.500 99.250 99.000
1 1.0000 0.9616 0.8551 0.7031 0.5420
2 1.0000 0.9998 0.9989 0.9951 0.9915
3 1.0000 1.0000 1.0000 0.9999 0.9999
4 1.0000 1.0000 1.0000 1.0000 1.0000
5 1.0000 1.0000 1.0000 1.0000 1.0000
6 1.0000 1.0000 1.0000 1.0000 1.0000
Table 1: Probability of correct diagnosis for realistic yield in N=
13
2
.
Figure 3: Probability of correct diagnosis
for 6 diagnosabilities and N=
13
2
0.9
0.92
0.94
0.96
0.98
1
12345
number of nodes
probability
t=1
t=2
t=3
9
2
10
2
11
2
12
2
13
2
Figure 4: Probability of correct
diagnosis for 5 network scales in
0
0,2
0,4
0,6
0,8
1
1009590858075706560
yield(%)
probability
t=1
t=2
t=3
t=4
t=5
t=6
NEW NON-ADAPTIVE DISTRIBUTED SYSTEM-LEVEL DIAGNOSIS METHODS FOR COMPUTER NETWORKS
165

N=
13
2
. Fig.4 gives the probability for the 5
scenarios of network scale in the case of Y=99.5%.
These data show an answer that t=2 is proper.
4 REDUCTION OF DIAGNOSIS
PROCESS
In this section, we consider a technique to reduce the
number of test times. Two approaches can be
proposed as follows:
Let us set m quasi-monitors which perform the
same test processes as the original monitor’s. Since
these quasi-monitors are not connected directly with
the central observer, the gathered test results (faulty
node names with its tester name) are stored
temporarily in each quasi-monitor until each quasi-
monitor receives a qualification as a monitor. After
that, the quasi-monitor hands its test results to its
own tester. The tester next hand the test result to the
tester’s tester, and so on. Finally, the test results is
transmitted to the central observer. On this condition,
we can consider two approaches to test the quasi-
monitors as shown in Fig.5. In Fig.5(a), the original
monitor tests only
m quasi-monitors, then it does
not test any other node. In Fig.5(b), the original
monitor does not test any quasi-monitor directly,
then each quasi-monitor is tested by the adjacent
nodes obtained a qualification as a monitor. This
reformed point is that both original and quasi
monitors enter for testing simultaneously. The un-
inscribed part in each circle in Fig.5 means the same
structure as the test graph shown by Algorithm A.
Each quasi-monitor hands its stored test results to its
tester in order, as mentioned above. Then all test
results can be gathered in a host directly connected
the original monitor, and then the host can locate all
faults in the network.
From the above discussion, we can understand
the intention to reduce the number of test times, that
is, the test graph can be partitioned into
m (in
Fig.5(a)) or
1
+
m (in Fig.5(b)) parts by preparing
m quasi-monitors. When the first candidate of
quasi-monitor is judged as faulty, the second
candidate is next tested, and so on. When an
adjacent node of the first candidate of quasi-monitor
is judged as non-faulty, the node takes the place of
the first candidate of faulty quasi-monitor. The new
quasi-monitor begins testing its adjacent nodes from
the beginning.
Let us consider the relative merits of the
above two approaches in the point of the number of
required test times. Let
1
T
and
2
T
be the numbers
of test times required, when all the first candidates
of quasi-monitor are non faulty, in the approaches
shown in Fig.5 (a) and (b), respectively. That is,
1
T
and
2
T
are the smallest numbers of test times
required in the approaches shown in Fig.5 (a) and
(b). We obtain the following two equations from
Figure 5: Two reduction approaches.
(a)ApproaI
(b)Approach II
⋅
⋅
⋅
1+t
1
+
t
1
+
m
1
2
3
4
rd3The
−
thThe −t
th)1(The
−
+t
nd2The
−
•
•
•
•
•
•
•
•
•
1+t
monitor-quasiof
candidatefirstThe
monitor original
2
N
1
N
⋅
⋅
⋅
m
1
2
th)1(The −+t
thThe −t
nd2The −
rd3The
−
monitor-quasiof
candidatefirstThe
1+t
monitor original
monitor-quasiof
candidatefirstThe
monitor-quasiof
candidatefirstThe
•
•
•
•
•
•
ICETE 2004 - SECURITY AND RELIABILITY IN INFORMATION SYSTEMS AND NETWORKS
166

eq.(1):
()
[]
1/log,max
1
−+= tmNmT
[]
tNtNT +++=
212
log,1logmax
Were
1
N and
2
N are the total numbers of nodes
in circles 1 and 2 in Fig.5 (b), respectively.
m is
restricted by the following relationships:
()
1
1 Nmt ≤+
NmNN =+
21
For simplification, we assume
21
NmN = , then we
obtain
2
T
and an inequality for m as
{
}
{
}
[
]
tmmNtmNT +++++= )1/(log,1)1/(logmax
22
2
,
()
(
)
Nmmt ≤++ 11
2
(2)
On the other hand, in the worst faulty case, that is,
the biggest numbers
max1
T and
max2
T of test
times required in Fig.5 (a) and (b), respectively are
as follows:
(
)
mNtmT /log2
max1
++≅
(
)
{
}
mmNtT log1/log23
2
max2
+++≅
Fig.6(a) shows the relative merits of the above two
and original approaches in the case of
16
2=N and
2
=
t
under the restriction given by eq.(2). In this
case, the boundary line of the relative merits is
18
=
m
, that is, the scheme shown in Fig.5(b) is
superior to the others. On the other hand, Fig.6(b)
shows the merits in the case of
16
2=N and
18
=
m
under the same restriction. In this case, the
boundary line of the relative merits is
6=t
, that is,
the scheme shown in Fig.5(a) is the best when
t
is
over the boundary. Fig.7 shows relative merits in the
case of
13
2=N , where the results show the same
tendency as in the case of
16
2=N .
Extensive simulations were performed also for
evaluating the relationship of the number of test
times versus the number of quasi-monitors when
faulty nodes are clustered in a system of
13
2
nodes.
A thousand different configuration of clustered
faulty nodes in the system were simulated using
negative binominal distributions on condition of t=2.
Figs.8(a) and (b) show the results in the cases of
(a) In the case of
2=t
Figure 7: The relative merits in the case of
13
2=N
.
4
6
8
10
12
14
16
18
20
13579111315
number of quasi-monitors
number of test times
T2
T1
T
6
8
10
12
14
16
18
0123
diagnosability
number of test times
T
T1
T2
(b) In the case of
15=m
10
14
18
22
26
30
01234567891011
diagnosability
number of test times
T2
T1
T
Figure 6: The relative merits in the case of
16
2=N
.
10
15
20
25
30
1 3 5 7 9 11 13 15 17 19 21 23 25 27
number of quasi-monitors
numer of test times
T1
T2
T
(a) In the case of
2=t
(b) In the case of
18=m
NEW NON-ADAPTIVE DISTRIBUTED SYSTEM-LEVEL DIAGNOSIS METHODS FOR COMPUTER NETWORKS
167
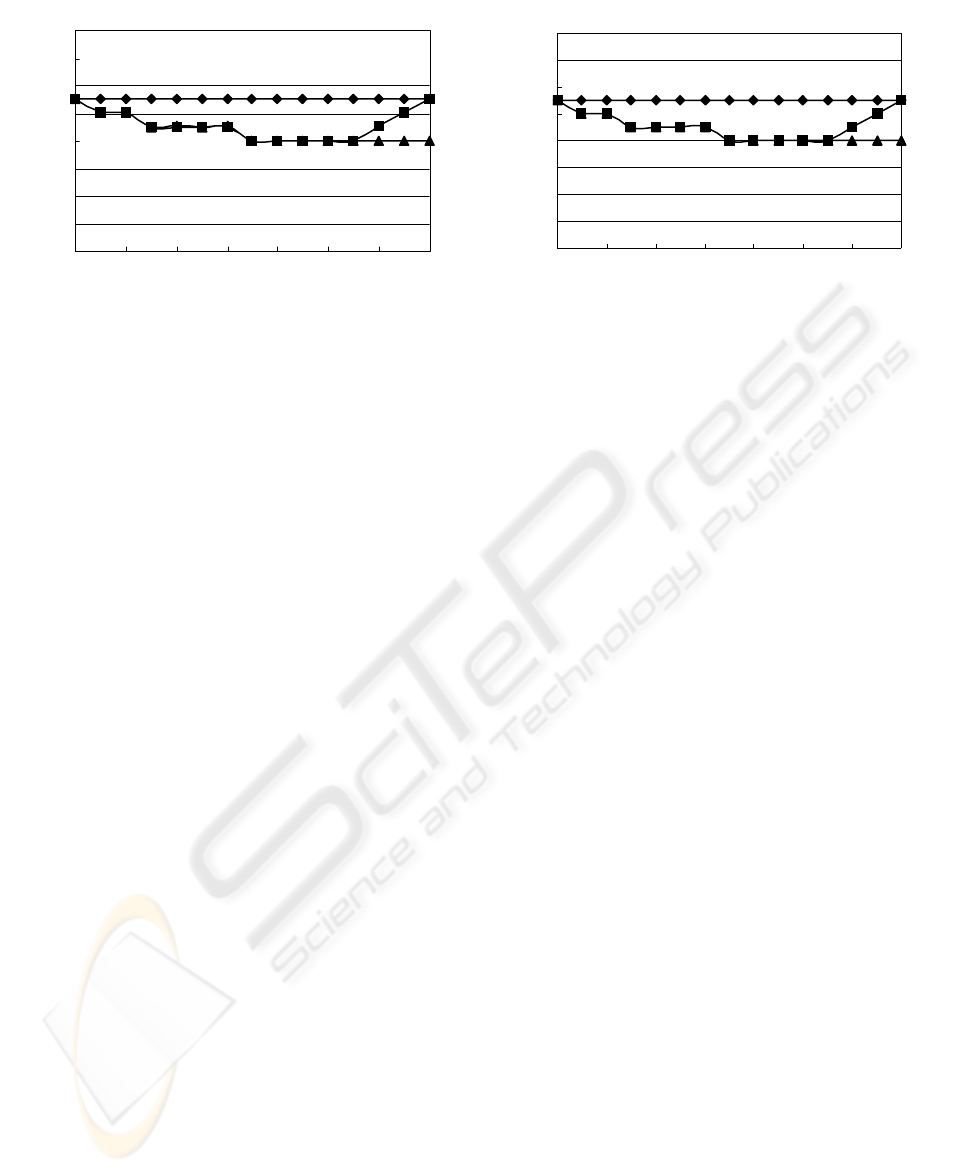
Y=99.95% and 99.50%, respectively, where Y is
the yield of nodes in the system. The same
property as mentioned above is proved in realistic
circumstances.
5 CONCLUSION
A hierarchical non-adaptive diagnosis algorithm is
presented for testing total
N nodes of computer
networks. We proposed a noble test graph with
()
1+t -connectivity enabling to test as many nodes
as possible in a network due to a hierarchical
architecture of test processes. If the maximum
number of faulty nodes distributed in a network is
bounded by a predefined limit
t
, our approach is
effective. In this approach, an original monitor is
placed at a key location in a network, and at first
the monitor tests the adjacent nodes. Only adjacent
nodes that passed the test can become new
monitors and test their adjacent nodes, and so on.
This process is propagated to higher levels of the
test graph. At each level, every new monitor sends
their information as a successful candidate ( new
monitor ) back to a central observer directly
connected original monitor through only one route.
Monitor sends its test result back to a central
observer through only one route if it decides its
adjacent node faulty. Consequently, the observer
can gather all information of faults in the network.
The amount of test times is evaluated as the
diagnosis latency. Optimal diagnosability
t
is
analyzed under clustered fault distribution. Two
revised approaches to reduce the required test
times are discussed and the relative merits of three
approaches are evaluated.
REFERENCES
F.Preparata, G.Metze, and R.T.Chien, “On the
Connection Assignment Problem of Diagnosable
Systems,” IEEE Trans. Electronic Computers, vol.16,
pp.848-854, 1968.
C.Feng, L.N.Bhuyan, and F.Lombardi, “Adaptive
System-Level Diagnosis for Hypercube Multi-
Processors,” IEEE Trans. on Computers, vol.45,
no.10, pp.1157-1170, 1996.
C.R.Kime, “System Diagnosiss,” In Fault-Tolerant
Computing: Theory and Techniques, vol.2,
D.K.Pradhan(ed.), Prentice-Hall, New Jersey, 1986.
D.P.Siewiorek and R.S.Swarz, “Reliable Computer
System – Design and Evaluation,” 2
nd
ed. Digital
Press, Bredford, MA, 1992.
N.H.Vaidya and D.K.Pradham, “Safe System Level
Diagnosis,” IEEE Trans. Comput. Vol.43, no.3,
pp.367-370, 1994.
S.L.Hakimi and A.T.Amin, “Characterization of
Connection Assignment of Diagnosable Systems,”
IEEE Trans. Comput., no.1, vol.C-23, 1974.
R.P.Bianchini and R.Buskens, “Implementation of On-
Line distributed System-Level Diagnosis Theory,”
IEEE Trans. Comput. vol.41, no.5, pp.616-626, 1992.
E.P.Duarte Jr. and T.Nanya, “A Hierarchical Adaptive
Distributed System-Level Diagnosis Algorithm,”
IEEE Trans. Comput. Vol.47, no.1, pp.34-45, 1998.
F.J.Meyer and D.H.Pradhan,”Dynamic Testing strategy
for Distributed Systems,” IEEE Trans. Comput.,
vol.39, no.3, pp.356-365, 1989.
L.Zakrevski and M.G. Karpovsky, ”Fault-Tolerant
Message Routing for Multiprocessors.” Parallel and
Distributed Proscessing (Edited J.Rolim), Springer,
pp.714-731, 1998.
H.Masuyama, Y.Ohashi, and T.Miyoshi, “A Diagnosis
Method of Computer Networks.” 2001 Proceedings
of IASTED Parallel and Distributed Computing and
Systems, pp.474-479, 2001.
4
6
8
10
12
14
16
18
20
13579111315
number of quasi-monitors
number of test times
T2
T1
T
4
6
8
10
12
14
16
18
20
13579111315
number of quasi-monitors
number of test times
T2
T1
T
(a) In the case of
2=t
,
13
2=
N
and Y=99.95%
(b) In the case of
2
=
t
,
13
2=
N
and Y=99.5%
Figure 8: The relative merits in realistic circumstances of fault pattern.
ICETE 2004 - SECURITY AND RELIABILITY IN INFORMATION SYSTEMS AND NETWORKS
168
