
EXPERIMENTAL BASED TOOL CALIBRATION USED FOR
ASSESSING THE QUALITY OF E-COMMERCE SYSTEMS
Antonia Stefani
1
, Dimitris Stavrinoudis
1
, Michalis Xenos
1,2
1
School of Sciences & Technology,Hellenic Open University,23 Sachtouri Str, Patras, Greece
2
Research Academic Computer Technology Institute, 61 Riga Feraiou Str, Patras, Greece
Keywords: E-commerce Systems, Measurements, Quality Assessment
Abstract: This paper presents a method used to evaluate the quality of e-commerce systems. The presented method
uses a Belief Network in order to model the factors and criteria affecting the quality of e-commerce
systems. This model can be applied not only for assessing the quality of e-commerce systems, but also for
ensuring quality design before development. It also offers numerical results for the overall quality of an e-
commerce system, as well as for its intermediate factors and lower-lever criteria. This paper presents the
experimental results and the data analysis that aided towards the calibration of the model, i.e. assessing an e-
commerce system and its individual characteristics based on the numerical results derived from the model.
1 INTRODUCTION
E-commerce systems have been developed at a
staggering rate in recent years. In particular, they
offer a full range of functions and services in order
to fulfill the end-users requirements and to provide
them high service quality. However, the quality of e-
commerce systems is strongly related to the quality
of the interface, as it is perceived by the end-user,
who is also the e-customer of the system.
E-commerce system research has examined
different issues of interface design, especially in
Business to Consumer (B2C) systems. Emphasis
was placed on usability issues (Nielsen, 2000),
interface design principles (Lohse, 1998; Schafer,
2001) and end-users’ behavioral model (Wilson,
2003; Sherman, 2003).
Most of the tools that have been developed for
the assessment of e-commerce systems (Molla,
2001, Offut, 2002) give emphasis on the web
applications of the system and they are based on
surveys. This process provides significant results but
demands extra time for data collection and data
analysis in each measurement phase. The method’s
tool provides a flexible way to define the quality of
e-commerce systems, as users perceive it, in a short
period of time.
This paper presents a method for assessing the
quality of e-commerce systems. This method is
based on a previously presented model (Stefani,
2003) using Belief Networks. This model is used for
the assessment of e-commerce systems (developed
or ever during their development). The model offers
numerical results for the overall quality of an e-
commerce system, as well as for its intermediate
factors and lower-level criteria. This paper presents
the experimental results and the data analysis that
aided towards the calibration of the model.
Assessing an e-commerce system and its individual
characteristics based on the numerical results were
derived from the model.
In section 2 the foundations of the proposed
method and the tool used are presented, while in
section 3 the aim and the context of the study are
discussed. In section 4 the experimental results that
aided to the definition of the numerical scales are
presented, while in section 5 the application of the
presented method is further discussed. Finally, in
section 6 conclusions and future work are presented.
2 PRESENTATION OF THE
MODEL
The method presented in this paper uses a Belief
Network in order to model the quality factors of e-
commerce systems. This model is based on the ISO
9126 quality standard (ISO, 1991) and specifically it
relies on the quality characteristics and sub-
26
Stefani A., Stavrinoudis D. and Xenos M. (2004).
EXPERIMENTAL BASED TOOL CALIBRATION USED FOR ASSESSING THE QUALITY OF E-COMMERCE SYSTEMS.
In Proceedings of the First International Conference on E-Business and Telecommunication Networks, pages 26-32
DOI: 10.5220/0001393000260032
Copyright
c
SciTePress

characteristics that are directly related to quality as
perceived by the end-users. These quality
characteristics are: Functionality, Usability,
Reliability and Efficiency.
The mathematical model on which Bayesian
Networks are based, is the theorem developed by the
mathematician and theologian Thomas Bayes. The
Bayesian Networks are a special category of graphic
models where the nodes represent variables and the
directed arrows represent the relation between the
nodes. In the Bayesian Networks the node from
which the directed arrow starts is defined as ‘parent’
node whereas the node where the directed arrow
points at is defined as a ‘child’ node. Therefore, a
Bayesian Network is a graphic network that
describes the relations of probabilities between
variables.
In order to define the relations between the
variables, firstly the dependent probabilities that
describe the relations between the variables must be
determined for each node. If the values of each
variable are distinct, then the probabilities for each
node can be described in a Node Probability Table.
This table presents the probability that a ‘child’ node
is assigned a certain value for each combination of
possible values of the ‘parent’ nodes. For example,
if there is a Bayesian Network that presents one
child node A and two parent nodes B, C then the
probability table of node A reflects the probability
P(A| B, C) for all possible combinations of A, B, C.
The Belief Network of the model consists of a
number of nodes. Because of the hierarchical
structure of the ISO 9126 quality standard, this
Belief Network is represented as a tree. The root of
this tree is the node Quality, which represents the e-
commerce system quality as a whole. This node is
connected to four nodes, one for each of the four
aforementioned quality characteristics. Furthermore,
each quality characteristic node is connected to the
corresponding quality sub-characteristics, according
to the ISO 9126. Finally, each of these quality sub-
characteristic nodes is connected to intermediate
nodes or to leaf nodes comprising the characteristics
of e-commerce systems. A graphical presentation of
a part of the network is illustrated in Figure 1.
The leaf nodes can be measured without
subjectivity, since they simply answer the question
posed to the user whether a specific e-commerce
characteristic exists in the system or not. As a result,
they take values 0 or 1. All the intermediate nodes
are characterized by three possible states: ‘good’,
‘average’ and ‘poor’, except the central node (the
Quality node), which is characterized by two
possible states: ‘good’ and ‘poor’. In this model all
these possible states of each intermediate node take
probability values which vary between 0 to 1. The
probabilities of the model are based on data taken
from previous studies of e-commerce systems
(Stefani, 2001).
Figure 1: Graphical presentation of the model.
The use of the model can be forward and
backward. In the forward use, the user inserts
evidence to the leaf nodes in order to assess the
overall quality of an e-commerce system. In this
way, the model estimates the system’s quality and
characterizes it as ‘good’ and ‘poor’ also providing
the corresponding probability values. Whereas the
backward use of the model provides assessments
regarding for intermediate or leaf nodes, when the
value of a parent node is defined.
The model is also distinguished by its dynamic
character. In other words, the node probability tables
can always be refined by its use, while the results
derived from its application can be utilized for its
constant improvement, contributing to a continuous
evolvement and upgrading. The current version of
the model with simple instructions of its use is
available on the web site of the Software Quality
Research Group of the Hellenic Open University
(SQRG-HOU, 2004).
3 AIM AND CONTEXT OF THE
STUDY
The method proposed in this paper is based on the
use of the aforementioned model. However, in order
Results
Processing
Quality
Efficiency
Resource
Behaviour
Time
Behaviour
Access
Graphics
Access Text
Search
Loading
Time
Search
History
Usability
Functionality
Reliability
EXPERIMENTAL BASED TOOL CALIBRATION USED FOR ASSESSING THE QUALITY OF E-COMMERCE
SYSTEMS
27

for the application of the model to be worthwhile the
probability values for its nodes must be meaningful.
A comparative approach between these probability
values and the assessment of each e-commerce
system must be formulated. In other words, when
the model estimates the probability values of the
quality characteristics of an e-commerce system, one
must be able to classify this system and ascertain the
specific fields that need to be improved. The paper
provides the boundaries and the scales of these
values that were concluded from experimental
measurements to a number of e-commerce systems.
As a result, it provides a non-subjective way of
characterizing an e-commerce system according to
the quality characteristics with which this method is
concerned. In this way, the use of this model can
easily lead to conclusions and determine specific
corrective actions needed to be set in order to
improve the quality of the system.
In this case study a number of e-commerce
systems were measured following the proposed
method. In detail, the data of this method were based
on the assessment of 120 different Business to
Consumer (B2C) e-commerce systems. The
selection of these sites was a representative list
randomly sampled from the entire list of the Greek
and international e-commerce systems, which were
available the day of this study. For each of these
systems the aforementioned model was used, by
defining the values in its child nodes. In this way,
the probability values for all the intermediate nodes
were estimated.
After collecting the measurement data, the next
step was the analysis of the results. Firstly, the
normal distribution of the data for all the quality
characteristics and sub-characteristics was checked
in order to ensure their validity. As previously
mentioned, the aim of this research was the
determination of the possible boundaries and scales
of the measurement data, so as to define in an easy
and non-subjective way which quality characteristics
of an e-commerce system have high or low scores.
In other words, the measurement data must be
grouped in different clusters that characterize how
good or bad a system is. In order to define these
clusters, three alternative approaches could be
followed: a) setting a priori the values that define the
boundaries of the clusters, even before conducting
the experimental measurements to the number of e-
commerce systems used in this research, b) setting
these values with the use of percentages of the
measurement results and c) estimating these values
by judging from the measurement results themselves
and their possible distribution to clusters.
Although all of the alternative approaches of
analyzing the data are acceptable, the third one was
chosen, since it provides more representative rates.
Moreover, the analysis of the data showed that they
were clearly distributed in different clusters. In this
way the desired boundaries of the different scales for
each quality characteristic were defined with more
accuracy. Following this approach in the analysis,
these boundaries can be defined regardless of the
number of the e-commerce systems that were
measured in this research.
The benefits of this analysis are noticeable. First
of all, it provides an easy and non-subjective way to
rank an e-commerce system according not only to
the overall quality, but for each quality characteristic
or sub-characteristic as well. In this way, it
obviously shows which corrective actions may be
followed to improve the quality of the system.
Moreover, using this analysis, developers are able to
determine the e-commerce characteristics on which
they must focus, in order to achieve a desired value
for the quality of the system that they develop.
4 DATA ANALYSIS
By applying the model at 120 e-commerce systems,
measurement results were collected for the overall
quality, the quality characteristics and sub-
characteristics of the presented method. The
measurement results, as presented hereinafter,
correspond with the node probability values offered
from the method’s tool for the state “Good”. The
entire set of probability values for all states can be
found in the web site of the Software Quality
Research Group of the Hellenic Open University
(SQRG-HOU, 2004).
The results for the overall quality were
distributed normally and are presented in Table 1
(Normality test Kolmogorov-Smirnov Significance
level(Nom. test K-S s.l.)= 0.1; Mean (m)=0.56;
Standard deviation(Std)= 0.24), and they were
distinguished in 3 categories A, B, C.
• Category A includes a small number of
measurement values because in this category
were included the e-commerce systems that
satisfy strict criteria for the overall quality, the
quality characteristics and sub-characteristics.
And as the nature of the e-commerce system is
to give emphasis to some of the above quality
characteristics it is extremely difficult to
achieve high measurement results in all sub-
characteristics.
• Category B comprises e-commerce systems that
satisfy a number of criteria for the overall
quality. Although these systems appear to have
an acceptable probability value for quality,
corrective actions can be followed in order to
ICETE 2004 - GLOBAL COMMUNICATION INFORMATION SYSTEMS AND SERVICES
28

achieve a score as high as systems in category A
have.
• In category C were placed the e-commerce
systems that present low measurement results
for the overall quality and the other components
of the presented model.
Table 1: Measurement results for the overall quality
0,1632 0,2006 0,2036 0,2073 0,2100 0,2116
0,2211 0,2216 0,2226 0,2299 0,2387 0,2426
0,2558 0,2560 0,2690 0,2745 0,2754 0,2813
0,2848 0,2905 0,2954 0,2995 0,3000 0,3044
0,3051 0,3164 0,3169 0,3240 0,3247 0,3284
0,3396 0,3405 0,3437 0,3519 0,3537 0,3561
0,3572 0,3575 0,3750 0,3849 0,3907 0,3910
0,3935 0,4000 0,4079 0,4372 0,4500 0,4526
0,4595 0,5033 0,5088 0,5530 0,5549 0,5606
0,5768 0,5802 0,5921 0,6000 0,6000 0,6008
0,6047 0,6106 0,6118 0,6153 0,6155 0,6155
0,6256 0,6258 0,6264 0,6369 0,6461 0,6500
0,6602 0,6696 0,6732 0,6747 0,6830 0,6849
0,6926 0,7064 0,7210 0,7310 0,7352 0,7370
0,7371 0,7410 0,7536 0,7550 0,7553 0,7553
0,7559 0,7643 0,7643 0,7660 0,7715 0,7759
0,7777 0,7790 0,7870 0,7884 0,7978 0,7978
0,8000 0,8203 0,8303 0,8404 0,8478 0,8599
0,8965 0,8974 0,9002 0,9059 0,9190 0,9201
0,9300 0,9542 0,9813 0,9813 0,9837 0,9860
The distribution of the measurement results in
three categories was based on the clear separation,
which their values present. Analytically the
measurement results for the overall quality were
distributed in three clusters as is presented in the
histogram of Figure 2. Each cluster presented
minimum and maximum values that were used to
define the boundaries for the corresponding
category. The boundaries of each category were
defined by using the formula (1).
Category A, for the overall quality of e-
commerce systems comprises measurement values
where x>0.89, (Nom. test Shapiro-Wilk s.l= 0.1; m=
0.93; Std= 0.136). Category B comprises e-
commerce systems that present 0.55<x<0.89, (Nom.
test K-S s.l= 0.1; m= 0.69; Std= 0.185). Finally
category C comprises measurement values where x<
0.55 (Nom. test K-S s.l = 0.2; m= 0.32; Std= 0.082),
as it is presented at the histogram in Figure 3.
Quality
1,01
,96
,91
,86
,81
,75
,70
,65
,60
,55
,50
,45
,39
,34
,29
,24
,19
,14
10
8
6
4
2
0
Figure 2: Histogram for the overall quality.
,50,47,44,41,38,35,32,29,26,24,21,18
10
8
6
4
2
0
Figure 3: Histogram for category C of Quality.
This process has been applied for the quality
characteristics and sub-characteristics of the model
in order to define the boundaries for each of them. It
should be recorded that all measurement results for
quality characteristics, and sub-characteristics, were
distributed normally. For example the quality
characteristic of Efficiency comprises measurement
results (Norm. test K-S s.l= 0.1; m= 0.59; Std.=
0.29) that are presented in Figure 4 and were
distributed also in three categories A,B,C.
()
)1(
2
minmax
XX
X
+
=
EXPERIMENTAL BASED TOOL CALIBRATION USED FOR ASSESSING THE QUALITY OF E-COMMERCE
SYSTEMS
29

Analytically, the scale calibration of the quality
characteristics and sub-characteristics is presented in
Table 2.
Table 2: Scale calibration of quality characteristics.
Scale Calibration
Category A B C
Quality x>0,88 0,88>x>0,53 x<0,53
Functionality x>0,82 0,82>x>0,55 x<0,55
Security x>0,82 0,82>x>0,55 x<0,55
Interoperability x>0,93 0,93>x>0,80 x<0,80
Suitability x>0,83 0,83>x>0,46 x<0,46
Accuracy x>0,83 0,83>x>0,61 x<0,61
Reliability x>0,84 0,84>x>0,62 x<0,62
Fault Tolerance x>0,80 0,80>x>0,57 x<0,57
Maturity x>0,80 0,80>x>0,62 x<0,62
Recoverability x>0,84 0,84>x>0,62 x<0,62
Usability x>0,87 0,87>x>0,63 x<0,63
Attractiveness x>0,89 0,89>x>0,72 x<0,72
Learnability x>0,90 0,90>x>0,60 x<0,60
Understandability x>0,82 0,82>x>0,57 x<0,57
Efficiency x>0,90 0,90>x>0,39 x<0,39
Resource Behavior x>0,87 0,87>x>0,53 x<0,53
Time Behavior x>0,86 0,86>x>0,44 x<0,44
The scale calibration, which is represented in the
table, comprises three categories A, B, C. Figure 5
presents a measurement for category B of Reliability
(Norm. test Shapiro Wilk s.ll= 0.454>>0.05, m=
0.73, Std.= 0,06 ).
Efficiency
1,02
,97
,93
,88
,83
,79
,74
,69
,65
,60
,56
,51
,46
,42
,37
,32
,28
,23
6
5
4
3
2
1
0
Figure 4: Histogram for the Efficiency.
In Figure 6 category A of Usability (Norm. test
Shapiro Wilk s.l= 0.443>>0.05, m= 0.93, Std.= 0.3)
is also presented.
Figure 5: Histogram for category B of Reliability.
Figure 6: Histogram for category A of Usability.
The statistical analysis for the overall quality, the
quality characteristics and sub-characteristics were
offered in the quality’s research group web site
[SQRG-HOU, 2004].
5 THE PROPOSED METHOD
The proposed method’s tool can be used for the
assessment of e-commerce systems in order to
identify problematic or high quality applications or
modules. In detail, the tool provides probability
values for the overall quality, the quality
characteristics and sub-characteristics of an e-
commerce system. The meaning of each value can
be explained using the scale calibration table of the
method. In other words, in the forward use of the
method’s model a user is able to give evidence to the
leaf nodes in order to estimate the probability values
of each quality characteristic. Afterwards, by means
of Table 2, one can identify the cluster to which each
quality characteristic belongs. So, it is possible to
,821,789,757,725,693,661,629
8
6
4
2
0
,984,966,947,928,909,891
5
4
3
2
1
0
ICETE 2004 - GLOBAL COMMUNICATION INFORMATION SYSTEMS AND SERVICES
30
detect where an e-commerce system’s drawbacks
may exist in order to improve its quality.
Additionally, it is possible to define what should be
improved in an e-commerce system or where more
emphasis should be given in the system.
The proposed method provides a non-subjective
way of characterizing an e-commerce system
according to the quality characteristics with which
this method is concerned. The non subjective
character of the model means that a simple user of
this measurement tool is asked to define evidence in
a binary way by providing a simple ‘Yes’ or ‘No’.
Only the developer of the model defines the values
of the node probability table based on his/her
experience and his/her specialized knowledge.
In detail, the use of the proposed method can be
described as follows. For the leaf nodes the user
gives as an evidence a simple yes or no, whether a
specific e-commerce characteristic exists or not in
the system. For example, in the case of leafs “FAQs”
and “Shopping list”, the user can easily define if
they are available in the system or not. Knowing a
priori the boundaries of each cluster of the quality,
the mean value and the standard deviation, it is easy
to define the overall quality of the system.
Moreover, this process can be applied for each
quality characteristic or sub-characteristic. In this
way, one can identify which parts of the system need
improvement. As a result, one is able to determine
the specific corrective actions needed to be set in
order to improve the quality of an e-commerce
system.
This method can also be applied when
developing a new e-commerce system. In this case,
as the developers have already designed the
characteristics and functions that the system will
consist of, and know the preferences of the end-users
of the system, they can focus on specific quality
characteristics and improve them. Using the
method’s tool they must give more emphasis on the
e-commerce characteristics that relay the quality
characteristics they want. So, it could be possible to
develop an e-commerce system that will be
acceptable to end-users’ quality requirements.
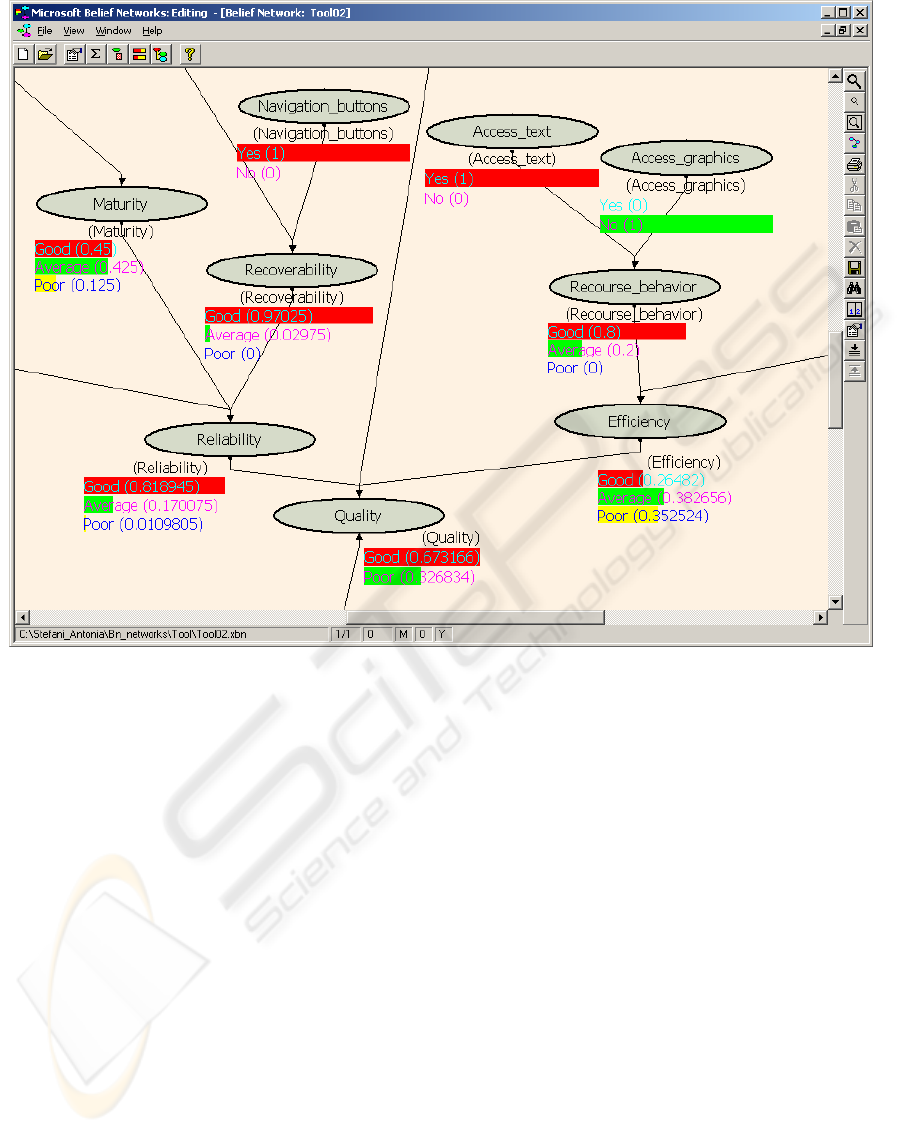
A screen shot of the method’s tool is showed in
Figure 7. This figure represents the probability
values of an e-commerce system that has been used
in the experiments of this research. Evidence has
been inserted in the leaf nodes of the tool, so as to
Figure 7: A screen shot of the method’s tool
EXPERIMENTAL BASED TOOL CALIBRATION USED FOR ASSESSING THE QUALITY OF E-COMMERCE
SYSTEMS
31

measure the probability values of all the
intermediate nodes.
6 CONCLUSIONS AND FUTURE
WORK
This paper presents a method to assess the quality of
e-commerce systems, which can also help
developers of such systems during the design phase.
It determines the boundaries and the scales of the
probability values of the method’s tool for all the
quality characteristics. This determination, which is
the main aim of the paper, was concluded from
experimental measurements to a number of e-
commerce systems and is presented in brief here.
The method’s tool and all the experimental
results derived from this research are available to
whoever wishes to conduct similar measurements.
Future work includes the collection of data from
corresponding experiments performed by other
researchers by means of this method. It also includes
the application of the method during the design
phase of an e-commerce system, and the analysis of
the results, which will be derived from it.
REFERENCES
ISO, 1991. Information technology - Evaluation of
software - Quality characteristics and guides for their
use. International Standard: ISO/IEC 9126.
Lohse, G, Spiller, P, 1998. Electronic Shopping Designing
online stores with effective customer interfaces,
Communications of the ACM.
Molla, A, Licker, P, 2001. E-Commerce Systems Success:
An Attempt to extend and respecify the Delone and
Maclean model of IS success, Journal of Electronic
Commerce Research
Nielsen, J, 2000. Designing Web Usability, The Practice
of Simplicity, New Riders Publishing, Indianapolis.
Offutt, M, 2002. Quality Attributes of Web Software
Applications, IEEE Software, March/April 2002
Schafer, B, Konstan, J, Riedl, J, 2001. E-Commerce
Recommendations Applications, Data Mining and
Knowledge Discovery.
Sherman, A, Karat, J, Karat, C, Brodie, C, and Vergo, J,
2003. User Attitudes Regarding a User-Adaptive e-
Commerce Web Site, User Modelling and User-
Adapted Interaction.
SQRG-HOU, 2004. Web site of the Software Quality
Research Group of the Hellenic Open University,
http://artemis.eap.gr/quality
Stefani, A, Xenos, M, 2001. A model for accessing the
quality of e-commerce systems. Panhellenic
Conference with International Participationin Human
Computer Interaction (PC-HCI-2001).
Stefani, A, Xenos, M, Stavrinoudis, D, 2003. Modelling
E-Commerce Systems’ Quality with Belief Networks.
In VECIMS 2003-International Symposium on Virtual
Environments, Human-Computer Interfaces, and
Measurement Systems. IEEE
Wilson, L, 2003. Designing an electronic commerce
interface: attention and product memory as elicited by
web design. Electronic Commerce Research and
Application.
ICETE 2004 - GLOBAL COMMUNICATION INFORMATION SYSTEMS AND SERVICES
32
