
MINING SCIENTIFIC RESULTS THROUGH THE COMBINED USE
OF CLUSTERING AND LINEAR PROGRAMMING TECHNIQUES
∗
Andrea Tagarelli, Irina Trubitsyna, Sergio Greco
DEIS - University of Calabria
87030 Rende, Italy
Keywords:
Data Mining, Clustering, DEA, Efficiency Measures.
Abstract:
The paper proposes a technique based on a combined approach of data mining algorithms and linear program-
ming methods for classifying organizational units, such as research centers. We exploit clustering algorithms
for grouping information concerning the scientific activity of research centers. We also show that the replace-
ment of an expensive efficiency measurement, based on the solution of linear programs, with a simple formula
allows clusters of very good quality to be computed efficiently. Some initial experimental results, obtained
from an analysis of research centers in the agro-food sector, show the effectiveness of our approach, both from
an efficiency and a quality-of-results point of view.
1 INTRODUCTION
The high performance of organizational units, also
known as decision-making units, relies on good de-
cision support which can have a major impact on the
achievement of the goals of the unit. On the other
hand, the soundness of a decision usually reflects the
quality of the activities of the unit. For instance, a
decision made on a project in which a scientific re-
search center is involved could lead to an increasing
in the productivity of the research center itself, pro-
vided that such a project represents a relevant activity
from a scientific point of view.
The process of evaluating and comparing the per-
formances of organizational units is a challenging ap-
plication, in principle, for several research disciplines.
In particular, there is growing interest in measuring
the efficiency of organizational units involved in sim-
ilar activities, technologies and inputs. Moreover,
evaluating the productivity of research centers is use-
ful from the point of view of a careful deployment
of financial resources to the centers themselves: in-
tuitively, a research center with a high performance
may gain more economic benefits rather than other
research centers with lower quality scores.
∗
Work supported by a MURST grant under the project
“Sistemi informatici integrati a supporto del bench-marking
di progetti ed interventi ad innovazione tecnologica in
campo agro-alimentare”
Traditional efficiency measures are often inade-
quate due to the presence of multiple inputs and out-
puts related to different resources, activities and en-
vironmental factors. In many productive fields, the
methods of parametric and non-parametric evaluation
seem to be preferred with respect to the combined use
of traditional indicators. In fact, such methods pro-
vide a synthetic indicator of the productivity by si-
multaneously considering multiple inputs and outputs
of the productive process. As a consequence, they al-
low the comparison of the efficiency of a given orga-
nizational unit with respect to the frontier of the possi-
ble efficient solutions for all the organizational units.
The parametric methods (DFA, SFA) require the pre-
sumptive definition of the productive function, while
the non-parametric ones (DEA, FDH) are able to de-
termine the relative efficiency of organization units by
means of linear programming techniques. This is an
advantage, since the non-parametric methods permit
us to evaluate the performance of organization units
without any knowledge of their productive process.
The contribution of this paper is the definition of a
methodology for the classification of research centers
combining data mining techniques, such as clustering,
and linear programming techniques. The expected re-
sult is a system capable of organizing research centers
by considering information about the volume and the
quality of their scientific activity. We study how to ex-
tract and represent both scientific results and perfor-
84
Tagarelli A., Trubitsyna I. and Greco S. (2004).
MINING SCIENTIFIC RESULTS THROUGH THE COMBINED USE OF CLUSTERING AND LINEAR PROGRAMMING TECHNIQUES.
In Proceedings of the Sixth International Conference on Enterprise Information Systems, pages 84-91
DOI: 10.5220/0002624000840091
Copyright
c
SciTePress

mance information from research centers. Then, we
exploit clustering algorithms to accomplish the task
of organizing such information, and evaluate the cor-
responding accuracy of the proposed approach.
The remainder of this paper is organized as follows.
The next section is a short overview of the clustering
process in a suitable way to our purposes. Section 3
presents DEA, a linear programming based technique
for measuring the efficiency of organizational units.
Section 4 illustrates the overall architecture and the
features of a system for the classification of research
centers. Section 5 describes a methodology for or-
ganizing research centers based on models comput-
ing their efficiency. In Section 6 proposes an alterna-
tive way to compute the efficiency of research centers;
this section ends reporting the experimental evalua-
tion stating the effectiveness of our approach. Finally,
Section 7 contains concluding remarks.
2 DATA CLUSTERING
Clustering is the task of organizing a collection of
objects (whose classification is unknown) into mean-
ingful or useful groups, called clusters, based on the
interesting relationships discovered in the data. The
goal is that the objects within a cluster will be highly
similar to each other, but will be very dissimilar from
objects in other clusters. The greater the homogene-
ity/heterogeneity within/between groups, the better
the resulting partition of clusters.
A first stage in a typical clustering task is the defi-
nition of a model to represent the objects, drawn from
the same feature space. Typically, an object is repre-
sented as a multidimensional vector, where each di-
mension is a single feature. Formally, given an m-
dimensional space, an object x is a single data point
and consists of a vector of m measurements: x =
(x
1
, . . . , x
m
). A set of n objects X = {x
1
, . . . , x
n
}
to be clustered is in the form of an object-by-attribute
structure, i.e. an n-by-m matrix. The scalar compo-
nents x
i
of x are called features or attributes.
Many different clustering algorithms can be ex-
ploited (Jain and Dubes, 1988). Partitional and hi-
erarchical clustering techniques are by far the most
popular and important ones. In this work, we exploit
the well-known k-Means partitional algorithm which
has the main advantage of requiring O(n) compar-
isons and guarantees a good quality of clusters. The
algorithm starts by randomly choosing k objects as
the initial cluster centers. Then it, iteratively, reas-
signs each object to the cluster to which it is the clos-
est, based on the proximity between the object and the
cluster center until a convergence criterion is met.
The definition of a proximity measure between ob-
jects is crucial in the clustering. Object proximity is
assessed on the basis of the attribute values describ-
ing the objects, and is usually measured by a distance
function or metric. The most commonly used met-
ric, at least for ratio scales and continuous features,
is the Minkowski metric, defined as d
M
(x
i
, x
j
) =
(
P
m
h=1
|x
ih
− x
jh
|
p
)
1/p
= k(x
i
− x
j
)k
p
, which is
a generalization of the popular Euclidean distance,
obtained when p = 2. Higher p values increase
the influence of large differences at the expense of
small differences and, from this point of view, the Eu-
clidean distance represents a good trade-off. It works
well when the objects within a collection are natu-
rally clustered in compact and convex-shaped groups,
and it is exploited to define the squared-error crite-
rion, which is the most intuitive and frequently used
criterion function in partitional clustering algorithms.
The squared-error criterion computes the sum of the
squared distance of each object from the center of
the cluster, and tries to make the resulting clusters as
compact and as separate as possible.
Quality in clustering deals with questions like how
well a clustering scheme fits a given dataset, and
how many groups partition the analyzed data. Three
approaches are adopted to investigate cluster valid-
ity (Halkidi et al., 2002): external criteria, internal
criteria, and relative criteria. A pre-specified struc-
ture, which reflects our intuition about the clustering
structure of the dataset, is exploited by external cri-
teria to evaluate a clustering. Internal criteria are de-
fined over quantities that involve the representations
of the data themselves (e.g. proximity matrix). The
basic idea of the latter approach is instead the com-
parison of different clustering schemes resulting from
the same algorithm but with different parameter val-
ues.
Our choice falls back on external criteria, since it
is particularly convenient, for our purposes, to mea-
sure the degree to which a dataset confirms an a-priori
specified scheme.
3 DEA TECHNIQUE
Data Envelopment Analysis (DEA) is a linear pro-
gramming technique that has been frequently ap-
plied to assess the efficiency of decision-making units
(hereinafter called DMUs), where the presence of
multiple inputs, as well as outputs, makes compar-
isons difficult.
The measurement of relative efficiency was ad-
dressed in (Farrell, 1957) and developed in (Farrell
and Fieldhouse, 1962), focusing on the creation of
a hypothetical efficient unit, as a weighted average
of efficient units, to act as a comparator for an in-
efficient unit. The first DEA model was introduced
in (Charnes et al., 1978) and its extents were used for
MINING SCIENTIFIC RESULTS THROUGH THE COMBINED USE OF CLUSTERING AND LINEAR
PROGRAMMING TECHNIQUES
85

measuring and comparing the efficiency of local au-
thority departments, schools, hospitals, shops, bank
branches and similar entities with homogeneous sets
of units (Chung et al., 2000; Zhu, 2002; Charnes et al.,
1994; Stern et al., 1994; Thanassoulis et al., 1987). In
the Data Mining context, (Sohn and Choi, 2001) pro-
poses using DEA in order to find the weights involved
in multi-attribute performances of classifiers in a data
ensemble algorithm. A recent bibliography of DEA
including applications can be found in (Emrouznejad,
2001).
DEA is a non-parametric technique, in the sense
that it does not require any assumption about the func-
tional form relating the independent variables to the
dependent variables. By contrast, the efficiency of
each DMU is computed as the ratio of a weighted
sum of outputs and a weighted sum of inputs, where
the weight sets are different for distinct DMUs and
have to be selected to maximize the efficiency of each
DMU.
The selection of the attributes and their partition,
as input and output parameters, play a crucial role in
the definition of a DEA model. In other terms, a DEA
model involves not only the choice of individual at-
tributes, but also deciding whether an attribute will be
treated as an input or an output parameter.
A DEA model can hence be formally stated as fol-
lows. Given N DMUs with I inputs and O outputs,
let x
ij
and y
oj
be, respectively, the i-th input and
the o-th output of DMU j, and let v
ij
and w
oj
be
the corresponding weights, where j ∈ {1, . . . , N},
i ∈ {1, . . . , I}, o ∈ {1, . . . , O}. The efficiency E
j
of a given DMU j can be obtained by solving the fol-
lowing linear program:
max E
j
=
P
O
o=1
w
oj
y
oj
P
I
i=1
v
ij
x
ij
subject to
P
O
o=1
w
oj
y
ol
P
I
i=1
v
ij
x
il
≤ 1
w
oj
, v
ij
≥ ε
where l ∈ {1 · · · N }, i ∈ {1 · · · I}, o ∈ {1 · · · O}.
The variables of the above problem are the weights
that have been chosen to maximize the efficiency of
a given DMU j. The first constraint represents the
upper bound for the efficiency of all DMUs com-
puted with the current weights. The second con-
straint, where ε is a positive value close to 0, avoids
that an input or an output is totally ignored in deter-
mining the efficiency.
If E
j
= 1 then DMU j is efficient with respect to
other DMUs, otherwise there is some other more ef-
ficient DMU, even if the weights have been chosen in
favor of DMU j. In fact, the solution technique at-
tempts to make the efficiency E
j
as large as possible.
The search procedure stops when some DMU hits the
upper bound of 1. Thus, for an inefficient DMU at
least another unit will be efficient with the given set
of weights.
The flexibility in the choice of weights is both a
weakness and a strength of this approach. It is a weak-
ness because in some cases the evaluation can be more
affected by the choice of the weights than by the at-
tribute values of DMUs; on the other hand, the in-
dependence of the weights is a strength because the
evaluation of DMUs’ inefficiency is definitive as the
most valuable weights have been chosen.
4 A SYSTEM FOR CLASSIFYING
DMUs
We present a system for the classification of research
centers based on different parameters involving sci-
entific results and efficiency indicators. For this pur-
pose, the system combines clustering algorithms and
linear programming techniques. It takes in input ag-
gregate information, stored in the source database,
concerning the scientific activity of research centers
and, in particular, aggregate data involving any prod-
uct concerning scientific activities, such as publica-
tions, projects, citations, and patents. As the num-
ber of scientific publications and citations are abso-
lute values, not actually useful without a comprehen-
sive point of reference, some scientometric indicators
(see Section 4.1) need to be taken into account.
The global classification process is reported in Fig-
ure 1 and consists of three main steps implemented by
the following modules:
1. Indicator computation – This module takes in input
the source aggregate information about research
centers and computes some scientometric indica-
tors on the volume and quality of the scientific ac-
tivity of research centers. The output of this mod-
ule is merged with the source database.
2. Efficiency evaluation – The efficiency evaluation
is based on a given model which exploits both
source aggregate information and scientometric in-
dicators. Such a model is usually defined as a DEA
problem. In this case, the efficiency is computed as
the result of the objective function of a DEA linear
program. For each research center, the computed
efficiency value is merged with the scientometric
indicators and the source information.
3. Clustering – This module provides an organization
of DMUs into homogeneous groups according to
both source and derived information.
Note that in the computation of the efficiency of
DMUs we also used a model selecting from the set of
attributes the input parameters and the output parame-
ters. In Section 5, we will show how different models
(i.e. different selections of attributes) lead to different
behavior which could lead to different classifications
of research centers.
ICEIS 2004 - ARTIFICIAL INTELLIGENCE AND DECISION SUPPORT SYSTEMS
86
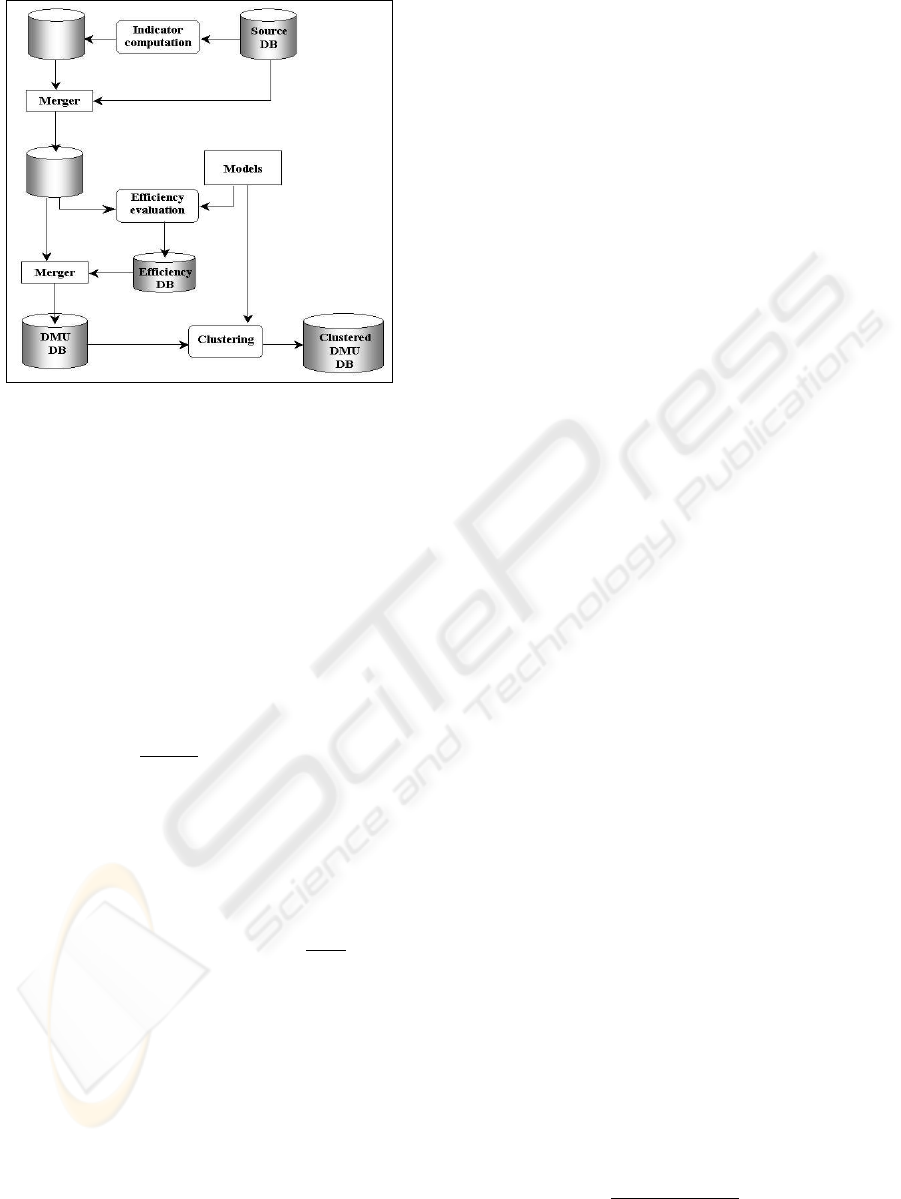
Figure 1: The research center analysis system.
4.1 Scientometric indicators
Scientometric indicators (Schubert, 1988; Galante et
al., 1998; Okubo, 1997) aim at measuring the output
of scientific and technological research through data
derived not only from scientific literature but from
patents as well. We used two scientometric indica-
tors concerning scientific publications and citations
and defined as follows.
Definition 1 Let S be a set of scientific publications,
r be a research center, and c be a scientific discipline.
The Activity Index of r with respect to a category c is
defined as AI
c
r
=
P
c
r
/ P
c
P
r
/ P
, where P
c
r
is the number
of publications of r belonging to category c, P
c
is the
total number of publications belonging to category c,
P
r
is the number of publications of r, and P is the
total number of publications in S. ¤
Definition 2 Let r be a research center, y be a fixed
year, and S be a set of scientific publications related
to r in the year y. The Relative Citation Rate (RCR)
of r in the year y is defined as RCR =
Q / J
F/ J
, where
J is is the number of publications contained in S, Q
is the number of citations received by publications in
S in the years y, y + 1, y + 2, and F is the sum of
Impact Factors of journals publishing each item in S
r
in y. ¤
The journal Impact Factor is a measure of the fre-
quency with which the “average article” in a journal
has been cited during a given year. As a consequence,
RCR provides a measure of the incoming citations for
all items in S with respect to the expected citations.
The above two indicators, together with information
contained in the source database, will be used to com-
pute the efficiency.
4.2 Efficiency Evaluation
As described in Section 3, a suitable way to com-
pute the efficiency of DMUs is to solve a system of
DEA linear programs (one for each DMU) according
to a given model stating the relevance of source ag-
gregate information and indicators. The results of the
DEA problems consist of the values assigned to the
weights which maximize the objective functions (i.e.
efficiency of DMUs). In the following, we will de-
fine different DEA models each of which is based on
different selections of attributes that will be used, re-
spectively, as input and output parameters.
In order to apply linear programming methods, a
DEA problem needs to be converted into a linear
form. This can be obtained by setting the denominator
of the objective function equal to a constant (e.g. 1)
and maximizing its numerator. The resultant DEA
problem for a given DMU j is defined as follows:
max E
j
=
P
O
o=1
w
oj
y
oj
subject to
P
I
i=1
v
ij
x
ij
= 1
P
O
o=1
w
oj
y
ol
−
P
I
i=1
v
ij
x
il
≤ 0
w
oj
, v
ij
≥ ε
where l ∈ {1 · · · N }, i ∈ {1 · · · I}, o ∈ {1 · · · O}.
Note that the introduction of the first constraint, that
normalizes the weighted sum of inputs, leads to the
transformation of the problem in linear form.
4.3 Clustering of DMUs
Clustering of DMUs aims at identifying homoge-
neous groups of DMUs similar from the scientific ac-
tivity point of view. Formally, the problem can be
stated as follows: given a set U = {u
1
, . . . , u
N
} of
DMUs, find a suitable partition P = {C
1
, . . . , C
k
} of
U in k groups such that each group contains a homo-
geneous subset of DMUs.
In our context, the notion of homogeneity can be
measured by exploiting, as attributes of DMUs, the
information previously presented. Each DMU is re-
presented as a multidimensional vector (Baeza-Yates
and B. Ribeiro-Neto, 1999). Moreover, to our pur-
poses it is particularly convenient to adopt a Eu-
clidean metric, since all the attributes have numeric
values. However, if the Euclidean metric is used
directly, some attributes (such as the ones corre-
sponding to absolute indicators) can exhibit a domi-
nant effect over other ones that have a smaller scale
of measurement. In order to avoid this, for each
DMU j we normalize all the attribute values to fall
within the range [0,1]. For each attribute z
pj
, the
corresponding attribute with normalized value is de-
fined as a
pj
=
z
pj
−min(z
p
)
max(z
p
)−min(z
p
)
, where z
pj
∈
{x
1j
, . . . , x
Ij
, y
1j
, . . . , y
Oj
, E
j
} is the actual value of
the p-th attribute of DMU j, z
p
= {z
p1
, . . . , z
pN
} is
MINING SCIENTIFIC RESULTS THROUGH THE COMBINED USE OF CLUSTERING AND LINEAR
PROGRAMMING TECHNIQUES
87

the set of values assigned to the same attribute of dis-
tinct DMUs, and max(z
p
) and min(z
p
) compute, re-
spectively, the maximum and the minimum value over
all DMUs.
5 CLASSIFICATION OF
RESEARCH CENTERS
Data Description
Our source database is composed of data related to
research centers in the agro-food sector. In par-
ticular, we have collected more than 3600 projects
and 8800 scientific publications, covering the period
1983-2000. We have also collected 2000 European or
international patents, mostly those of 1999. Informa-
tion about patents come from the PATLIB Center, an
Italian information center for patents, whereas infor-
mation about projects and scientific publications has
been retrieved mostly through the CORDIS (Commu-
nity Research and Development Information Service)
site. In addition, we obtained information on about
15000 scientific publications with their bibliographic
references, related to the years 1998, 1999 and 2000.
For each research center r we extracted and stored
information which comprise the attributes described
in Table 5.
Table 1: Attributes of research centers.
attribute description
NPrj Nr. of projects in which r is involved
NPub Nr. of scientific publications financed by r
NPat Nr. of patents financed by r
NCit Nr. of incoming citations of publications
financed by r
AI AI value for r
RCR RCR value for r
DEA models
In order to measure the efficiency of research cen-
ters we defined different DEA models, by considering
different combinations of input and output attributes.
The models used in our experiments are reported in
Table 5, where we considered related attributes once
(e.g. we considered either NPub or AI and either
NCit or RCR). Observe that two models (M
7
and
M
8
) take in input the efficiency computed by other
models (M
1
and M
2
).
It is worth noticing that the models differently de-
fine the input and the output parameters used in the
DEA linear programs. For instance, in the first model
Table 2: Models for efficiency evaluation.
model input param. output param.
M
1
[ NPrj ] [ NPub, NPat ]
M
2
[ NPrj ] [ AI, NPat ]
M
3
[ NPrj ] [ NPat, NPub, NCit ]
M
4
[ NPrj ] [ NPat, AI, RCR ]
M
5
[ NPrj ] [ NCit, NPub ]
M
6
[ NPrj ] [ RCR, AI ]
M
7
[ E(M
1
), NPub ] [ NCit ]
M
8
[ E(M
2
), AI ] [ RCR ]
(M
1
), we measured the efficiency of the research cen-
ters that have been involved in projects, evaluating
their productivity in terms of patents and scientific
publications. In the last two models we tried to as-
sess efficiency variations of organizations during the
time period by using a global efficiency measure (e.g.
E(M
1
) and E(M
2
)) and the parameters related to the
number of citations (e.g. N Cit and RCR).
Clustering results
DMUs could be clustered on the basis of their effi-
ciency computed using the DEA technique. DEA usu-
ally provides good results because it assesses the rela-
tive efficiency values by choosing the favorite weight
sets for each DMU. However, in some cases, the
evaluation can be more affected by the choice of the
weights than by the attribute values of DMUs. Con-
sider, for instance, two clusters based on the efficiency
values calculated by model M
6
reported in Table 5.
Observe that the partition is quite good, but the first
cluster, which is characterized by high efficiency val-
ues, contains an outlier, DMU 7, whose scientific fea-
tures are very close to the second cluster. In this case,
very low input values (for the attribute N P rj) mis-
leadingly result in a high efficiency value.
Table 3: Classification of DMUs based on M
6
model.
DMU NPrj RCR AI E
... ... ... ... ...
70 0.001 0.501 0.410 0.722
96 0.001 0.257 0.562 0.828
9 0.001 0.600 0.501 0.877
39 0.001 1.000 0.480 1.000
7 0.001 0.098 0.740 1.000
... ... ... ... ...
42 0.023 0 0.794 0.267
65 0.015 0 0.659 0.296
... ... ... ... ...
The above observation suggest a different classifi-
cation of DMUs where the clustering algorithm takes
into account, other than the efficiency computed by
ICEIS 2004 - ARTIFICIAL INTELLIGENCE AND DECISION SUPPORT SYSTEMS
88

means of DEA technique, also source aggregate data
and scientometric indicators. We performed the k-
Means algorithm on several experiments trying dif-
ferent k combinations for each model defined previ-
ously. As an example, in the portion of data reported
in Table 5 we considered all the attributes together
with the efficiency value. The clustering of DMUs,
under the model M
6
, assigned DMU 7 to cluster 7 in-
stead of cluster 4. This solution is more appropriate as
DMU 7 is very close to the other DMUs in cluster 7,
whereas the degree of similarity between DMU 7 and
DMUs belonging to cluster 4 is very low.
Table 4: Clustering of DMUs based on M
6
model.
DMU NPrj RCR AI E cluster
... ... ... ... ... ...
70 0.001 0.501 0.410 0.722 4
96 0.001 0.257 0.562 0.828 4
9 0.001 0.600 0.501 0.877 4
39 0.001 1.000 0.480 1.000 4
... ... ... ... ... ...
42 0.023 0 0.794 0.267 7
65 0.015 0 0.659 0.296 7
7 0.001 0.098 0.740 1.000 7
... ... ... ... ... ...
To sum up, the proposed technique for classify-
ing research centers on the basis of their performance
consists in two main steps: i) efficiency evaluation,
which is performed using DEA based techniques, and
ii) clustering of DMUs, which considers the efficiency
values together with other model attributes. The first
step provides a value that expresses the relative per-
formance for each research center, while the second
one acts as a further refinement through the classifi-
cation of research centers so that DMUs with similar
efficiency values can be assigned to different clusters.
In some sense, this process is similar to the identifica-
tion of relevant web pages (corresponding to DMUs
with high efficiency values) and the identification of
web communities (clusters of web pages with high
numbers of co-citations
1
). Obviously, if we derive
large clusters, the clustering process can be further
refined by applying the algorithm to the distinct clus-
ters.
6 APPROXIMATE EFFICIENCY
MEASURE
The problem in measuring the efficiency with the
above approach is that the DEA technique can be
computationally expensive and cannot be applied to
1
Two web pages are “similar” if there is a significant
number of pages containing links to both of them.
large datasets such as those currently used in Data
Mining. In fact, the computation of the efficiency
of DMUs consists in the resolution of N DEA linear
programs whose solutions give us a suitable combina-
tion of weights that maximizes the objective function.
DEA is good at estimating the “relative” efficiency
but not the “absolute” efficiency of DMUs; it can tell
you how well you are doing compared to your peers
but not compared to a “theoretical maximum”.
As said before, a crucial issue in DEA problems
is the computational complexity. To address such an
issue, we propose an alternative way to compute the
efficiency of DMUs. Our idea is to define an approx-
imation of the DEA-efficiency measure, by simply
considering the objective function of a DEA model
(provided that suitable weights are given), and then
normalizing all the attributes as explained in Sec-
tion 4.3. Formally, our approximate efficiency mea-
sure is defined as:
η
j
=
P
O
o=1
w
o
y
oj
P
I
i=1
v
i
x
ij
In order to minimize |E
0
j
− η
0
j
|, where E
0
j
and η
0
j
de-
note the normalized values of E
j
and η
j
respectively,
suitable weight sets for the computation of η
j
have to
be found.
6.1 Weight assignments
For each model M , obtained by selecting a set of I
input attributes and a set of O output attributes, we
defined the input assignment set, denoted by V , as
the list of values assigned to the weights of the input
attributes; in an analogous way, we defined the output
assignment set, denoted by W .
Note that, since η has a fractional form and η
0
de-
notes the normalized value of η, some weight assign-
ments can provide the same values of η
0
. In such
a case we say that the two weight assignments are
equivalent.
Definition 3 Two weight assignments Φ
1
= [V
1
, W
1
]
and Φ
2
= [V
2
, W
2
], used to compute the approximate
efficiency measures η
1
and η
2
respectively, are equi-
valent if η
0
1
= η
0
2
. ¤
Moreover, a sufficient condition to assess the
equivalence of two assignments is the proportionality
respectively between input and output weight values.
Formally, this can be stated by the following proposi-
tion:
Proposition 1. Two weight assignments Φ
1
and Φ
2
are equivalent if
V
1
i
V
2
i
= c
1
, ∀i ∈ {1, . . . , I} and
W
1
o
W
2
o
= c
2
, ∀o ∈ {1, . . . , O}, where c
1
e c
2
are con-
stants. ¤
MINING SCIENTIFIC RESULTS THROUGH THE COMBINED USE OF CLUSTERING AND LINEAR
PROGRAMMING TECHNIQUES
89
As a consequence, we have the subsequent corol-
lary:
Corollary 1 For each assignment Φ = [V, W ] there
exists a corresponding equivalent assignment
ˆ
Φ =
[
ˆ
V ,
ˆ
W ] such as
ˆ
V [1] = 1 and
ˆ
W [1] = 1. ¤
From a practical point of view, the above corollary
means that we can perform a comparative analysis by
setting an element of
ˆ
V and an element of
ˆ
W to 1, and
then trying different combinations for the remaining
attribute weights. Thus, the number of parameters is
reduced to I + O − 2.
6.2 Experimental results
To evaluate the effectiveness of our approximate effi-
ciency measure, we carried out a comparative anal-
ysis trying different combinations for the attribute
weights. We performed experiments on two differ-
ent datasets, containing respectively 540 and 134 re-
search centers. We have used the models M
1
and M
2
for the largest dataset and the other models for the
smallest dataset. Table 6.2 shows two different value
assignments for the attribute weights, for each model.
The vectorial notation matches the list of attributes
selected for each model (see Table 5).
Table 5: Best settings of attribute weights.
model Φ
1
Φ
2
M
1
[1], [1, 1] [1], [1, 0.01]
M
2
[1], [1, 1] [1], [1, 0.001]
M
3
[1], [1, 1, 1] [1], [1, 0.1, 0.1]
M
4
[1], [1, 1, 1] [1], [1, 0.1, 0.1]
M
5
[1], [1, 1] [1], [1, 0.001]
M
6
[1], [1, 1] [1], [1, 0.1]
M
7
[1, 1], [1] [1, 0.001], [1]
M
8
[1, 1], [1] [1, 0.001], [1]
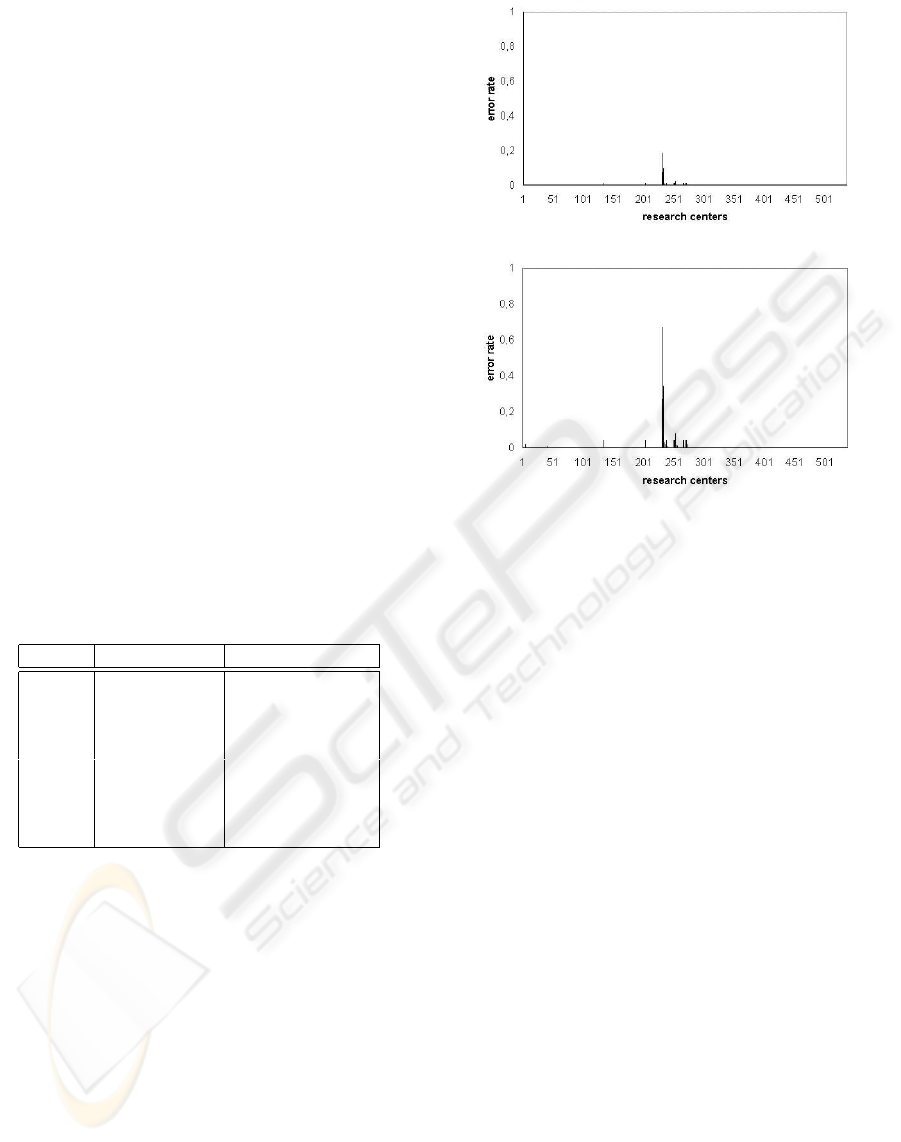
Figure 2 shows a comparison of the η measure with
respect to DEA-efficiency measure (i.e. |E
0
j
− η
0
j
|)
relative to the model M
1
. As we can see, high er-
ror peaks are very few, whereas most of the error val-
ues are below 0.2 and such a behavior is also con-
firmed for the remaining models. Thus, the η mea-
sure works as a good approximation of the DEA-
efficiency. Moreover, we can take advantage of the
fact that an approximate efficiency measure, such as
η, allows an optimal trade-off between accuracy and
efficiency, since its computation is not as expensive as
solving a DEA problem.
6.3 Clustering quality results
To evaluate the outcome of a clustering process, it is
important to check whether the computed clusters can
(a)
(b)
Figure 2: Error rates of η measure with respect to DEA-
efficiency measure (|E
0
j
− η
0
j
|), according to Φ
1
(a) and Φ
2
(b) weight combinations.
be considered as of good quality. This can be done by
comparing the clusters with an ideal categorization of
DMUs. In our context, an ideal partition is defined
as the result of the clustering algorithm applied to a
given set of DMUs whose attributes include the DEA-
efficiency measure together with source aggregate in-
formation and scientometric indicators.
In the experiments, our aim was to compare the
ideal categorization Π = {γ
1
, . . . , γ
h
}, of a set U of
DMUs, to a clustering scheme P = {C
1
, . . . , C
k
} of
a set U
0
, where U
0
was derived from U by replacing all
DEA-efficiency values with the corresponding η effi-
ciency values. The quality of P with respect to Π can
be evaluated by exploiting several quality measures.
In this work, we used the standard F -measure (Baeza-
Yates and B. Ribeiro-Neto, 1999): higher values of
the measure mean higher quality of clusters. Values
close to the range [0.7, 1] are typical of good clusters.
We performed several experiments for each model
with a different number of clusters. Figure 3 contains
the summarized information for the case of 20 clus-
ters. The high values of F-measure suggest that our η
efficiency measure is a good approximation of DEA-
efficiency for all the models. Moreover, there exists
a model, M
7
, such that the approximated technique
provides the same results and this behavior is valid
for any number of clusters. This means that the DEA
ICEIS 2004 - ARTIFICIAL INTELLIGENCE AND DECISION SUPPORT SYSTEMS
90

Figure 3: Clustering quality results.
efficiency measure can be substituted with the approx-
imate measure, that improves the performance of our
technique. This is particularly important in the case
of large datasets.
It is important to note that while DEA techniques
are non-parametric (i.e. the weight of parameters is
computed by solving linear systems), in the computa-
tion of the approximate efficiency we have to assign
a weight to the parameters. Our experiments have
shown that the assignment of arbitrary weight values
(selected without knowing the productive function),
for some models, gives a good approximation of DEA
(e.g. model M
7
). In any case, in order to choose
a good set of values for the weights, we can com-
pare DEA and the approximate technique on small
datasets.
7 CONCLUSIONS
We have presented a technique for the classification of
organizational units, such as research centers, accord-
ing to information on the volume and the quality of
their scientific activity. Such information involves ag-
gregate data and scientometric indicators and allows
the computation of efficiency values for the produc-
tivity of research centers. We also proposed an alter-
native efficiency measure which exhibits a good ap-
proximation of DEA, but with the advantage of not
requiring the resolution of N linear programs. The
classification process, based on clustering algorithms,
was tested in several experiments, showing a high de-
gree of efficiency and effectiveness in the research
center context.
REFERENCES
Baeza-Yates, R. and Ribeiro-Neto, B. (1999). Modern
Information Retrieval. ACM Press Books, Addison
Wesley.
Charnes, A., Cooper, W. W., Lewin, A. Y., and Seiford,
L. M. (1994). Data Envelopment Analysis: Theory,
Methodology and Applications. Kluwer Academic
Publishers.
Charnes, A., Cooper, W. W., and Rhodes, E. (1978). Mea-
suring the efficiency of decision making units. Euro-
pean Journal of Operational Research 2, 429–444.
Chung, S. H., Yang, Y. S., and Wu, T. -H. (2000). Evaluat-
ing the Efficiency of University via DEA approach. In
Proc. 5th Annual Int. Conf. on Industrial Engineering
Theory, Applications and Practice.
Emrouznejad, A. (2001). An Extensive Bibliography of
Data Envelopment Analysis. Tech. Rep., Business
School, Univ. of Warwick,
Farrell, M. J. (1957). The measurements of productive effi-
ciency. J.R. Statis Soc., Series A 120, 253–281.
Farrell, M. J., and Fieldhouse, M. (1962). Estimating effi-
cient production functions under increasing returns to
scale. J.R. Statis Soc., Series A 125, 252–267.
Galante, E., Sala, C., and Lanini, I. (1998). Valutazione
della ricerca agricola, Franco Angeli (ed.), Milano.
Halkidi, M., Batistakis, Y., and Vazirgiannis, M. (2002).
Cluster Validity Methods: Sigmod Record 31(2), 40-
45.
Jain, A. K., and Dubes, R. C. (1988). Algorithms for Clus-
tering Data. Prentice-Hall advanced reference series.
Okubo, Y. (1997). Bibliometric indicators and analysis of
research systems: Methods and examples. OECD,
WP#1.
Schubert, A., Glaenzel, W., and Braun, T. (1988). Against
Absolute Methods: Relative Scientometrics Indicators
and Relational Charts as Evaluation Tools. Handbook
of Quantitative Studies of Science and Technology,
Van Ran A. F. J. (ed.), North-Holland, Amsterdam.
Sohn, S. Y., and Choi, H. (2001). Ensemble Based on Data
Envelopment Analysis. In Proc. Aspects of Data Min-
ing, Decision Support and Meta-Learning, 129–137.
Stern, Z. S., Mehrez, A., and Barboy, A. (1994). Academic
departments efficiency via DEA. Computers and Op-
erations Research 21(5), 543–556.
Thanassoulis, E., Dyson, R. G., and Foster, M. J. (1987).
Relative Efficiency Assessments using Data Envelop-
ment Analysis: an Application to Data on Rates De-
partments. J. Opl. Res. Soc. 38, 397–412.
Viveros, M. S., Nearhos, J. P., and Rothman, M. J. (1996).
Applying Data Mining Techniques to a Health Insur-
ance Information System. In 22th VLDB Conf., 286–
294.
Zhu, J. (2002). Quantitative Models for Performance Eval-
uation and Benchmarking: Data Envelopment Analy-
sis with Spreadsheets and DEA Excel Solver. Kluwer
Academic Publishers, Boston.
MINING SCIENTIFIC RESULTS THROUGH THE COMBINED USE OF CLUSTERING AND LINEAR
PROGRAMMING TECHNIQUES
91
