
TOWARDS VISUAL DATA MINING
François Poulet
ESIEA Recherche, 38, rue des Docteurs Calmette et Guérin, Parc Universitaire de Laval-Changé, 53000 Laval – France
Ke
ywords: Visual Data mining, Machine learning, Classification, Artificial Intelligence, Human Computer Interaction,
User Needs, Human factors.
Abstract: In this paper, we present our work in a new data mining approach called Visual Data Mining (VDM). This
new approach tries to involve the user (being the data expert not a data mining or analysis specialist) more
intensively in the data mining process and to increase the part of the visualisation in this process. The
visualisation part can be increased with cooperative tools: the visualisation is used as a pre- or post-
processing step of usual (automatic) data mining algorithms, or the visualisation tools can be used instead of
the usual automatic algorithms. All these topics are addressed in this paper with an evaluation of the
algorithms presented and a discussion of the interactive algorithms compared with automatic ones. All this
work must be improved in order to allow the data specialists to efficiently use these kinds of algorithms to
solve their problems.
1 INTRODUCTION
The size of data stored in the world is constantly
increasing (data volume doubles every 20 months
world-wide) but data do not become useful until
some of the information they carry is extracted.
Furthermore, a page of information is easy to
explore, but when the information reaches the size of
a book, or library, or even larger, it may be difficult
to find known items or to get an overview.
Knowledge Discovery in Databases (KDD) can be
defined as the non-trivial process of identifying
valid, novel, potentially useful, and ultimately
understandable patterns in data (Fayyad et al., 1996).
In this process, data mining can be defined as the
particular pattern recognition task. It uses different
algorithms for classification, regression, clustering
or association. In usual KDD approaches,
visualisation tools are only used in two particular
steps:
- in one of the first steps to visualise the data or data
distribution,
- in one of the last steps to visualise the results of the
data mining algorithm,
between these two steps, automatic data mining
algorithms are carried out.
The visual data mining approach replaces this
automatic algorithm by an interactive and graphical
one. Furthermore in this kind of user-centred
approach, the user is not a data mining specialist but
the data specialist, which brings (at least) the
following advantages:
- we can take into account the domain knowledge in
the whole process,
- the confidence and comprehensibility of the
obtained model are increased because the user is
involved in its construction,
- we can use the human pattern recognition
capabilities to overcome some computational costs.
Between these two kinds of approaches (the
automatic and the interactive ones) we can find
some mixed approaches trying to use the
visualisation in the KDD process more intensively.
For example, visualisation tools can be used in a
cooperative way with automatic tools, they can be
used as pre- or post- processing tools.
349
Poulet F. (2004).
TOWARDS VISUAL DATA MINING.
In Proceedings of the Sixth International Conference on Enterprise Information Systems, pages 349-356
DOI: 10.5220/0002639703490356
Copyright
c
SciTePress

We briefly summarise the content of the paper. In
section 2, we introduce a graphical data mining
environment we have developed. In section 3, we
describe two particular tools used in cooperation
with automatic ones. The first one is a graphical pre-
processing tool used to improve the results of
decision tree induction algorithms and the second
one is a graphical post-processing tool to explain the
results of widely used Support Vector Machine
algorithms. In section 4, we propose an interactive
classification tool and present some results of the
algorithm compared with automatic algorithm
results. Finally, in section 5, we discuss the
advantages and drawbacks of such an approach
before the conclusion and future work.
2 A GRAPHICAL DATA MINING
ENVIRONMENT
The graphical environment developed contains both
automatic and graphical, interactive tools (Poulet,
2002). In this section we will focus on the graphical
tools and the way they are managed in the
environment. In this environment, it is possible to
use simultaneously in the same window several
graphical tools. The first problem is to find a
efficient way of displaying several tools together.
We have chosen the same metaphor as in existing
Virtual Reality environments: a large wall (with n
displays along it) and a cube with (up to six)
displays on the different faces of the cube as shown
in figure 1. We have added a third (user-defined)
possibility.
Once the way the tools will be displayed has been
chosen, the user will have to choose the tools used.
Several graphical or automatic tools are available
today in our environment and it is possible to add
others easily.
Among the graphical tools the user can use are the
parallel coordinates (Inselberg et al., 2000), the
scatter-plot matrices, the different pixel oriented
techniques and all the visual data mining tools.
When several graphical tools are used
simultaneously, they are linked together. As shown
in figure 2, if an element is selected in one
visualisation tool, for example the 3D matrix on the
left, this selection is automatically extended to all
the tools displayed (in bold white). The other usual
interactions like zoom (in or out), rotations and
translations are also available for a single
visualisation tool or all the tools used.
The available automatic tools are both supervised
(CART, C4.5, OC1, SVM, etc) and unsupervised
classification tools (OPTICS, k-means, etc).
3 COOPERATIVE TOOLS
In this section we describe two cooperative tools we
have developed. The first one is used as a pre-
processing step of a decision tree induction
algorithm and the second one is a post-processing
tool used to visualise the results of SVM algorithms.
3.1 Graphical Data Pre-Processing
Decision tree algorithms are used in supervised
classification. The data have an a-priori label (called
the class) and the tree is built to separate the data
according to their classes. Most of the decision tree
algorithms can only perform univariate splits (ie
parallel to an axis). When the separating line
Figure 1: A CAVE-like display
Figure 2: Three linked tools along a wall
ICEIS 2004 - ARTIFICIAL INTELLIGENCE AND DECISION SUPPORT SYSTEMS
350

between two classes is not parallel to an axis, this
line is approximated by a set of alternately
horizontal and vertical lines like stairs. The resulting
tree has a lot of nodes and is difficult to understand.
Let us show an example of this problem with the
Drug dataset. We have used C4.5 on the original
dataset, the resulting accuracy is 91% with a tree
size of 19 nodes.
If we use a graphical display of the data with a
simple 2D scatter-plot matrix, we can see a
separating line between the grey elements on the left
and the other ones, as shown in figure 3. The user
interactively draws the separating line on the screen,
a new attribute is created: the distance from this line.
We can then display the same data with this new
attribute, the separating line is now parallel to an
axis.
Now if we try again to classify the dataset with this
new attribute with C4.5, the resulting accuracy is
100% with a tree size of 10 nodes.
The graphical data pre-processing has increased the
accuracy of the automatic algorithm used and the
comprehensibility of its results (with the reduction
of the tree size) with a nearly null cost.
3.2 Graphical Post-Processing
The other way to have cooperative tools is to use the
visualisation as a post-processing step of an
automatic algorithm.
Support Vector Machine (SVM) algorithms
proposed by (Vapnik, 1995) are a well-known class
of classification algorithms using the idea of kernel
substitution. They are widely used today and often
give high quality results (Bennett et al, 2000). In
their simplest mode, they try to find the best
separating hyper-plane between the elements of two
classes, i.e. furthest from both class +1 and class -1.
Most of the time the given results are the
classification accuracy and the equation of the
separating hyper-plane (a n-dimensional hyper-plane
if the dataset has n attributes). This result is difficult
to understand. Here we will use a graphical tool to
try to explain this result.
During the computation of the separating hyper-
plane, we also compute the distance to this hyper-
plane for each n-dimensional data-point. Then we
use a histogram to display the distribution of the
data-points according to their distance to the
separating hyper-plane for each class (the
misclassified points having negative values).
Figure 3: Interactive boundary drawing
Figure 4: The same dataset with the new attribute
-
1
+l
hyper
-
plane
Figure 5: Distribution of the datapoints
TOWARDS VISUAL DATA MINING
351

Then we link this histogram with a set of two-
dimensional scatter-plot matrices representing the
two-dimensional projections of the data on all
possible pairs of attributes. When we select any bar
of the histogram, the corresponding data-points are
highlighted in the two-dimensional projections. We
can visualise the points near the boundary or the
points in the "middle" of their class.
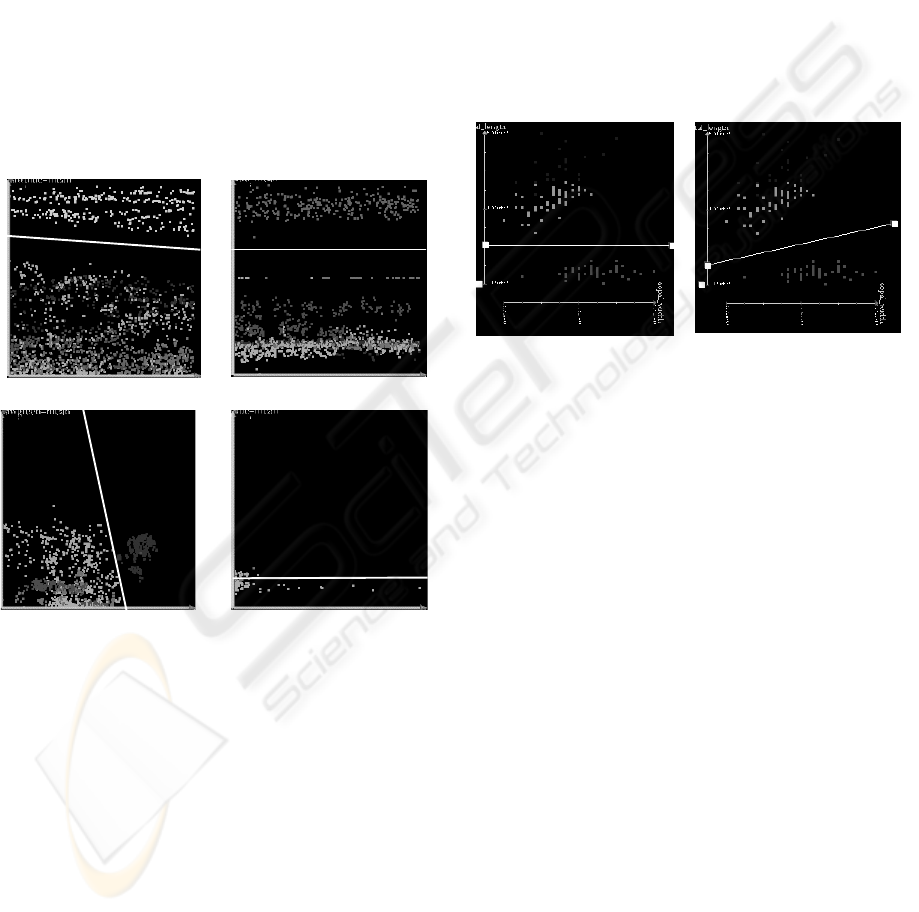
On the example shown in figure 6, we select the
misclassified points (negative values) nearest to the
separating hyper-plane in the histogram. The
corresponding points are highlighted in all the 2-
dimensional projections (one of them is selected and
represented with a larger size in the bottom right part
of the figure). The data set used is the Segment data
set from the "UCI Machine Learning Repository"
(Blake et al., 1998). Here the visualisation is used to
try to explain the results of an automatic data mining
algorithm. The algorithm presented is only able to
explain the linear kernel SVM results. We have
extended it in order to deal with any kind of kernel
function.
These two examples illustrate the interest of a
cooperative approach using both automatic and
graphical, interactive tools. The graphical tools can
be used either in a pre-processing or post-processing
step. They can improve the result comprehensibility
and the quality of automatic algorithms.
4 INTERACTIVE
CLASSIFICATION TOOL
In the previous section, we have seen how automatic
algorithms and interactive algorithms can cooperate
together. Here we give an example of an interactive
algorithm used instead of an automatic one. We first
present the algorithm and then we compare its
results with the results of similar automatic
algorithms.
4.1 CIAD: Interactive Decision Tree
Construction Algorithm
The basic idea of Visual Data Mining and more
especially here of interactive decision tree
construction algorithms is to replace the automatic
algorithm usually used (like C4.5, CART or OC1)
with an interactive and graphical algorithm. This
approach is often associated in a user-centred
approach (Poulet, 2002) with a new kind of intended
user: the data specialist and no longer a data mining
or analysis specialist. This new approach (the first
papers about this topic only appeared in 2000) has at
least the following advantages:
- the comprehensibility and confidence of the
constructed model are increased because the user has
participated in its creation,
- we can use the domain knowledge in the whole
process,
- we can use the human capabilities in pattern
recognition tasks to overcome some computational
complexities.
Figure 6: What are the misclassified data points?
Figure 7: 2D Scatter-plot matrices (Segment)
ICEIS 2004 - ARTIFICIAL INTELLIGENCE AND DECISION SUPPORT SYSTEMS
352
Our idea of interactive decision tree construction
was deduced from the use of the tool described in
section 3.1. This tool was used to interactively draw
a separating line on the screen between one class and
the other classes. The natural extension has been to
extend this method to the whole tree construction
(seen as a set of consecutive separating lines).
The starting point of the algorithm is the set of
scatter-plot matrices representing the two-
dimensional projections of the data according to all
possible pairs of attributes as shown in figure 7 with
the segment data set. One selected 2D scatter-plot
matrix is displayed in a larger size in the bottom-
right part of the display. This data set is made of
2310 data points in a 19-dimensional space with 7
classes. Once this visualisation tool is displayed on
the screen, the decision tree construction can start.
In the set of two-dimensional matrices we look for
the best pure partition: the largest area where one
class is alone (this class must be linearly separable
from the other). Then, interactively the separating
line between this class and the other existing ones is
drawn on the screen with the mouse and the
corresponding elements (belonging to the pure
partition) are removed from all the projections (they
are a leaf of the decision tree). This process is
iteratively repeated on the remaining elements.
Figure 8 shows the first four splits performed on the
segment data set. These four splits allow us to
classify perfectly four of the seven classes and to
remove 57% of the data. When no pure partition is
available, we try to find the best dominant partition
(an area where one class is dominant) or an area we
can split in a set of dominant partitions.
This is the description of the 100% manual mode of
the decision tree construction algorithm. Different
mechanisms are available to help the user in the
process.
The first one is used to optimise the boundary. When
the user interactively draws the line on the screen,
this line is automatically transformed into the best
separating line as shown in figure 9 (to perform this
action, we use a modified SVM algorithm to find the
best available 2D separating line).
On the left part of the figure is the boundary drawn
interactively by the user on the screen with the
mouse, the right part is the optimised separating line
computed by a modified SVM algorithm.
The other help mechanism is used when the user can
not visually find the best pure partition. Here again
we have used a modified SVM algorithm to compute
the best (2D-)separating line. This line is drawn on
the screen and the user has only to validate this
choice.
Compared to other existing decision tree
construction algorithms, our algorithm allows binary
splits (i.e. splits like y=ax+b) instead of usual unary
splits (x=a). The resulting tree size is often smaller
than these algorithms.
4.2 Extension to Interval-valued Data
The algorithm we have presented in the previous
section was the first version. It has been extended to
be able to deal with interval–valued data (Poulet,
2003). This kind of data is often used in polls (for
example for income or age). We only consider the
particular case of finite intervals. In order to use
interval data with CIAD, we must find what kind of
Figure 8: The first 4 splits performed on Segment
Figure 9: Optimisation of the separating line
TOWARDS VISUAL DATA MINING
353

graphical representation can be used in the scatter
plot matrices for two interval attributes and for one
interval attribute with a continuous one. In the latter
case, a segment (coloured according to the class) is
an obvious solution.
To represent two interval attributes in a scatter plot
matrix, we need a two-dimensional graphical
primitive allowing us to map two different values on
its two dimensions, the colour being the class.
Among the possible choices, there are a rectangle,
an ellipse, a diamond, a segment or a cross as shown
in figure 3. To avoid occlusion, we must use the
outline of the rectangle, the diamond and the ellipse.
The rectangle and the diamond will introduce some
bias when two rectangles (diamonds) overlap, and
this can become considerably more complicated if
we increase the number of overlapping rectangles or
diamonds. The final choice is the crosses because of
their lower cost to display.
We have created an interval-valued version of the
well-known iris dataset. We obtain a dataset made of
30 four-dimensional data-points, each dimension
being an interval-valued attribute. As shown in
figure 10, each "point" of this dataset is represented
with a cross. Once this new kind of data is
displayed, the interactive construction of the
decision tree can start. The method used is exactly
the same as for continuous values: we try to find the
best pure partition, etc. The help mechanisms are
also the same today, all the calculus is based on the
centre of the crosses instead of the points in the
continuous case.
4.3 Some Results
In this section we present some results of interactive
algorithms compared to automatic ones. We focus
on the continuous case because we have not found
any result concerning interval-valued data
classification.
Table 1: Description of the datasets used
Dataset Nb
Attr
Nb
items
Nb
classes
Method
Australian
14 690 2 10 fold-CV
Diabetes 8 768 2 12 fold-CV
Satimage 36 4,435 6 train-test
Segment 19 2,310 7 10 fold-CV
The datasets and the method used for measuring the
classification accuracy are summarised in table 1.
Table 2: Accuracy and tree size (#leaves)
Dataset
CART
C4.5 OC1
PBC
CIAD
Australian
96.8
(6)
84.4
(85)
85.9
(2)
82.7
(9)
86.7
(10)
Diabetes
78
(7)
78.1
(20)
82.2
(16)
79
(16)
77.2
(7)
Satimage
84
(19)
85.2
(563)
86
(16)
83.5
(33)
83.4
(14)
Segment
93.6
(15)
96.6
(77)
93.9
(10)
94.8
(21)
94.1
(16)
To compare our interactive decision tree
construction algorithm we have used another
interactive decision tree construction algorithm
called PBC (Ankerst et al., 1999), and three of the
most well-known and used automatic decision
algorithms: CART (Breiman et al., 1984), C4.5
(Quinlan et al., 1993) and OC1 (Murthy et al.,
1993). The results are presented in table 2, the first
line corresponds to the accuracy obtained while the
second line is the tree size (number of leaves). The
best result is in bold for each dataset.
To summarise these results, we can say interactive
algorithms have the same quality as automatic ones,
but the most important result is not shown in this
table; it is the comprehensibility of the results. We
discuss this topic in the next section.
Figure 10: Interval-valued iris dataset
ICEIS 2004 - ARTIFICIAL INTELLIGENCE AND DECISION SUPPORT SYSTEMS
354

5 DISCUSSION
As we have seen in the previous section, automatic
and interactive algorithms have nearly the same
results concerning the accuracy and the tree size, but
what about the comprehensibility of these results?
Let us take two examples. With the diabetes data set,
the best tree size is 2 leaves (OC1). The result of this
algorithm is a tree with only one split: a 14-
dimensional hyper-plane (with accuracy equal to
85.9%). OC1 performs real oblique cuts in the data
space. To get the same accuracy CIAD needs to
perform eight more splits, these splits are also
"oblique" cuts but they are only 2D-oblique cuts.
The hyper-plane obtained with OC1 is a 14-
dimensional one: the result is an equation such as:
a
1
.x
1
+ a
2
.x
2
+ ... + a
14
.x
14
+ a
15
= 0. How can we
interpret this result? A decision tree with merely
splits of the form y=ax+b or x=a is obviously more
understandable (especially if the user is not a data
mining or data analysis expert but the data expert).
The other interesting result is the one of C4.5 with
the satimage dataset: 85.2% accuracy with a very
large tree size. Here again there is one question we
can ask: how to interpret such a decision tree? Is not
it better to have a smaller tree with a lower
accuracy? (this is not an over-fitting problem we talk
about here). An advantage of interactive decision
tree construction algorithm is the fact that the user
can stop the decision tree construction when he
wishes to. He has only to make a leaf of the current
tree node instead of trying to divide it more and
more to have a better accuracy. Of course, this task
can also been achieved with automatic algorithms: it
is the role of the very important but so little
discussed parameters tuning. This parameters tuning
is a data mining or analysis expert's affair most of
the time.
These two examples illustrate some of the interests
of the visual data mining approach. But this kind of
approach has not only advantages and several
problems must be solved before it becomes really
useful for the data expert. Among these problems
are:
- the data expert has not necessarily enough
background in statistics, data-analysis or data-
mining to perform the correct choices during the
KDD process. A simple example is to find the best
algorithm to use according to the data set used and
the problem to solve. To address this problem it is
necessary to provide the user with help mechanisms
able to guide him in all the choices performed in the
KDD process. These mechanisms must be able to
deal with new data sets or new algorithms and must
learn from the new results obtained.
- all the visual data mining algorithms are based on a
graphical representation of the data. The size of the
data sets treated is limited by the screen size and the
human perception capacities. How do we deal with
very large data sets containing at least a billion n-
dimensional data points as automatic algorithms
already do (Poulet and Do, 2003)? One solution
could be to use a higher level representation of the
data instead of the data themselves. This is the topic
addressed by the symbolic data analysis (Bock and
Diday, 2000).
6 CONCLUSION AND FUTURE
WORK
All the tools presented in this paper have been
developed in C/C++ (on PC and SGI-O2) using only
open-source libraries. In this paper we have
presented some work trying to give a more
important part to the visualisation in the data mining
process. This can be achieved in several ways:
- in a cooperative approach with visualisation and
automatic tools working together for example to
improve the results or comprehensibility of
automatic algorithms with a graphical pre- or post-
processing step,
- by replacing the automatic algorithm usually used
by interactive ones, like the interactive decision tree
construction algorithm presented.
The most important fact in this approach is that the
user of the system is the data specialist and no
longer the data mining or data analysis expert. This
has the following advantages:
- the comprehensibility and confidence of the
constructed model are increased because the user has
participated in its creation,
- we can use the domain knowledge in the whole
process,
- we can use the human capabilities in pattern
recognition tasks to overcome some computational
complexity.
TOWARDS VISUAL DATA MINING
355

But this kind of approach also raises some problems
we must address before it becomes really efficient,
which include the following:
- we must guide the user in the various choices he
must perform during the KDD process,
- we must be able to deal with very large data sets.
Once these problems have been solved, the data
mining tools will be more easily available to a larger
number of users.
REFERENCES
Ankerst M., Elsen C., Ester M., Kriegel H-P.: "Perception-
Based Classification", in Informatica, An International
Journal of Computing and Informatics, 23(4), 493-
499, 1999.
Bennett K. and Campbell C., 2000, “Support Vector
Machines: Hype or Hallelujah?”, in SIGKDD
Explorations, Vol. 2, No. 2, pp. 1-13.
Blake C., Merz C., UCI Repository of machine learning
databases,
[http://www.ics.uci.edu/~mlearn/MLRepository.html],
Irvine, CA: University of California, Department of
Information and Computer Science, (1998).
Bock H.H., Diday E., "Analysis of Symbolic Data:
Exploratory Methods for Extracting Statistical
Information from Complex Data", Springer-Verlag,
Berlin-Heidelberg, 2000.
Breiman L., Friedman J.H., Olsen R.A., Stone C.J.,
"Classification And Regression Trees", Wadsworth,
1984.
Fayyad U., Piatetsky-Shapiro G., Smyth P., Uthurusamy
R., 1996, "Advances in Knowledge Discovery and
Data Mining", AAAI Press.
Inselberg A., Avidan T., "Classification and Visualization
for High-Dimensional Data", in proc. of KDD'2000,
pp.370-374.
Murthy S., Kasif S., Salzberg S., Beigel R., "OC1:
Randomized induction of oblique decision trees", in
proc. of the 11th National Conference on Artificial
Intelligence, MIT Press, 1993, pp.322-327.
Poulet F. "Full-View: a Visual Data Mining Environment"
in International Journal of Image and Graphics, 2(1),
2002.
Poulet F. "Cooperation Between Automatic Algorithms,
Interactive Algorithms and Visualization Tools for
Visual Data Mining" in proc. of
VDM@ECML/PKDD'2002, 2
nd
Int. Workshop on
Visual Data Mining, Helsinki, Aug.2002.
Poulet F., Do, T-N., "Mining Very Large Datasets with
Support Vector Machine Algorithms", in proc of
ICEIS'2003, 5
th
Int. Conf. on Enterprise Information
Systems, Angers, France, April 2003.
Poulet F. "Interactive Decision Tree Construction for
Interval and Taxonomical Data" in proc. of
VDM@ICDM'03, the 3
rd
International Workshop on
Visual Data Mining, Melbourne, Florida, Nov.2003.
Quinlan J.R., "C4.5: Programs for Machine Learning",
Morgan-Kaufman Publishers, 1993.
Vapnik V., 1995, "The Nature of Statistical Learning
Theory", Springer-Verlag, New York.
ICEIS 2004 - ARTIFICIAL INTELLIGENCE AND DECISION SUPPORT SYSTEMS
356
