
WEB-BASED INFORMATION SYSTEMS SATISFACTION
Theoretical Development and Testing of Competing Models
Christy M. K. Cheung
Department of Finance & Decision Sciences, Hong Kong Baptist University, Kowloon Tong, Kowloon, Hong Kong
Matthew K. O. Lee
Department of Information Systems, City University of Hong Kong, Kowloon Tong, Kowloon, Hong Kong
Keywords: User Satisfaction, Web-base Information System, Information Quality, System Quality.
Abstract: User satisfaction has been widely used in evaluating the performance of web-based information systems
(WIS) since the growth of the World Wide Web. This study aims at investigating the structure and
dimensionality of the WIS satisfaction construct. We tested the competing models built upon the web
satisfaction model and assessed the psychometric properties of the factors and measuring items using
confirmatory factor analysis. Our findings suggested that WIS satisfaction can be explained by a higher-
order factor model with six first-order factors (i.e., understandability, reliability, usefulness, access,
usability, and navigation) and two correlated second-order factors (i.e., web information satisfaction and
web system satisfaction). The model provides a good-fit to the data and is theoretically valid, reflecting the
logical or formal consistency. Implications of the current investigation for practice and research are
provided.
1 INTRODUCTION
User satisfaction is one of the most important
measures of information systems success (Rai et al.,
2002; DeLone and McLean, 1992; 2003; Zviran and
Erlich, 2003). It has become a particularly important
evaluation measurement of web-based information
systems (WIS) since the rapid growth of the World
Wide Web. Despite the fact that there is a rich
literature of end-user information satisfaction
conducted in traditional information system (IS)
environment, very little is known about user
satisfaction in the web-based environment due to the
different natures of these two kinds of IS (Isakowitz
et al., 1998, Kaschek et al., 2004). The users of
traditional information system are mainly
professionals in organizations while those of WIS
comprise of both professional and non-professional
users. Besides, these systems perform different
functions to fulfill the needs of these two types of
end-users. Furthermore, the richness of information
and the nature of unstructured and highly
individually customizable interactions typically
exhibited by WIS redefine the standard of user
satisfaction in the web environment. As a result,
findings from prior studies on user satisfaction may
not be valid in the context of WIS. There is a need to
investigate the concept of user satisfaction under the
new context of WIS.
The purpose of this study is thus to investigate
the multi-faceted structure and dimensionality of the
web-based information systems satisfaction
construct through an examination of several
competing theoretical measurement models. The
results are anticipated to increase our understanding
of WIS satisfaction, thereby laying a concrete
foundation for the development of a validated and
robust instrument for measuring WIS satisfaction,
which may serve as a practical evaluation tool for
evaluating web-based information systems.
2 THEORETICAL
BACKGROUND
Satisfaction has been extensively studied from
diverse theoretical perspectives. The discipline of
information systems has a long history of research in
46
M. K. Cheung C. and K. O. Lee M. (2007).
WEB-BASED INFORMATION SYSTEMS SATISFACTION - Theoretical Development and Testing of Competing Models.
In Proceedings of the Third International Conference on Web Information Systems and Technologies - Society, e-Business and e-Government /
e-Learning, pages 46-53
DOI: 10.5220/0001275800460053
Copyright
c
SciTePress

End-User Computing (EUC) satisfaction, which is
also a widely adopted indicator of IS success
(DeLone and McLean, 1992; 2003; Rai et al., 2002).
EUC satisfaction is generally defined as an overall
affective evaluation an end-user has regarding his or
her experience related to the information system.
Doll and Torkzadeh (1988) developed a 12-item
instrument that measures the five components of
EUC satisfaction, namely, content, accuracy, format,
ease of use, and timeliness. This instrument was one
of the best known and frequently employed
measurements of end-user computing satisfaction
(e.g., McHaney et al., 2002). Doll et al. (1994)
performed a confirmatory factor analysis of the EUC
satisfaction instrument, so as to test the alternative
factor structures of EUC satisfaction and to assess
the psychometric properties of the factors and items.
Their results provide strong support for their EUC
satisfaction instrument.
One of the differences between WIS and
traditional IS is that the former involves more end-
users direct information consumption and interaction
than the latter. Hence, information provided by the
system and the quality of the systems are decisive in
determining the level of web-based information
system satisfaction. In this regard, McKinney et al.
(2002) proposed a theoretical model of web
satisfaction, which argues that web satisfaction
should be analyzed at information level and system
level. In other words, web satisfaction can be
analyzed in terms of web information quality
satisfaction (Web-IQ satisfaction) and web system
quality satisfaction (Web-SQ satisfaction). Building
upon expectation confirmation theory, Web-IQ
satisfaction and Web-SQ satisfaction is determined
by Web IQ disconfirmation and Web SQ
disconfirmation respectively, and these
disconfirmations are based on the evaluations of the
expectation and perceived performance on the
quality constructs.
3 FACTOR STRUCTURE FOR
WIS SATISFACTION
McKinney et al. (2002) conceptualized web-based
information system satisfaction as a
multidimensional concept that was made up of Web-
IQ satisfaction and Web-SQ satisfaction, which, in
turn, was comprised of three dimensions
respectively. This hierarchy implies that users
evaluate WIS performance at multiple levels with
multiple dimensions, and ultimately combine these
evaluations to arrive at an overall WIS satisfaction
perception. WIS satisfaction is therefore the overall
affective evaluation a user has regarding his or her
experience related to the web-based information
system. In McKinney et al.’s (2002) web
satisfaction model, understandability, reliability, and
usefulness of information were the three key
dimensions related to information quality. They also
empirically determined three dimensions of system
quality for web customer satisfaction, including
access, usability, and navigation (See Table 1).
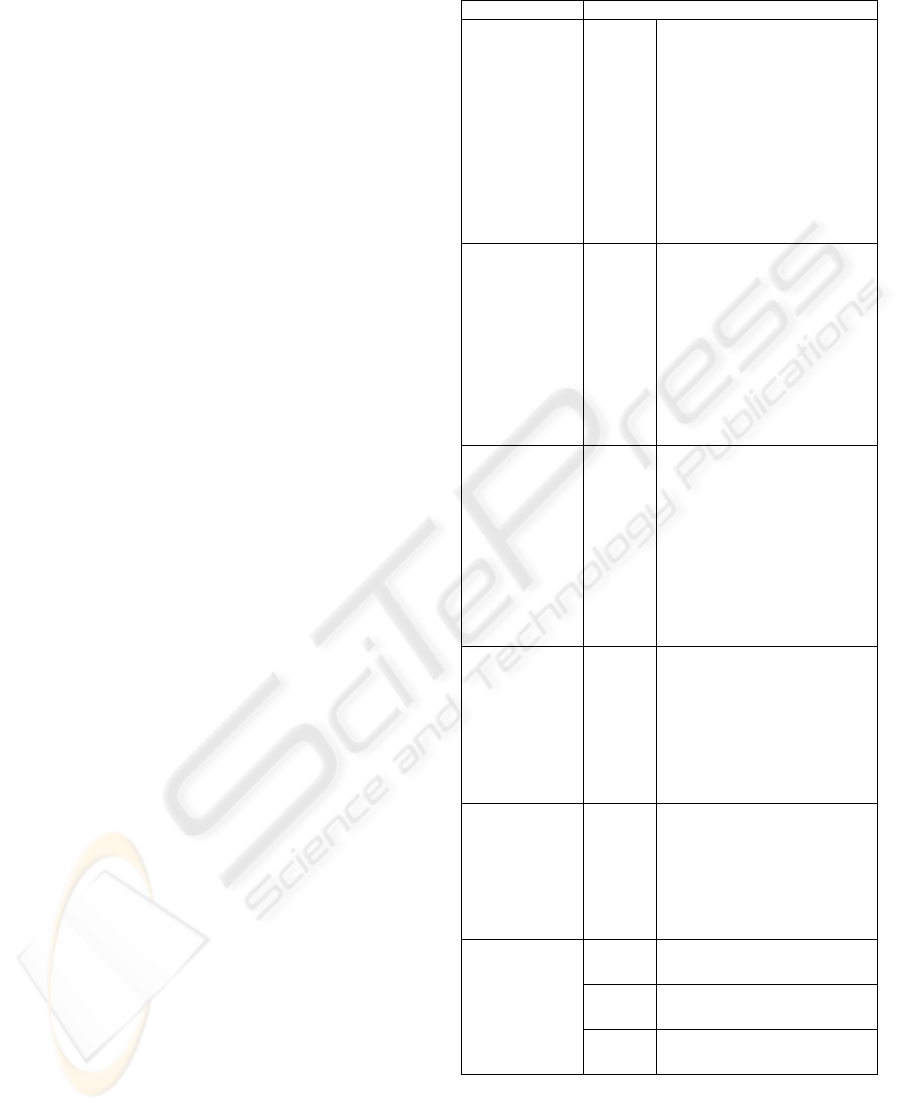
Table 1: Dimensions of Web Information Satisfaction.
Dimensions Definition Manifest
Variables
Under-
standability
Concerned with
such issues as
clearness and
goodness of the
information
Clear in
meaning
Easy to
understandin
g
Easy to read
Reliability Concerned with
the degree of
accuracy,
dependability, and
consistency of the
information
Trustworthy
Accurate
Credible
Usefulness Users’ assessment
of the likelihood
that the
information will
enhance their
decision
Informative
Valuable
Access Refers to the speed
of access and
availability of the
web site at all
times
Responsive
Quick loads
Usability Concerned with
the extent to which
the web site is
visually appealing,
consistent, fun and
easy to use
Simple layout
Easy to use
Well
organized
Navigation Evaluates the links
to needed
information
Easy to go
back and
forth
A few clicks
4 COMPETING MODELS FOR
WIS SATISFACTION
In this study, we followed Doll et al.’s (1994)
approach to test the five alternative factor structures
of WIS satisfaction with 21 observable items.
WEB-BASED INFORMATION SYSTEMS SATISFACTION - Theoretical Development and Testing of Competing
Models
47

Models 1 to 3 represent the non-hierarchical
structure with only first-order factor, and Model 4
and 5 represent the hierarchical structure with more
than one level of abstraction.
Model 1 is a first-order factor model. One factor
(WIS satisfaction) is hypothesized to account for all
the common variance among the 21 items. This is
consistent with the idea used in the end user
computing satisfaction literature, adding the item
scores to obtain a total satisfaction score.
Model 2 hypothesizes six orthogonal or
uncorrelated first-order factors (i.e.,
understandability, reliability, usefulness, access,
usability, and navigation). McKinney et al. (2002)
performed an exploratory factor analysis resulting in
six factors. Thus, Model 2 is considered a plausible
alternative model of underlying data structure.
Model 3 is a first-order factor model with the six
factors correlated with each others to represent
different dimensions of the concept of WIS
satisfaction. Assuming the six factors are correlated
allows us to capture the common variance in the
model.
Model 4 hypothesizes six first-order factors and
two second-order factors (web information
satisfaction and web system satisfaction). Based on
McKinney et al.’s (2002) model, understandability,
reliability, and usefulness are dimensions of
information quality. We believe these three first-
order factors are highly correlated, and their
covariations can be captured by a second-order
factor (Web information satisfaction). Similarly,
access, usability, and navigation are closely related
to system quality, and a second-order factor (Web
system satisfaction) is proposed to capture their
covariations.
Model 5 assumes that the two second-order
factors in Model 4 are correlated. Similar to Model 3,
we assume the correlations between the two second-
order factors, so that the common variation in the
model can be captured.
5 RESEARCH METHOD
The sections below describe the details of data
collection procedure, measurement, data analytical
approach, and model competing criteria.
5.1 Data Collection
The web-based information system in question is
known as “Blackboard Learning System
(http://www.blackboard.com)”, an Internet-based
learning portal for students in campus-based
education institutions. Through this portal, students
can access to course materials, course
announcements, and other relevant documents of
each course they are enrolled in. The portal also
contains communication facilities (e.g., discussion
forums, group pages, and virtual classrooms) for
students to exchange ideas and opinions.
The web-based portal was introduced to the first-
year undergraduate students at the beginning of the
semester. After six-week’s usage, students were
invited to voluntarily complete an online
questionnaire that covered all the measures of the
constructs in this study. A total of 515 usable
questionnaires were collected. The respondent rate
was 64.4%. Among the respondents, 54.8% were
female and 45.2% were male.
5.2 Measurement
Table 2 lists the measures used in this study.
Basically, we borrowed the measures from
McKinney et al. (2002) but modified the wordings
so as to fit them to this particular context of web-
based information systems user satisfaction. The
measurements employed a seven-point Likert scale,
from “1=never” to “7=always”.
5.3 Data Analytical Approach
The proposed factor structures were examined
through the LISREL VIII framework. LISREL is
one of the most widely used Structural Equation
Modeling (SEM) techniques in IS. According to
Chin (1998), if SEM is accurately applied, it can
surpass the first-generation techniques such as
principle components analysis, factor analysis,
discriminant analysis, or multiple regression.
Specifically, SEM provides a greater flexibility in
estimating relationships among multiple predictors
and criterion variables. It allows modeling with
unobservable latent variables, and it estimates the
model uncontaminated with measurement errors.
As suggested by Doll et al. (1994), competing
models should be specified based on logic, theory,
and prior studies. The LISREL framework offers us
a systematic approach to statistically compare the
theoretical models using the goodness-of-fit indexes.
The best model is then selected as representing the
factor structure and dimensionality of WIS
satisfaction in the sample data. Further, the
psychometric properties (i.e., reliability and validity)
of the selected model are examined.
WEBIST 2007 - International Conference on Web Information Systems and Technologies
48
5.4 Criteria for Comparing
Model-Data Fit
The determination of model fit in structural equation
modeling is not as straightforward as it is in other
statistical approaches in multivariate procedures.
Chi-square test is the only statistical test that
identifies a correct model given the sample data. In
contrast to traditional significance testing, the
researcher is interested in obtaining a non-significant
chi-square. Such a finding indicates that the
predicted model is congruent with the observed data.
Another alternative is the ratio of the chi-square to
the degrees of freedom. Researchers have
recommended using Normed Chi-Square as low as 2
or as high as 5 to indicate a reasonable fit (Hair et al.
1992). However, Chi-square test is highly sensitive
to the sample size and the departures from
multivariate normality of the observed variables
(Bollen, 1989). Given its sensitivity to many factors,
researchers are encouraged to complement the chi-
square measure with other fit indexes (Hair et al.,
1998).
In IS research, absolute fit indexes and
incremental fit indexes are the two most widely used
measures to determine how well the data fits the
proposed model. For instance, Doll et al. (1994)
used absolute fit indexes, including the Goodness-
of-Fit Index (GFI) and the Root Mean Square
Residual (RMSR), to evaluate individual models.
They also used incremental fit indexes, including the
Normed Fit Index (NFI) and the Adjusted Goodness-
of-Fit Index (AGFI), to reflect the improvement in
fit of one model over an alternative. Some
researchers (Joreskog and Sorbom, 1996; Hair et al.,
1998) provided the criteria and interpretation of
these measures.
6 RESULTS
The models are analyzed using confirmatory
maximum likelihood estimation.
6.1 Checking for Multivariate
Normality
Multivariate normality is an important assumption of
confirmatory factor analysis. To check if our
observations are independently and identically
distributed, we examined the skewness and kurtosis
for each scale. Skewness refers to the lack of
symmetry of a data distribution, while kurtosis refers
to whether the data distribution is peaked or flat
relative to a normal distribution. Skewness for scale
items ranged from 0.014 to 0.336 and kurtosis
ranged between 0.015 and 1.041 were well within
the robustness thresholds for normality.
Table 2: Lists of the Measures used in this Study.
Dimensions Items
UND1
The information on
Blackboard is clear in meaning
UND2
The information on
Blackboard is easy to
comprehend
UND3
The information on
Blackboard is easy to read
Under-
standability
UND4
In general, information on
Blackboard is understandable
for you to use
REL1 The information on
Blackboard is trustworthy
REL2 The information on
Blackboard is accurate
REL3 The information on
Blackboard is credible
Reliability
REL4 In general, information on
Blackboard is reliable for you
to use
USE1
The information on
Blackboard is informative to
your usage
USE2 The information on
Blackboard is valuable to your
usage
Usefulness
USE3 In general, information on
Blackboard is useful for you to
use
ACC1 Blackboard is responsive to
your request
ACC2 Blackboard is quickly loading
all the text and graphic
Access
ACC3 In general, Blackboard is
providing good access for you
to use
USA1 Blackboard is having a simple
layout for its contents
USA2 Blackboard is easy to use
USA3 Blackboard is of a clear design
Usability
USA4 In general, Blackboard is user-
friendly
NAV1 Blackboard is being easy to go
back and forth between pages
NAV2 Blackboard is providing a few
clicks to locate information
Navigation
NAV3 In general, Blackboard is easy
to navigate
WEB-BASED INFORMATION SYSTEMS SATISFACTION - Theoretical Development and Testing of Competing
Models
49

6.2 Model Estimation
Specification of the models included fixing one of
the paths from each of the six primary factors at 1.0,
and the factor variance for the higher-order factor at
1.0. These are important for model identification.
Model 1 fixes the factor variance for the single first-
order factor (WIS satisfaction) at 1.0 and allows the
21 observable variables to be free. For Models 2 and
3, the first path for each of the six first-order factors
(i.e., understandability, reliability, usefulness, access,
usability, and navigation) is fixed to 1.0. For Model
2, the covariances among the six first-order factors
are fixed to zero. For Models 4 and 5, the first path
for each of the six first-order factors (i.e.,
understandability, reliability, usefulness, access,
usability, and navigation) is fixed to 1.0. The first
path for each of the two second-order factors (i.e.,
Web-IQ satisfaction and Web-SQ satisfaction) is
fixed to 1.0. For Model 4, the covariances between
Web-IQ satisfaction and Web-SQ satisfaction is
fixed to zero. For all five models, the number of
available data point is p(p+1)/2 = 21 × 22 / 2 = 231.
For Model 1, there are 42 free parameters that
include 21 error variances for the measured variables
and 21 factor loadings. This leaves (231-42) = 189
degrees of freedom for Model 1. There are 42 free
parameters for Model 2 which include 21 error
variables, a total of (21-6) = 15 factor loadings, and
6 first-order factor variances. This results in 189
degrees of freedom for Model 2. The free parameters
for Model 3 include 21 error variables, 15 factor
loadings, 15 covariances among the first-order
factors, and 6 first-order factor variances. Thus,
Model 3 has 174 degrees of freedom. For Model 4,
there are 46 free parameters that include 21 error
variances for measured variables, 15 first-order
factor loadings, 4 second-order factor loadings, 6
primary factor disturbances. This leaves 185 degrees
of freedom. Finally, there are 47 free parameters for
Model 5, including 21 error variances for measured
variables, 15 first-order factor loadings, 4 second-
order factor loadings, 6 primary factor disturbances,
and 2 second-order factor variances, and 1
covariance between second-order factors. This
provides 182 degrees of freedom.
6.3 Goodness-of-Fit
Table 3 summarizes the goodness-of-fit indexes for
the five competing models. As expected, the large
sample size causes the chi-square statistics of all
models statistically significant with p-value < 0.0001.
Models 1 to 3 are the first-order factor models. Both
Models 1 and 2 provide poor fit to the data, where
their fit indexes do not fulfill the recommended
acceptance levels. Model 3 provides a good fit to the
data with desirable goodness-of-fit indexes, and
demonstrates a significant improvement over Model
2. The NFI index increases significantly from 0.66
(Model 2) to 0.94 (Model 3), and the AGFI index
improves from 0.43 (Model 2) to 0.87 (Model 3).
Model 4 and Model 5 represent the second-order
factor models. The two models provide reasonable
model-data fit, and their fit indexes are close to the
recommended levels. Comparing Model 4 and
Model 5, Model 5 performs slightly better than
Model 4, with a lower value of normed chi-square
(Model 4: 7.67, Model 5: 3.46) and a higher value of
GFI (Model 4: 0.86, Model 5: 0.89). Like Model 3,
Model 5 also provides substantial improvement over
Model 4. The NFI index increases significantly from
0.86 (Model 4) to 0.94 (Model 5) and the AGFI
index improves from 0.82 (Model 4) to 0.87 (Model
5).
Table 3: Goodness of Fit Indexes for Competing Models
(n=515).
In comparing the goodness-of-fit among all
competing models, we notice that the first-order
model (Model 3) performs the best. As suggested by
Marsh and Hocevar (1985), the purpose of higher-
order model is to explain the covariation among the
lower-order factors in a more parsimonious way. In
fact, even the higher-order model can explain the
factor covariation effectively, its goodness-of-fit can
Absolute Fit
Measures
Incre-
mental
Fit
Measures
Model
Chi-
square
(df)
Normed
Chi-square
(Chi-
square/ df)
GFI
RM
SR
AG
FI
N
FI
1
1539.80
(189) 8.15 0.74 0.05 0.68
0.
85
2
3429.03
(189) 18.14 0.53 0.55 0.43
0.
66
3
592.05
(174)
3.40 0.90 0.03 0.87
0.
94
4
1418.96
(185)
7.67 0.86 0.47 0.82
0.
86
5
630.29
(182)
3.46 0.89 0.04 0.87
0.
94
GFI – Goodness of Fit Index
RMSR – Root Mean Square Residual
AGFI – Adjusted Goodness of Fit Index
NFI – Normed Fit Index
WEBIST 2007 - International Conference on Web Information Systems and Technologies
50
never be better than the corresponding first-order
model. Harlow and Newcomb (1990) further
suggested four guidelines for model selection,
including (a) logical or formal consistency, (b)
empirical adequacy, (c) the ability to capture most of
the essential relations among the variables, and (d)
simplicity. Based on these criteria, only Model 3 and
Model 5 could be retained. Among the two models,
Model 5 is more theoretically valid, reflecting the
logical or formal consistency. Similar to the case in
Harlow and Newcomb (1990), Model 5 presents the
relationships in the data in an organized and
conceptually descriptive manner. In sum, Model 5 is
the most appropriate model to capture the structure
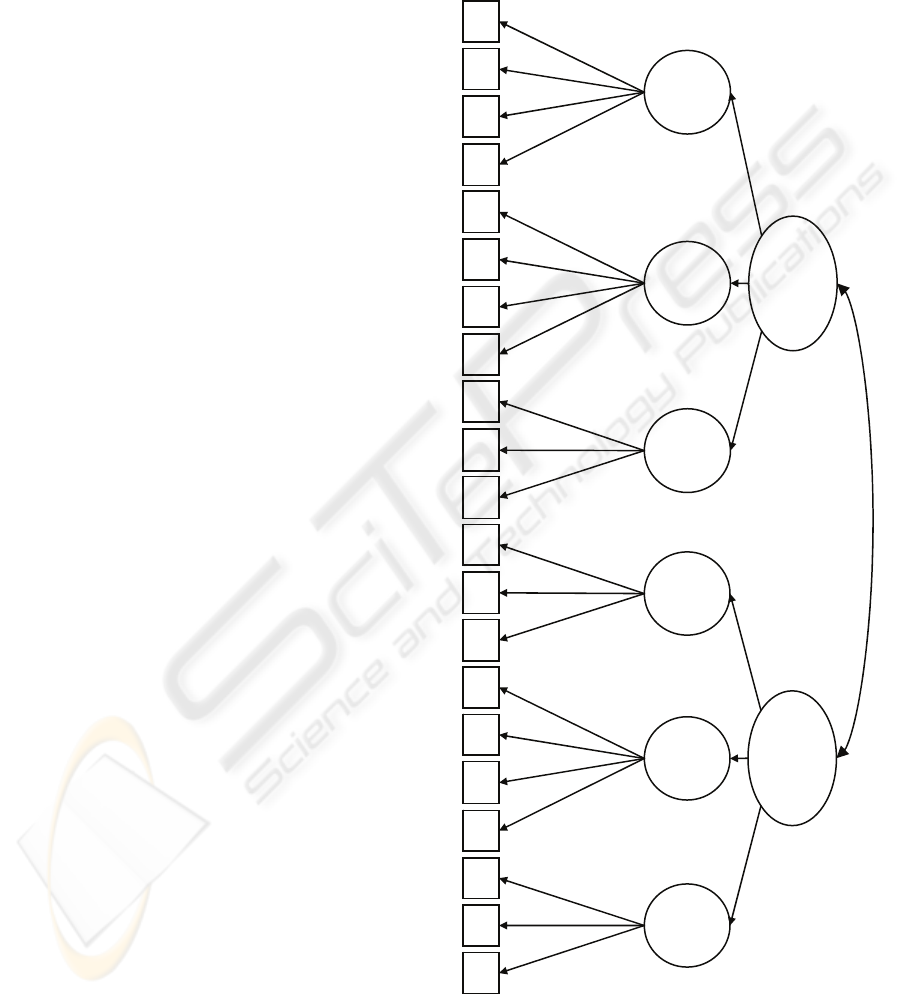
of WIS satisfaction. Figure 1 depicts the hierarchical
structure of Model 5 with their respective factor
loadings and residual variances. Each of the factor
loadings is large and highly significant with
correspondingly low residence variances, offering
further support for Model 5.
Indeed, we believe that a third-order factor
model with six first-order factors (i.e.,
understandability, reliability, usefulness, access,
usability, navigation), two second-order factors
(Web-IQ satisfaction and Web-SQ satisfaction), and
one third-order factor (WIS satisfaction) may
provide a richer explanation of the underlying
structure of WIS satisfaction. However, this model
cannot be uniquely determined and hence cannot be
estimated. According to Rindskopf and Rose (1988),
there must be at least three second-order factors (for
the third-order factor model) if the model is to be
identified
6.4 Psychometric Properties
After examining the overall model fit, we turn to
examine the parameters estimates for Model 5.
Table 4 presents the statistical significance of the
estimated loadings, their corresponding t values, and
R-square values for the 21 observed variables. All
items present significant factor loadings, each with a
t-value higher than 2.00, on their underlying latent
factor. Fornell and Larcker (1987) stated that a
loading of 0.70 to latent variable is considered to be
a high loading since the item explains almost 50
percent of the variance in a particular construct. In
our study, all items have high loadings (0.71 or
above) to its respective construct.
Composite reliability (CR) and average variance
extracted (AVE) are also computed to assess the
construct validity. A composite reliability of 0.70 or
above and an average variance extracted of more
than 0.50 are deemed acceptable (Hair et al., 1998).
As shown in Table 4, all the measures fulfill the
recommended levels, with the composite reliability
ranges from 0.87 to 0.93 and the average variance
extracted ranges from 0.68 to 0.79. Overall, the
measures of the selected model have desirable
psychometric properties.
Figure 1: Factor Loadings and Residence Variances in
Model 5.
Web-IQ
Satisfactio
n
Web-SQ
Satisfactio
n
Under-
standabilit
y
Reliability
Usefulness
Access
Usability
Navigation
UN1
UN2
UN3
UN4
RE1
RE2
RE3
RE4
USE1
USE2
USE3
ACC1
ACC2
ACC3
USA1
USA2
USA3
USA4
NAV1
NAV2
NAV3
0.88 (14.31)
0.88 (14.24)
0.80 (13.94)
0.86 (13.98)
0.86 (14.13)
0.83
(
14.01
)
0.85
(
14.10
)
0.89 (14.38)
0.91 (14.47)
0.87 (14.26)
0.71 (8.79)
0.88 (9.02)
0.88 (9.08)
0.83 (8.35)
0.90 (8.43)
0.89 (8.40)
0.89 (8.41)
0.88 (8.99)
0.83
(
8.99
)
0.84 (9.03)
0.92 (12.17)
0.91 (12.18)
0.91 (12.20)
0.94 (8.44)
0.96 (7.88)
0.95 (8.39)
0.48 (11.27)
Key: 0.84 (9.03) = Factor Loading (Residence Variances)
0.83 (14.21)
WEB-BASED INFORMATION SYSTEMS SATISFACTION - Theoretical Development and Testing of Competing
Models
51
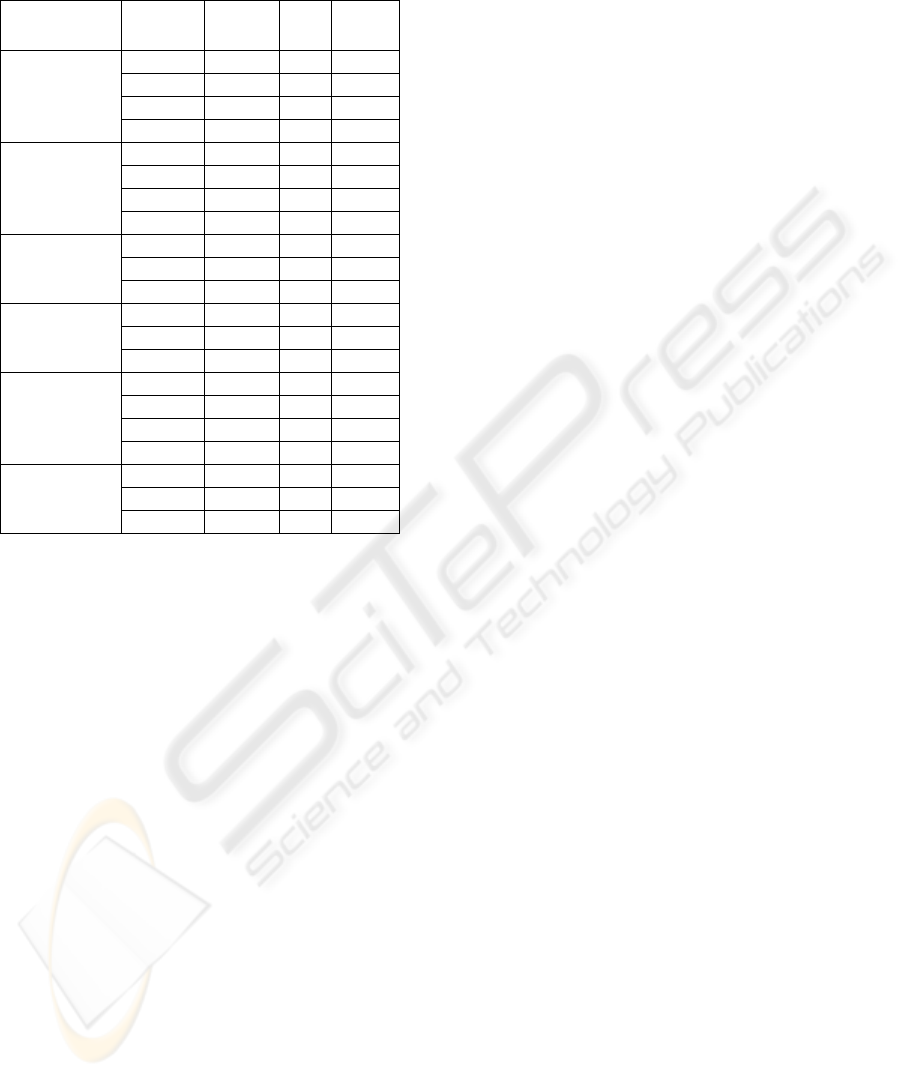
Table 4: Parameter Estimates For Model 5 (Six first-order
factors and two second-order factors).
7 DISCUSSION AND
CONCLUSION
The results suggested that WIS satisfaction can be
assessed by a large number of highly related factors.
The second-order factor model (Model 5) with six
first-order factors (i.e., understandability, reliability,
usefulness, access, usability, and navigation) and
two correlated second-order factors (i.e., web
information satisfaction and web system satisfaction)
provides a good-fit to the data and is more
theoretically valid, reflecting the logical or formal
consistency.
7.1 Managerial Implications
Understanding WIS satisfaction is particularly
important because a high level of WIS satisfaction is
associated with several key outcomes, including
enhanced IS continuance usage (Bhattacherjee,
2001), the realization of IS success (DeLone and
McLean, 1992; 2003), and improved user
performance (Gelderman, 1998). In the current study,
our higher-order factor model can greatly assist web
designers in understanding how users assess web-
based information systems satisfaction. Essentially,
the model can help explain three basic issues: (1)
what defines WIS satisfaction, (2) how WIS
satisfaction is formed, and (3) which attributes are
relatively important to the formation of WIS
satisfaction. These three factors require managerial
attention in efforts to improve user satisfaction with
the web-based information systems. Thus, we
believe our hierarchical structure model can
substantially enhance web designers’
conceptualization and understanding of WIS
satisfaction.
In addition, the multilevel conceptualization of
WIS satisfaction allows for analysis at different
levels of abstraction. Web designers can use the
complete scale to determine an overall WIS
satisfaction, or they can focus on specific area that is
in need of attention.
7.2 Research Implications
This study also has significant implications for
academics. In response to the call for developing
standardized instruments and completing a research
cycle (Doll et al., 1994), the current study performed
a confirmatory factor analysis on the McKinney et al.
(2002) satisfaction instrument to test the alternative
factor structures of WIS satisfaction and to assess
the psychometric properties of the factors and their
measuring items. Our results provide a strong
support for McKinney et al.’s instrument. An
obvious extension of this research is to conduct
replication studies for other web-based information
systems, and to explore the adaptation of this scale
in other online environment.
Researchers in social sciences argued that the use
of hierarchical factor structure can enhance the
conceptualization and the estimation of human
judgment models. Similarly, we believe our higher-
order factor model can capture users’ overall
evaluation of WIS satisfaction through the
underlying commonality among dimensions in the
second-order factor.
Finally, this study demonstrates the advantages
of using confirmatory factor analysis (CFA) for
comparing alternative factor structures. CFA
facilitates researchers to define alternative models
for the testing of competing models and to generate
parameter estimates of the models. Also, researchers
can easily perform model comparisons using
subjective indicators. However, indeterminacy of
hierarchical models is common when sufficient
restrictions are not imposed. This work has been
restricted to estimating only second-order
Latent
Variable
Observed
Variable
Factor
Loading
t-
value
R-
squares
UN1 0.83 14.21 0.76
UN2 0.88 14.32 0.78
UN3 0.88 14.24 0.77
Under-
standability
CR = 0.91
AVE = 0.72
UN4 0.80 13.94 0.70
RE1 0.86 13.17 0.70
RE2 0.86 12.70 0.73
RE3 0.83 13.07 0.70
Reliability
CR = 0.91
AVE = 0.71
RE4 0.85 12.82 0.72
USE1 0.89 11.89 0.75
USE2 0.91 11.30 0.77
Usefulness
CR = 0.92
AVE = 0.79
USE3 0.87 12.45 0.72
ACC1 0.71 14.26 0.50
ACC2 0.88 13.14 0.61
Accountability
CR = 0.87
AVE = 0.68
ACC3 0.88 11.39 0.70
USA1 0.83 13.88 0.68
USA2 0.90 12.85 0.76
USA3 0.89 13.37 0.73
Usability
CR = 0.93
AVE = 0.77
USA4 0.89 13.16 0.74
NAV1 0.88 12.95 0.70
NAV2 0.83 13.03 0.69
Navigation
CR = 0.89
AVE = 0.72
NAV3 0.84 12.14 0.74
WEBIST 2007 - International Conference on Web Information Systems and Technologies
52

hierarchical models. Future research must attempt to
find means to estimate higher-order structures.
ACKNOWLEDGEMENTS
The work described in this paper was substantially
supported by a grant from the Research Grants
Council of the Hong Kong Special Administrative
Region, China [Project No. CityU 1361/04H].
REFERENCES
Bhattacherjee, A., 2001. An empirical analysis of the
antecedents of electronic commerce service
continuance, Decision Support Systems, 32, 201-214.
Bollen, K. A., 1989. Structural equations with latent
variables, Wiley.
Chin, W. W., 1998. Issues and opinion on structural
equation modeling, MIS Quarterly, 22, 7-16.
Chin, W. W. and Lee, M. K. O., 2000. In Twenty-First
International Conference on Information Systems
(Eds, Orlikowski, W. J., Ang, S., Weill, P., Krcmar, H.
and DeGross, J. I.) Brisbane, Australia, pp. 553-563.
DeLone, W. H. and McLean, E. R., 1992. Information
systems success: The quest for the dependent variable,
Information Systems Research, 3, 60-95.
DeLone, W. H. and McLean, E. R., 2003. The DeLone
and McLean model of information systems success: A
ten-year update, Journal of Management Information
Systems, 19, 9-30.
Doll, W. J. and Torkzadeh, G., 1988. The measurement of
end-user computing satisfaction, MIS Quarterly, 12,
259-274.
Doll, W. J., Xia, W. and Torkzadeh, G., 1994. A
confirmatory factor analysis of the end-user
computing satisfaction instrument, MIS Quarterly, 18,
453-461.
Fornell, C. and Larcker, D., 1987. Evaluating structural
equation models with unobservable variables and
measurement error, Journal of Marketing Research,
18, 39-50.
Gelderman, M., 1998. The relation between user
satisfaction, usage of information systems and
performance, Information and Management, 34, 11-
18.
Hair , J. F., Anderson, R. E., Tatham, R. L., 1992.
Multivariate Data Analysis: With Readings, 3
rd
ed.,
New York, MacMillan Publishing Co.
Hair, J. F., Anderson, R. E., Tatham, R. L. and Black, W.
C., 1998. Multivariate data analysis,5
th
Ed.,
Englewood Cliffs, NJ: Prentice-Hall.
Harlow, L. L. and Newcomb, M. D., 1990. Towards a
general hierarchical model of meaning and satisfaction
in life, Multivariate Behavioral Research, 25, 387-
405.
Isakowitz, T., Bieber, M. and Vitali, F., 1998. Web
Information Systems, Communications of the ACM,
41, 78-80.
Joreskog, K. G. and Sorbom, D., 1996. LISREL 8: User's
Reference Guide, Scientific Software International.
Kaschek, R., Schewe, K.-D., Wallace, C. and Matthews,
C., 2004. In Web Information Systems (Eds, Taniar, D.
and Rahayu, J. W.) IDEA Group Publishing, Hershey,
PA.
Marsh, H. W. and Hocevar, D., 1985. Application of
confirmatory factor analysis to the study of self-
concept: First- and higher order factor models and
their invariance across groups, Psychological Bulletin,
97, 562-582.
McHaney, R., Hightower, R. and Pearson, J., 2002. A
validation of the end-user computing satisfaction
instrument in Taiwan, Information and Management,
39, 503-511.
McKinney, V., Yoon, K. and Zahedi, F. M., 2002. The
measurement of web-customer satisfaction: An
expectation and disconfirmation approach,
Information Systems Research, 13, 296-315.
Rai, A., Lang, S. S. and Welker, R. B., 2002. Assessing
the validity of IS success models: An empirical test
and theoretical analysis, Information Systems
Research, 13, 50-69.
Rindskopf, D. and Rose, T., 1988. Some theory and
applications of confirmatory second-order factor
analysis, Multivariate Behavioral Research, 23, 51-67.
Zviran, M. and Erlich, Z., 2003. Measuring IS user
satisfaction: Review and Implications,
Communications of the Association for Information
Systems, 12, 81-103.
WEB-BASED INFORMATION SYSTEMS SATISFACTION - Theoretical Development and Testing of Competing
Models
53
