
SOFTWARE DEFECT PREDICTION: HEURISTICS FOR
WEIGHTED NAÏVE BAYES
Burak Turhan and Ayşe Bener
Department of Computer Engineering, Bogazici University, 34342 Bebek, Istanbul, Turkey
Keywords: Empirical software engineering, Software quality, Defect prediction, Software metrics, Naïve Bayes,
Feature weighting.
Abstract: Defect prediction is an important topic in software quality research. Statistical models for defect prediction
can be built on project repositories. Project repositories store software metrics and defect information. This
information is then matched with software modules. Naïve Bayes is a well known, simple statistical
technique that assumes the ‘independence’ and ‘equal importance’ of features, which are not true in many
problems. However, Naïve Bayes achieves high performances on a wide spectrum of prediction problems.
This paper addresses the ‘equal importance’ of features assumption of Naïve Bayes. We propose that by
means of heuristics we can assign weights to features according to their importance and improve defect
prediction performance. We compare the weighted Naïve Bayes and the standard Naïve Bayes predictors’
performances on publicly available datasets. Our experimental results indicate that assigning weights to
software metrics increases the prediction performance significantly.
1 INTRODUCTION
Quality of software is often measured by the number
of defects in the final product. Minimizing the
number of defects—maximizing software quality—
requires a thorough testing of the software in
question. On the other hand, testing phase requires
approximately 50% of the whole project schedule
(Harold, 2000; Tahat et.al., 2001). This means
testing is the most expensive, time and resource
consuming phase of the software development
lifecycle. An effective test strategy should therefore
consider minimizing the number of defects while
using resources efficiently.
Defect prediction models are helpful tools for
software testing. Accurate estimates of defective
modules may yield decreases in testing times and
project managers may benefit from defect predictors
in terms of allocating the limited resources
effectively (Song et.al., 2006).
Defect predictors based on linear regression
(Munson and Khoshgoftaar, 1990), discriminant
analysis (Munson and Khoshgoftaar, 1992), decision
trees, neural networks (Padberg et.al., 1998;
Khoshgoftaar and Seliya, 2004) and Naïve Bayes
classification (Menzies et.al., 2007) have been
analysed in previous research. Among these, Naïve
Bayes is reported to achieve significantly better
performances than the other methods (Menzies et.al.,
2007). Naïve Bayes assumes the independence and
equal importance of provided features despite the
fact that these do not hold in many cases.
Nevertheless, Naïve Bayes has a good reputation for
its prediction accuracy (Domingos and Pazzani,
1997).
This paper attempts to tackle the equal
importance of features assumption of Naïve Bayes.
As shown in previous research, all software metrics
may not be good indicators of software defects
(Basili et.al., 1996). We extend this and assume that
all software metrics may not have equal effect on
defect prediction and they should be treated
accordingly. Our research goal is to develop a
methodology that permits the use of software
metrics in terms of their relevance to defect
prediction. For this purpose we present one existing
and two new heuristics for determining the degree of
importance of software metrics and we evaluate
these in Weighted Naïve Bayes classifier on
datasets, which are chosen among real software
applications and publicly provided by NASA MDP
(Nasa, 2007).
244
Turhan B. and Bener A. (2007).
SOFTWARE DEFECT PREDICTION: HEURISTICS FOR WEIGHTED NAÏVE BAYES.
In Proceedings of the Second International Conference on Software and Data Technologies - SE, pages 244-249
DOI: 10.5220/0001339402440249
Copyright
c
SciTePress

2 RELATED WORK
Linear regression analysis for defect prediction
treats software metrics as the independent variables
in order to estimate the dependent variable i.e. defect
density. Munson and Khoshgoftaar (1992)
investigate linear regression models and
discriminant analysis to conclude the performance of
the latter is better. They use Principal Component
Analysis (PCA) as a pre-processing step in order to
eliminate the co-linearity in software metrics.
Nagappan et.al. (2005) also uses linear regression
analysis with PCA for the STREW metric suite.
Decision tree learning is another common method
that is preferred for its rule generation capabilities
(Menzies et.al., 2003; Menzies et.al., 2004). Such
rules are easier to explain to non-technical people
(Fenton and Neil, 1999).
Though some research stated against using static
code measures (Fenton and Ohsson, 2000; Shepperd
and Ince, 1994), a recent research showed that using
a Naïve Bayes classifier with log-filtered static code
measures yields significantly better results than rule
based methods like decision trees (Menzies et.al.,
2007).
The number of researches for relaxing the
assumptions of Naive Bayes have significantly
increased in recent years. These researches focused
on modifications to break the conditional
independence assumption and weighting attributes
(Lewis, 1998; Zhang and Webb, 2000; Frank et.al,
2003; Zhang and Sheng, 2004; Hall, 2007). All
studies reported results that are generally ‘not worse’
than the standard Naïve Bayes, while preserving the
simplicity of the model.
As for the attributes that are used for
constructing predictors, some researches prefer
ranking the features for feature subset selection
(Mladenic and Grobelnik, 1999; Menzies et.al.,
2007), and there are also researches on using the
ranking criteria for feature weight assignment
(Zhang and Sheng, 2004; Auer et.al., 2006). In fact,
feature subset selection corresponds to ‘hard’
weighting of features, i.e. assigning 0 or 1 for
feature weights.
In this paper, we aim at combining the best
practices of the above mentioned studies for
constructing robust and accurate defect predictors,
by means of using a weighted Naïve Bayes classifier
and constructing heuristics for accurate feature
weight assignment. While above mentioned
researches employ feature subset selection based on
the estimated importance of features, they treat the
selected subset of features equally. On the other
hand, we propose to treat each feature based on their
estimated importance and we search for empirical
evidence for the validity of our approach.
3 METHODS
In this section, methods used in this research are
explained. We first derive the Weighted Naïve
Bayes method, and then describe three heuristics for
feature weight assignment.
3.1 Weighted Naïve Bayes (WNB)
Although similar Weighted Naïve Bayes formulas
are given by Zhang and Sheng, (2004) and Hall
(2007), we will present a complete derivation.
Standard Naïve Bayes derivation can be obtained
by placing a special form of multivariate normal
distribution, as the likelihood estimate in the famous
Bayes theorem. By special form of multivariate
normal distribution we mean that the off-diagonal
elements of the covariance matrix estimate are
assumed to be zero, i.e. the features are independent.
In this case the multivariate distribution can be
written as the product of univariate normal
distributions of each feature.
Bayes theorem states that the posterior
distribution of a sample is proportional to the prior
distribution and the likelihood of the given sample
(Alpaydın, 2004). Formally:
)(
)()|(
)|(
xP
CPCxP
xCP
ii
i
=
(1)
In Equation 1, the denominator is referred to as
the evidence and given by:
∑
=
i
ii
CPCxPxP )()|()(
(2)
Evidence is a normalization constant for all classes,
thus it can be safely discarded. Then Equation 1
becomes:
)()|()|(
iii
CPCxPxCP =
(3)
In a classification problem we compute the
posterior probabilities P(C
i
|x) for each class and
choose the one with the highest posterior. In general
the logarithms are used for computational
convenience, which yields Equation 4.
SOFTWARE DEFECT PREDICTION: HEURISTICS FOR WEIGHTED NAÏVE BAYES
245

))(log())|(log()(
iii
CPCxPxg +=
(4)
Placing the special form of multivariate normal
distribution as explained before gives the standard
Naïve Bayes formula as given in Equation 5.
))(log(
2
1
)(
2
1
i
d
j
j
ij
t
j
i
CP
s
mx
xg +
⎟
⎟
⎠
⎞
⎜
⎜
⎝
⎛
−
−=
∑
=
(5)
If we update Equation 3 as in Equation 6 in order to
introduce weights,
)()|()|(
i
w
ii
CPCxPxCP
i
=
(6)
the Weighted Naïve Bayes estimator is obtained as
given in Equation 7:
))(log(
2
1
)(
2
1
i
d
j
j
ij
t
j
ii
CP
s
mx
wxg +
⎟
⎟
⎠
⎞
⎜
⎜
⎝
⎛
−
−=
∑
=
(7)
3.2 Feature Weight Assignment (WA)
3.2.1 Heuristic 1 (H1): GainRatio based WA
GainRatio is mainly used in decision tree
construction to determine the features that best splits
the data (Quinlan, 1993). Zhang and Sheng (2004)
use this heuristic for feature weight assignment. The
weight of a feature w
d
, where d=1..D and D is the
number of features, is given by Equation 8 (Zhang
and Sheng, 2004).
∑
×
=
)(
)(
iGainRatio
ndGainRatio
w
d
(8)
3.2.2 Heuristic 2 (H2): InfoGain based WA
InfoGain is another method for decision tree
(Quinlan, 1993). It is also used in other studies for
feature ranking (Mladenic and Grobelnik, 1999;
Menzies, 2007). Our goal is to convert these ranking
estimates into feature weights. Therefore, we
propose the heuristic given in Equation 9.
∑
×
=
)(
)(
iInfoGain
ndInfoGain
w
d
(9)
3.2.3 Heuristic 3 (H3): PCA based WA
PCA projects the data points onto orthogonal
principal axes such that the variance in each axis is
maximized. We claim that features with higher
weights for determining principal components
should have higher weights in the prediction
algorithm. In our proposed heuristic, we use k
eigenvalue and eigenvector pairs that correspond to
the 95% of the proportion of variance explained.
Eigenvalues are written as λ
1
, λ
2
, .., λ
k
. Eigenvectors
are written as e
id
where i=1..k, d=1..D and D is the
number of features. Then the weight of feature d is
estimated as a weighted sum of the corresponding
eigenvector elements as given in Equation 8.
∑
∑
=
i
idi
d
e
w
λ
λ
(10)
The weights are then scaled to lie in the [0, 1]
interval by dividing each weight by the maximum
one.
4 EXPERIMENTS AND RESULTS
We have evaluated 8 public datasets (real software
applications) obtained from NASA MDP Repository
in our experiments (Nasa, 2007) (See Table 1).
Sample sizes of the projects vary from 125 to 5589
modules, which enables experiments in a range of
both small and large datasets. Each dataset has 38
features representing static code attributes. Modules
with error counts greater than zero are assumed to be
defective.
We have used probability of detection (pd) and
probability of false alarm (pf) as the performance
measures following the research by Menzies et.al.
(2007). Formal definitions for these performance
criteria are given in Equations 11 and 12
respectively and they are derived from the confusion
matrix given in Table 2. pd is a measure of accuracy
for correctly detecting the defective modules.
Therefore, higher pd's are desired. pf is a measure
for false alarms and it is an error measure for
incorrectly detecting the non-defective modules. pf
is desired to have low values. Since we need to
optimize two parameters, pd and pf, a third
performance measure called balance is used to
choose the optimal (pd, pf) pairs. balance is defined
as the normalized Euclidean distance from the
desired point (0,1) to (pd, pf) in a ROC curve
(Menzies et.al., 2007).
We have compared the standard Naïve Bayes
classifier with the three Weighted Naïve Bayes
ICSOFT 2007 - International Conference on Software and Data Technologies
246

classifiers constructed by using the three heuristics
described in Section 3. We have also reproduced the
experiments that are reported in Menzies et.al.
(2007) for comparison.
Table 1: Datasets from NASA Repository.
Name
#
Features
#Modules DefectRate(%)
CM1 38 505 9
PC1 38 1107 6
PC2 38 5589 0.6
PC3 38 1563 10
PC4 38 1458 12
KC3 38 458 9
KC4 38 125 4
MW1 38 403 9
We have used 10-fold cross-validation in all
experiments. That is, datasets are divided into 10
bins, 9 bins are used for training and 1 bin is used
for testing. Repeating these 10 folds ensures that
each bin is used for training and testing while
minimizing the sampling bias. Each holdout
experiment is also repeated 10 times and in each
repetition the datasets are randomized to overcome
any ordering effect and to achieve reliable statistics.
To summarize, we have performed 10x10=100
experiments for each dataset and our reported results
are the mean and standard deviations of these 100
experiments for each dataset. We have applied t-test
with α=0.05 in order to determine the statistical
significance of results. All implementations are done
in MATLAB environment. Mean results of 100
experiments for each dataset are tabulated in Table
3. Statistically significant results are indicated in
bold face.
Table 2: Confusion Matrix.
Estimated
Real Defective Non-defective
Defective A C
Non-defective B D
pd = (A) / (A+C) (11)
pf = (B) / (B+D) (12)
First thing to notice is that the standard Naïve
Bayes and PCA based heuristic are outperformed by
other methods. Both methods show statistically
significantly worse performances than others in all
datasets. They also perform similar behaviours to
each other. From this observation, we conclude that
Naïve Bayes is innately capable of discovering the
linear relative importance of features, i.e. lesser
weighted features already contribute less to the
computation of posterior probabilities.
Other heuristics based on InfoGain and
GainRatio estimates feature weights in a nonlinear
fashion. In 3 cases (PC1, PC3, KC3), they perform
equivalently and they are statistically significantly
better than other methods. In other 3 datasets (PC2,
KC4, MW1) there is no statistical difference
between the performances of these heuristics and
IG+NB. In one case (PC4) our proposed heuristic
based on InfoGain outperforms all other methods.
This is also the case for IG+NB in one case (CM1).
InfoGain and GainRatio heuristics achieve
higher pd and pf values compared to IG+NB. We
argue that the projects that require high reliability
should have higher pd values. The datasets in this
research come from NASA’s critical systems.
Therefore, InfoGain and GainRatio based heuristics
may be preferred over IG+NB.
Table 3: Results of 10x10=100 hold-out experiments.
WNB+H1 (%) WNB+H2 (%) WNB+H3 (%) NB (%) IG+NB (%)
Data
pd pf bal pd pf bal pd Pf Bal pd pf bal pd pf Bal
CM1 82 39 70 82 39 70 51 50 50 48 46 51 83 32
74
PC1 69 35
67
69 35
67
41 38 51 41 38 51 40 12 57
PC2 72 15
77
66 20 72 31 27 47 30 26 47 72 15
77
PC3 80 35
71
81 35
72
46 41 52 46 40 52 60 15 70
PC4 88 27 79 87 24
81
43 35 52 43 35 52 92 29 78
KC3 80 27
76
83 30
76
45 38 53 41 35 52 48 15 62
KC4 77 35
70
78 35
71
60 57 51 57 53 52 79 33
72
MW1 70 38
66
68 34
67
54 51 51 42 40 51 44 07
60
Avg: 77 31 72 77 32 72 46 42 51 44 39 51 65 20 61
SOFTWARE DEFECT PREDICTION: HEURISTICS FOR WEIGHTED NAÏVE BAYES
247
Overall evaluation yields 6 wins for InfoGain
and GainRatio heuristics and 4 wins for IG+NB.
These results indicate that our approach yields
comparable and in some occasions better results than
the ones reported on these datasets so far. Let us use
a simple ranking scheme for comparing these
methods: Distribute 3 points (since it is the
maximum number of concurrent winners) evenly
among winners in each case, i.e. 3 points to single
winner, 1.5 points for each in two winners case, and
1 point for each in three winners case. Then our
InfoGain based heuristic receives 9.5 points,
GainRatio based heuristic receives 8 points and
IG+NB receives 6.5 points.
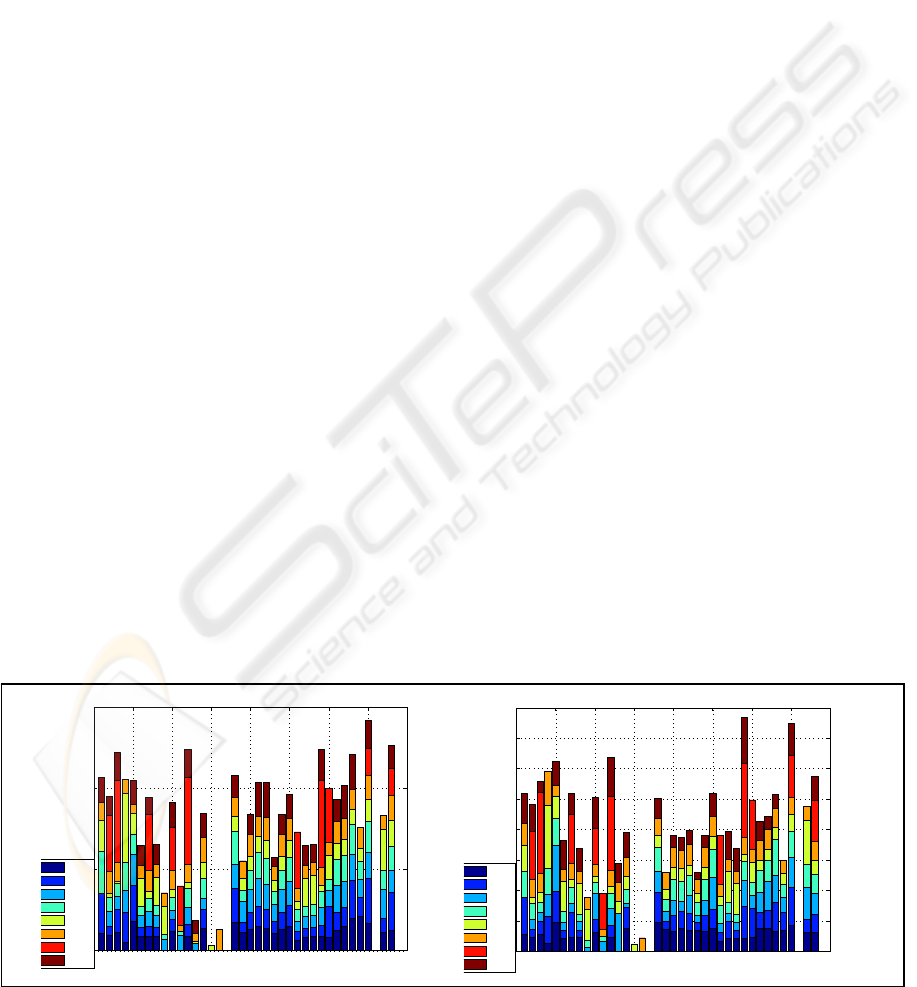
In Figure 1, we have plotted the relative weights
of 38 metrics available in the datasets. Figure 1
shows the cumulative metric weight sums over 8
datasets. The plot on the left shows these values for
InfoGain based heuristic and the plot on the right
plots values for GainRatio based heuristic.
Examining Figure 1, we see that metrics enumerated
with 17 and 36 are never used. These metrics are
‘Global Data Density’ and ‘Pathological
Complexity’. (For a complete list of metrics, see
(Nasa, 2007). An analysis of datasets shows that
these metrics have a unique value for all modules for
most of the datasets. Thus, they do not have any
discriminative power and they are eliminated. Also
metrics enumerated with 15 and 16 (‘Parameter
Count’ and ‘Global Data Complexity’) are used only
in PC4 and KC3 where similar observations are
valid. The general trend of weight assignment by
both heuristics is similar. Metrics enumerated by 3,
12, 29, 33, 35 ,38 which are ‘Call Pairs’, ‘Edge
Count’, ‘Node Count’, ‘Number of Unique
Operands’, ‘Total Number of Lines’ and ‘Total
Number of Line of Code’ respectively, are
consistently selected by these heuristics. This
collective set of software metrics are in total
accordance with the ones that Menzies et. al. (2007)
reported for subset selection.
5 CONCLUSIONS
This paper presented an application of defect
prediction built on weighted features. We have used
three heuristics in order to estimate the weights of
features based on their relative importance. Two
novel heuristics are introduced for this purpose. We
have evaluated our approach on Weighted Naïve
Bayes predictor, which is an extension of standard
Naïve Bayes. To the best of our knowledge, the
weighted features approach is a novel one in defect
prediction literature. We observed linear methods for
feature weighting lack the ability to improve the
performance of Naïve Bayes, while non-linear ones
give promising results. Our results indicated that the
proposed approach may produce statistically
significantly better results for defect prediction.
From a software practitioner’s point of view,
these results may be useful for detecting defects
before proceeding to the test phase. Additionally,
many companies in the software market develop
their standards or make use of the best practices
from industry, to determine the thresholds for
software metrics in order to guide developers during
implementation. Weights related to these metrics can
be investigated for sensitivity analysis. Our results
indicate that the impact of changes in software
metrics, to the defect rate of the final product should
vary for different metrics. Since many software
metrics are in different scales, such an analysis can
establish units of change for these metrics. All these
ideas can be implemented as a tool that performs the
mentioned analysis and offers recommendations to
developers for overall quality.
0 5 10 15 20 25 30 35 40
0
2
4
6
8
10
12
14
16
Enumerated Metrics
Cumilative GainRatio Feature Weights
GainRatio Weights
CM1
PC1
PC2
PC3
PC4
KC1
KC3
MW1
0 5 10 15 20 25 30 35 40
0
5
10
15
Enumerated Metrics
Cumilative InfoGain Feature Weights
InfoGain Weights
CM1
PC1
PC2
PC3
PC4
KC1
KC3
MW1
Figure 1: Metric weights.
ICSOFT 2007 - International Conference on Software and Data Technologies
248

ACKNOWLEDGEMENTS
This research is supported in part by Bogazici
University research fund under grant number BAP-
06HA104.
REFERENCES
Alpaydin, E., “Introduction to Machine Learning.”, The
MIT Press, October 2004.
Auer, M., Trendowicz, A., Graser, B., Haunschmid, E. and
Biffl, S., “Optimal Project Feature Weights in
Analogy Based Cost Estimation: Improvement and
Limitations”, IEEE Transactions on Software
Engineering., 32(2), 2006, pp. 83-92.
Basili, V. R., Briand, L. C., and Melo, W. L., “A
Validation of Object-Oriented Design Metrics as
Quality Indicators”, IEEE Transactions on Software
Engineering, 22(10), 1996, pp. 751-761.
Domingos, P. and Pazzani, M., “On the Optimality of the
Simple Bayesian Classifier under Zero-One Loss”,
Machine Learning., 29(2-3), 1997, pp. 103-130.
Fenton, N.E. and Neil, M., “A critique of software defect
prediction models”, IEEE Transactions. on Software.
Engineering., 25(5), 1999, pp. 675–689.
Fenton, N. and Ohlsson, N., “Quantitative Analysis of
Faults and Failures in a Complex Software System,” ,
IEEE Transactions on Software Engineering., 2000,
pp. 797-814.
Frank, E., Hall, M., Pfahringer, B., “Locally weighted
naive Bayes”, In Proceedings of the Uncertainty in
Artificial Intelligence Conference, Acapulco, Mexico,
Morgan Kaufmann, 2003, pp. 249-256.
Hall, M., “A decision tree-based attribute weighting filter
for naive Bayes”, Knowledge-Based Systems., 20(2),
2007, pp. 120-126.
Harrold, M. J., “Testing: a roadmap”, In Proceedings of
the Conference on the Future of Software Engineering,
ACM Press, New York, NY, 2000, pp. 61-72.
Khoshgoftaar, T. M. and Seliya, N., “Fault Prediction
Modeling for Software Quality Estimation: Comparing
Commonly Used Techniques”, Empirical Software
Engineering., 8(3), 2003, pp. 255-283.
Lewis, D. D., “Naive (Bayes) at Forty: The Independence
Assumption in Information Retrieval”, In Proceedings
of the 10th European Conference on Machine
Learning, C. Nedellec and C. Rouveirol, Eds. Lecture
Notes In Computer Science, vol. 1398. Springer-
Verlag, London, 1998, pp. 4-15.
Menzies, T., Stefano, J. D., Chapman, M., “Learning Early
Lifecycle IV and V Quality Indicators,” In
Proceedings of the IEEE Software Metrics
Symposium, 2003.
Menzies, T., DiStefano, J., Orrego, A., Chapman, R.,
“Assessing Predictors of Software Defects,” In
Proceedings of Workshop Predictive Software
Models, 2004.
Menzies T., Greenwald, J., Frank, A., “Data mining static
code attributes to learn defect predictors”, IEEE
Transactions on Software Engineering, 33(1), 2007,
pp. 2–13.
Mladenic, D. and Grobelnik, M., “Feature Selection for
Unbalanced Class Distribution and Naive Bayes”, In
Proceedings of the Sixteenth international Conference
on Machine Learning, I. Bratko and S. Dzeroski, Eds.
Morgan Kaufmann Publishers, San Francisco, CA,
1999, pp. 258-267.
Munson, J. and Khoshgoftaar, T. M., “Regression
modelling of software quality: empirical
investigation”, Journal of Electronic Materials., 19(6),
1990, pp. 106-114.
Munson, J. and Khoshgoftaar, T. M., “The Detection of
Fault-Prone Programs”, IEEE Transactions on
Software Engineering., 18(5), 1992, pp. 423-433.
Nagappan N., Williams, L., Osborne, J., Vouk, M.,
Abrahamsson, P., “Providing Test Quality Feedback
Using Static Source Code and Automatic Test Suite
Metrics”, International Symposium on Software
Reliability Engineering, 2005.
Nasa/Wvu IV&V Facility, Metrics Data Program,
available from http://mdp.ivv.nasa.gov; Internet;
accessed 2007.
Padberg, F., Ragg T., Schoknecht R., “Using machine
learning for estimating the defect content after an
inspection”, IEEE Transactions on Software
Engineering, 30(1), 2004, pp: 17- 28.
Quinlan, J. R. “C4.5: Programs for Machine Learning.”,
Morgan Kaufmann, San Mateo, CA, 1993.
Shepperd, M. and Ince D., “A Critique of Three Metrics,”
Journal of Systems and Software., 26(3), 1994, pp.
197-210.
Song, O., Shepperd, M., Cartwright, M., Mair, C.,
"Software Defect Association Mining and Defect
Correction Effort Prediction," IEEE Transactions on
Software Engineering., 32(2), 2006, pp. 69-82.
Tahat, B. V., Korel B., Bader, A., "Requirement-Based
Automated Black-Box Test Generation", In
Proceedings of 25th Annual International Computer
Software and Applications Conference, Chicago,
Illinois, 2001, pp. 489-495.
Zhang, H. and Sheng S., “Learning weighted naive Bayes
with accurate ranking”, In Proceedings of the
4
th
IEEE International Conference on Data Mining,
1(4), 2004, pp. 567- 570
Zheng, Z. and Webb, G. I., “Lazy Learning of Bayesian
Rules”, Machine Learning., 41(1), 2000, pp. 53-84..
SOFTWARE DEFECT PREDICTION: HEURISTICS FOR WEIGHTED NAÏVE BAYES
249
