
METHODOLOGY AND SYSTEM OF EVALUATING THE
DRIVER’S VIGILANCE LEVEL IN AN AUTOMOBILE
TRANSPORTATION EXAMINING BOTH PHYSIOLOGICAL
AND MECHANICAL DATA
A. Giusti, C. Zocchi and A.Rovetta
Politecnico di Milano, Piazza Leonardo da Vinci 32, Milan, Italy
Keywords: Sleep-attack, vigilance level, physiological and mechanical data, automobiles.
Abstract: This paper deals with the methodology followed in order to design a new intelligent system to improve the
driver’s safety in an automobile transportation and the actual realization of a first prototype. The results of
the study are reported. A simulator system has been developed at the Robotics Laboratory of the
“Politecnico di Milano”. A description of the necessary hardware and architecture is made in detail. Driver’s
physiological data, acquired from sensors on the wheel, is correlated, using statistical multivariate analysis,
with his/her vigilance level evaluated using polysomnography. This statistical model is applied on the data
off-line in order to define a controller, to be applied on real time acquired data. The platform’s mechanical
data is also acquired and studied. All the elaboration of the data results in one vigilance level index for the
current driver and situation. Future steps and possibilities are also discussed.
1 INTRODUCTION
Many projects in European Union (EU) programs
are devoted to the increase of safety in automobiles,
in order to reduce deaths and accidents down to 50%
in the next few years (Istat, 2001) Project PSYCAR
(Psycho physiological Car) funded by EU in a
Regional plan, starting from Lombardy Italian
Region and Austrian Region, is one of these
projects. The “Politecnico di Milano” university,
along with the Linz Kepler University cooperated in
the development of the project.
Apart from these EU programs, almost all
automobile industries are studying new methods to
improve active safety. Most of these methods are
based on examining the engine’s mechanical and the
car’s dynamical parameters or on camera vision
systems continuously monitoring the driver (Citroen,
2007, Seat, 2006). Nevertheless, the greatest
disadvantage of such systems lies on the fact that a
possible driver’s head turning or lowering can be a
huge problem for the camera’s view and so can put
the whole system out of order. In addition to that,
the high complexity of vision software can add
financial and technical obstacles in the system. Such
systems have been proposed by BMW and SEAT.
Mercedes-Benz is also working on the same
direction according to a recent article (Omniauto,
2006).
The methodology presented by this paper is
innovative for the field of automotive safety. Its
innovation lies on the fact that all the driver’s
physiological parameters are acquired using sensors
on the wheel, which are continuously in contact with
the driver’s body. The driver does not have to do
anything in particular or, in any mode, different
from what he is used to do when entering and
driving his/her vehicle, as in other safety systems
(Saab, 2006, Gizmag, 2005). Intelligent sensor
placement is fundamental for the system’s
applicability. A possible loss of contact with the
driver’s body, is by itself a safety decrease
information, because can only mean that the driver
has taken his hands off the wheel. Several car’s
dynamical and mechanical parameters are also
acquired and evaluated. This combination of the
car’s behaviour with the driver’s physiological state
is another innovation presented by this paper and the
future of automotive safety may lie on this
combination. The system also stores all the data
acquired in order to self- improve with time, using
310
Giusti A., Zocchi C. and Rovetta A. (2008).
METHODOLOGY AND SYSTEM OF EVALUATING THE DRIVER’S VIGILANCE LEVEL IN AN AUTOMOBILE TRANSPORTATION EXAMINING BOTH
PHYSIOLOGICAL AND MECHANICAL DATA.
In Proceedings of the First International Conference on Biomedical Electronics and Devices, pages 310-316
DOI: 10.5220/0001046003100316
Copyright
c
SciTePress

neural network techniques which will be
implemented in the next phase of the project.
The output of the system proposed by this paper
is a vigilance level index, easily interpreted by the
driver. Indices can be collected and can be sent to a
centre of suggestions, in a tele-assistance shape
(Rovetta, 1995).
2 SELECTION OF THE
PHYSICAL PARAMETERS TO
BE MEASURED
Since the number of parameters to measure in such a
system is enormous, a very important part of the
procedure is the selection of the right parameters to
measure (Zocchi, 2005, Rovetta, 2005). The
physiological parameters that can be measured and
that can determine the driver’s condition and ability
to drive are not so categorically determined.
A large scale research has been done through
years by numerous universities and research teams,
to define the physiological and neurological
parameters that can determine a possible drop in the
person’s vigilance level. Using the results from these
researches, a selection of the necessary sensors is
made. Based on that, blood pressure, cardiac and
respiratory frequencies, hand trembling, galvanic
skin resistance, heart rate variability, body
temperature, blood alcohol and oxygen
concentration and cerebral waves are physiological
parameters that can possibly detect a person’s
neurophysiologic state (Rovetta, 2001).
Two different sets of parameters are chosen to be
measured. The discrimination is made because of the
fact that some parameters are measured only to
determine the driver’s attention level and are used
only in the research phase as an index to which the
second set of the parameters is correlated. The
second set consists of the parameters that will
continue to be used on the real cars, and that
obviously are only the signals from the sensors on
the wheel.
The first set consists of the polysomnography
parameters along with the driver’s reaction time. A
medical team is assisting the Robotics Laboratory of
the Politecnico di Milano team in acquiring all these
parameters and also in their interpretation. The
polysomnography parameters acquired are presented
in the table (Table 1) and they are used as an index
of the driver’s attention, to which all the other
acquired parameters are correlated.
The second set of measured parameters consists
of the driver’s Galvanic Skin Resistance (GSR),
Heart Rate Variability (HRV) and body temperature
(THE), which are measured using sensors on the
wheel.
Table 1: The physical parameters acquired with the
medical equipment.
Polysomnographical parameters acquired
Electro- Cardio- Graph (EKG)
Electro- Encephalo- Graph (EEG), 4 channels
Electro- Oculo- Graph (EOG), 2 channels
Chin Electro- Myo- Graph (EMG)
Peripheral Body Temperature (THE)
Nasal Pressure
Blood Oxygen Concentration
Respiratory Frequencies, 2 channels
3 SIGNAL ACQUISITION,
CONDITIONING AND DATA
STORING
In order to collect the GSR (Galvanic Skin
Resistance), THE (Peripheral Body Temperature)
and HRV (Heart Rate Variability) signals from the
steering wheel, a portable system has been
developed by the ELEMAYA Company, on
demand. For the GSR, two silver plates are used and
the skin’s galvanic resistance is measured across
them. For the HRV signal a photoplethysmographic
sensor is used, while for the THE a simple
thermocouple is used. All these signals are filtered
and amplified by the same ELEMAYA system. The
A/D converter is a National Instruments DAQ-card
6062E. All electronic board aspects were studied
(Klaassen, 1996, O'Dell, 1991, Sangwine, 1994,
Doebelin, 2004). The digitization of the signals is
made at a sampling frequency of 200Hz, following
the Nyquist criteria.
The data from the mechanical platform is
acquired using a PC and a C program. The program
is the same that simulates the road and the car
movement. The sampling rate was set to 65 Hz. The
data analysis was concentrated on the straight parts
of the road, since the turning highly depends on each
driver’s ability to drive and in addition to that it
highly unlikely that someone falls asleep when
turning. In addition to that, the data acquired during
the driver’s attempt to avoid the appearing obstacles
was also neglected.
METHODOLOGY AND SYSTEM OF EVALUATING THE DRIVER’S VIGILANCE LEVEL IN AN AUTOMOBILE
TRANSPORTATION EXAMINING BOTH PHYSIOLOGICAL AND MECHANICAL DATA
311

Especially for the calculation of the error in the car’s
position, the ideal position that the driver had to
follow was the right lane of the circuit that
corresponded to constant y position in the Cartesian
coordinates space. Based on this, the error that the
driver made was calculated as the difference from
the ideal position. The error data was normalized for
each driver separately to eliminate as much as
possible the interference of each person’s driving
capacity and style. In this way, the final available
data for analysis were vectors containing for each
driver the normalized error in the car’s position.
The polysomnographical hardware used consists
of a portable medical apparatus capable of acquiring
all the necessary signals. The analysis of these
signals determines the driver’s status. In total, these
signals are 37 and are presented in Table 1. The
software for this polysomnographical acquisition is
the Madcare’s Somnological Studio. The software is
capable of saving all the acquisition session data in
one and only European Data Format file (.edf),
which then is converted into a simple ASCII text
file, using the NeuroTraces edfAsc program. These
text files are loaded and examined in MATLAB. The
sampling rate frequency is set to 200 Hz.
The polysomnographical and mechanical
platform signals are automatically filtered, while the
signals from the steering wheel are first filtered by
the acquisition system, using hardware, and then by
software because of their specific needs. In
particular, for the HRV signal the cut off frequency
has been set to 10 Hz, for the GSR to 0.1 Hz and for
the THE to 0.8 Hz. For determining the correct cut-
off frequencies for every signal, medical advises has
been followed and Fourier analysis has been made.
Steering wheel signals data storing is made using
MATLAB data acquisition files (.daq). These files
are easily handled by MATLAB and also allow
storing the exact acquisition start time and date. All
the data is stored in one matrix, where every column
array corresponds to one sensor and every row array
corresponds to one sampling session (1/200 sec.).
The data from the mechanical platform is stored in
simple text files.
4 PROTOCOL FOR THE
SIMULATION SYSTEM
The simulations are made on two different driver
conditions. In the first part, the driver has slept
during the last night, while in the second he/ she has
been awake for twenty-four hours. In the first state
the nominal conditions of the person are evaluated,
while in the second the altered ones. During the tests
made with the driver not having slept, when sleep is
detected while he/she is undertaking the simulation,
the driver is waken up. In this way, the transition
phases are better examined. The simulations are
always made in dark and noiseless conditions in
order for the person to have much more possibilities
to fall asleep or to lose attention.
Before starting the data acquisition, a
questionnaire is completed by the person responsible
for the simulation, on which the date, the time and
environmental conditions are written. The car at the
start of every simulation session is always positioned
at the same point of the virtual circuit. Each subject,
before driving on the simulation for the first time is
also trained to use the simulator and to always
follow the same pre-defined route.
After these initial procedures, the driver starts the
simulation and the data acquisition is also initialized.
During the procedure and in pre-defined times that
the subject does not know, an obstacle appears on
the screen and the driver has to push the brake. In
this way, his/her reaction time is measured and
stored among all the other parameters acquired. This
response time along with the data from the
polysomnography signals (Rovetta, 1997, Pinelli
1998) determine his/her attention level.
5 OFF-LINE ANALYSIS.
STATISTICS ON THE
ACQUIRED DATA
At the end of every simulation data from both the
sleepy subjects and the control group is divided in
three categories, as shown in table 2.
The purpose of the statistical analysis is to find a
relation between all the measured parameters and the
driver’s vigilance level decrease. The index of the
driver’s vigilance is measured by studying the EEG
signals and the driver’s reaction time to the
appearing obstacles. These analyses focus on two
different directions. First, the general behaviour of
the signals as the driver moves towards sleepiness is
studied. Then, the behaviour of the same signals the
exact minute before a sleep-attack is studied. The
exact time of a sleep-attack is determined, using
EEG Power Spectral Density (PSD) analysis and
medical experience.
For the EEG PSD analysis, after studying all the
possible solutions, the α+β (Eoh, 2005) cerebral
waves method is chosen as the most appropriate
BIODEVICES 2008 - International Conference on Biomedical Electronics and Devices
312
method. After determining the exact time of the
sleep-attack, all the data from the minute before this
Table 2: The signals acquired during the driving
simulations for evaluation and statistical analyses.
Physiological
data from the
steering wheel
Mechanical
data from the
simulator
Reference
data
HRV
Steering wheel
position
Polysomnog
raphical
signals
GSR
Accelerator
pedal position
Reaction
time
THE
Brake pedal
position
Car’s position
on the road
Car’s speed
sleep-attack is divided in ten-second intervals and
analyzed statistically. This procedure is necessary
for also studying the exact time interval before the
sleep-attack in which some interesting phenomena
occur.
The stored data is statistically analyzed using
MATLAB (ver. 7, rev. 14). The observed
phenomenon is not linear and so a standard linear
analysis is not adequate. Multivariate analysis is
used in order to identify categories of input that are
related to a certain output index.
Different analysis types are used to determine all
the necessary statistical parameters. First an analysis
is made based on simple mean value and variation
observation for every signal acquired and every
different driver condition status. In addition,
correlation and cross-correlation matrices are
calculated to determine a possible correlation of one
acquired parameter to another, but also to correlate
all the acquired parameters with the driver’s safety
index, derived from the polysomnographical data.
Furthermore, a cluster analysis is made on the
data, in order to investigate grouping in the data,
simultaneously over a variety of scales, by creating a
cluster tree that is not a single set of clusters, but
rather a multi-level hierarchy, where clusters at one
level are joined as clusters at the next higher level.
This allows deciding what level or scale of
clustering is most appropriate in the application.
Discriminant analysis, also used and applied on the
data, determines one ore more parameters that better
discriminate two populations.
The data from the mechanical platform is also
analyzed in the same way. The results of these
analyses are presented on the appropriate section of
this article.
6 REAL-TIME PROCEDURE
The off-line statistical procedure is useful for setting
up the real-time system prototype. In this prototype,
the only parameters acquired are the non-invasive
ones (GSR, THE, HRV) with the sensors on the
steering wheel and also the data from the mechanical
platform (Table 2). Together with the data, the
driver’s ID is also stored. In this way, the system
becomes personalized and will be in a later phase
trained based on the driver’s personal characteristics.
The driver’s ID is obtained by his key, in a real car,
or by a password, on the simulator. The saved data is
in this phase also used for calculating the mean
values of the heart beats number and the steering
wheel’s standard deviation values, needed for
normalizing the data.
All the parameters enter a Fuzzy logic classifier
that, based on the statistical results made off-line,
determines if the driver has a high possibility of
being sleepy. Practically, the classifier continuously
monitors the acquired data in order to determine a
possible movement of the driver versus sleep. If the
driver is found to be probably sleepy, then the
system is put into alertness in order to focus on
detecting a possible sleep attack and alert the driver.
The simulator system program uses a MATLAB
function to call the fuzzy system and calculate the
safety index as well as for retrieving the important
parameters for every signal. This is because the
signals do not enter directly the Fuzzy classifier, but
first need a small elaboration. For example, in order
to retrieve the heart beats per minute number from
the HRV signal.
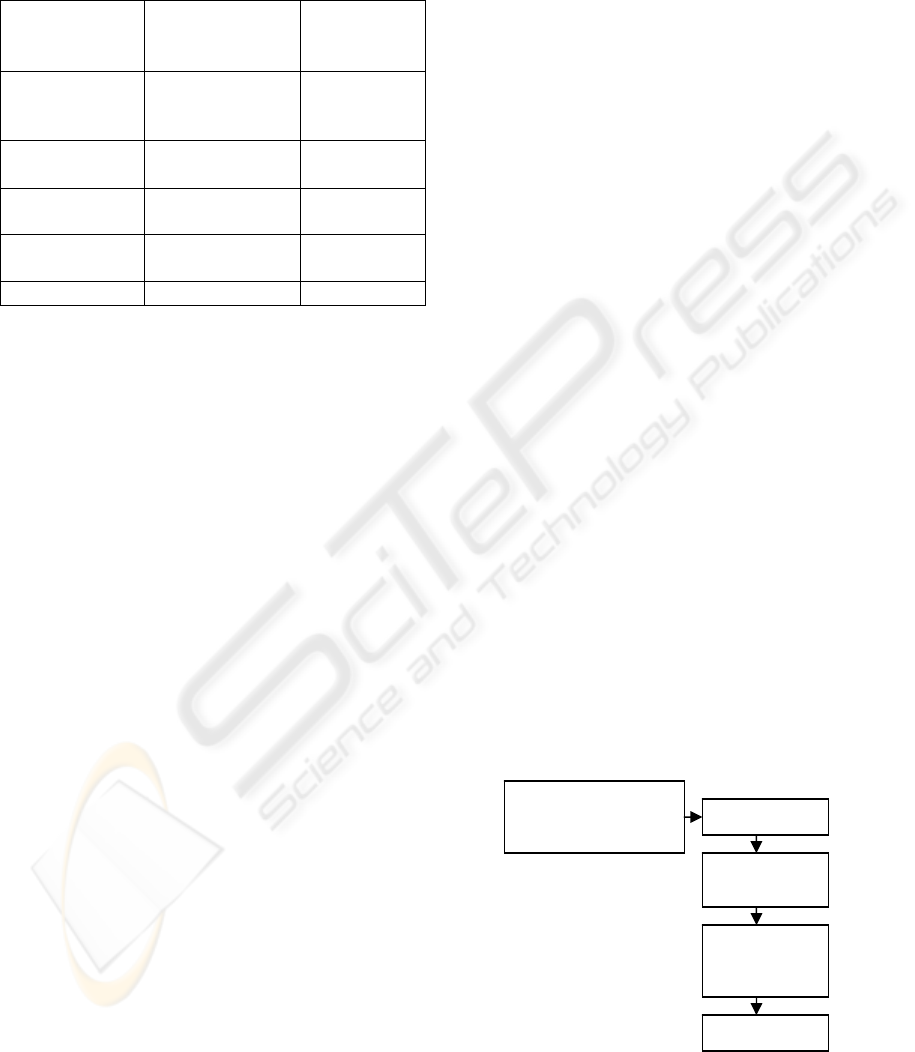
Figure 1: Real-time procedure flow diagram.
Data acquisition of
HRV, GSR, THE and
steering wheel position
Pre-processing
Fuzzy
classifier
HRV and
steering wheel
variations
Alarm
METHODOLOGY AND SYSTEM OF EVALUATING THE DRIVER’S VIGILANCE LEVEL IN AN AUTOMOBILE
TRANSPORTATION EXAMINING BOTH PHYSIOLOGICAL AND MECHANICAL DATA
313
As shown in figure 1 (Fig.1), if the classifier detects
a high possibility of sleepiness, then the system stays
alert for monitoring the heart beats number
variations as well as the steering wheel position
variations. If high standard deviation values are
detected in the heart beats signal or very low
standard variations in the steering wheel position
signal, the system alerts the driver with a sound. The
thresholds were chosen to be 10 beats for the heart
beats number and 0.5 in the normalized steering
wheel position standard deviation. This procedure
was chosen according to the results reported in
section 7.
7 RESULTS
By observing the data acquired during simulations
made with persons that did sleep during the night
before, some interesting facts on their mean GSR
value can be noticed. The more difficult the driving
conditions, the lower the GSR values. The skin’s
galvanic resistance is inversely proportional to its
perspiration and so this result means that the driver
skin’s perspiration is higher when the driving
conditions are difficult (curved circuit, fast car
speed). This also means that the driver is more
vigilant when the simulation conditions are difficult,
because of the fact that the skin’s perspiration is
inversely proportional to the person’s relaxation
(Hancock, 1996). Examined from another point of
view, the lower the GSR value, the more vigilant the
driver. The raise of the GSR can be quite important,
even ten times higher than the normal value for
every person.
In addition to that, the number of heart beats per
minute decreases in sleepy subjects. Generally, as a
driver moves towards sleepiness his/her number of
heart beats decreases, something that was expected
as this phenomenon is common knowledge in
medicine. Finally, the THE value tends to drop
slowly as the subject get sleepy, but only of a few
decimals.
Using this information the fuzzy logic classifier
was designed and trained. Afterwards, some driving
simulations were made and the output of the
classifier was compared with the actual vigilance
level of the driver, defined by the medical analyses.
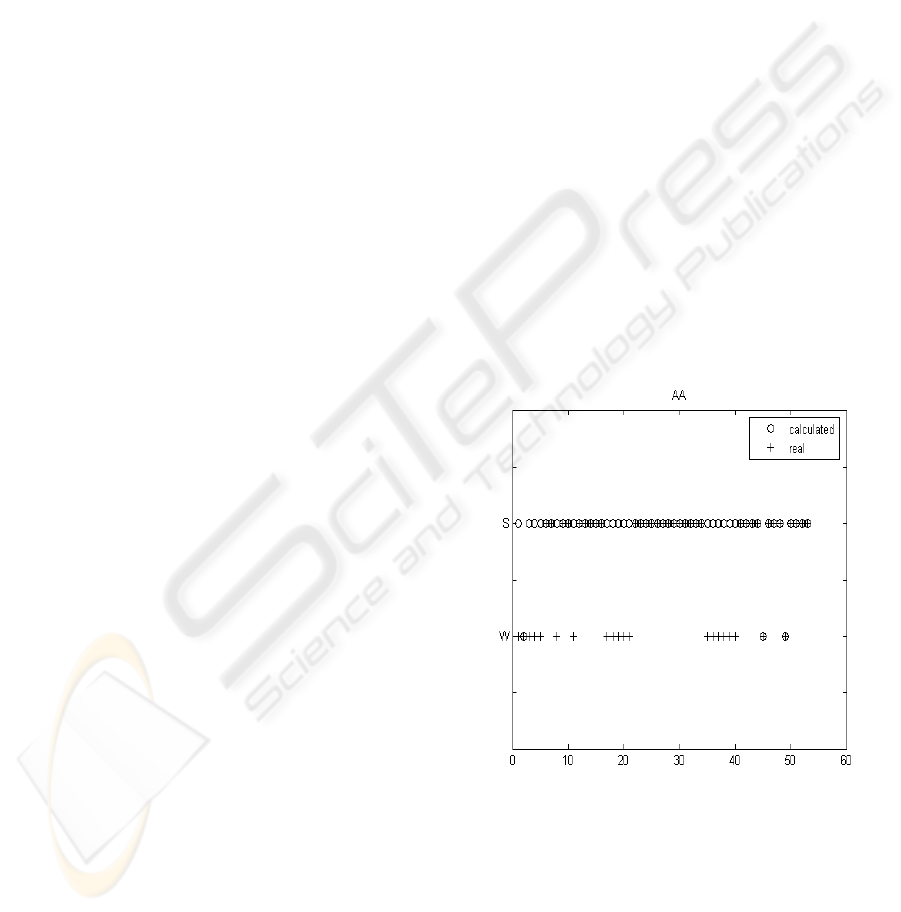
The results show a success of 60,68% to 79,61% and
are shown in figure 2 (Fig.2).
Apart from these observations concerning the
general behaviour of the chosen parameters towards
sleepiness, the most important results concern the
analysis of the data the minute before a sleep attack.
In these analyses the heart beats number and the
steering wheel position signals presented some very
interesting behaviour.
So, the heart rate generally tends to drop but the
most important thing noticed is that it presents some
significant variations twenty to thirty seconds before
the microsleep (Fig.3). At least in 76% of the cases
these variations were present. The percentage can
improve using a lower threshold value.
Finally, very small standard deviation values
were observed in the error in the car’s position
(Table 3) as well as in the steering wheel position.
The error the driver is making was calculated as the
difference from the ideal position of the car on the
road. Each driver has his/her own driving style and
so his/her own mean error values. The data were
normalized using these values. The important thing
noticed is that during the minute before the
microsleep the standard deviation value of the error
made is much lower that usual and so is the standard
deviation value of the steering wheel’s position. This
implies that, even if the driver is driving far from the
ideal position he/she is not moving the wheel as
usually does. This phenomenon was observed in
87,5% of the cases and can be augmented by
lowering the threshold value by only a little.
Figure 2: Confrontation between calculated and real
sleepiness level for 52 epochs with two sleepiness levels.
The ‘+’ symbols present the real sleepiness level while the
‘o’ ones present the calculated value for every epoch. For
every epoch, when the ‘+’ and the ‘o’ symbols coincide
the result is considered successful.
BIODEVICES 2008 - International Conference on Biomedical Electronics and Devices
314
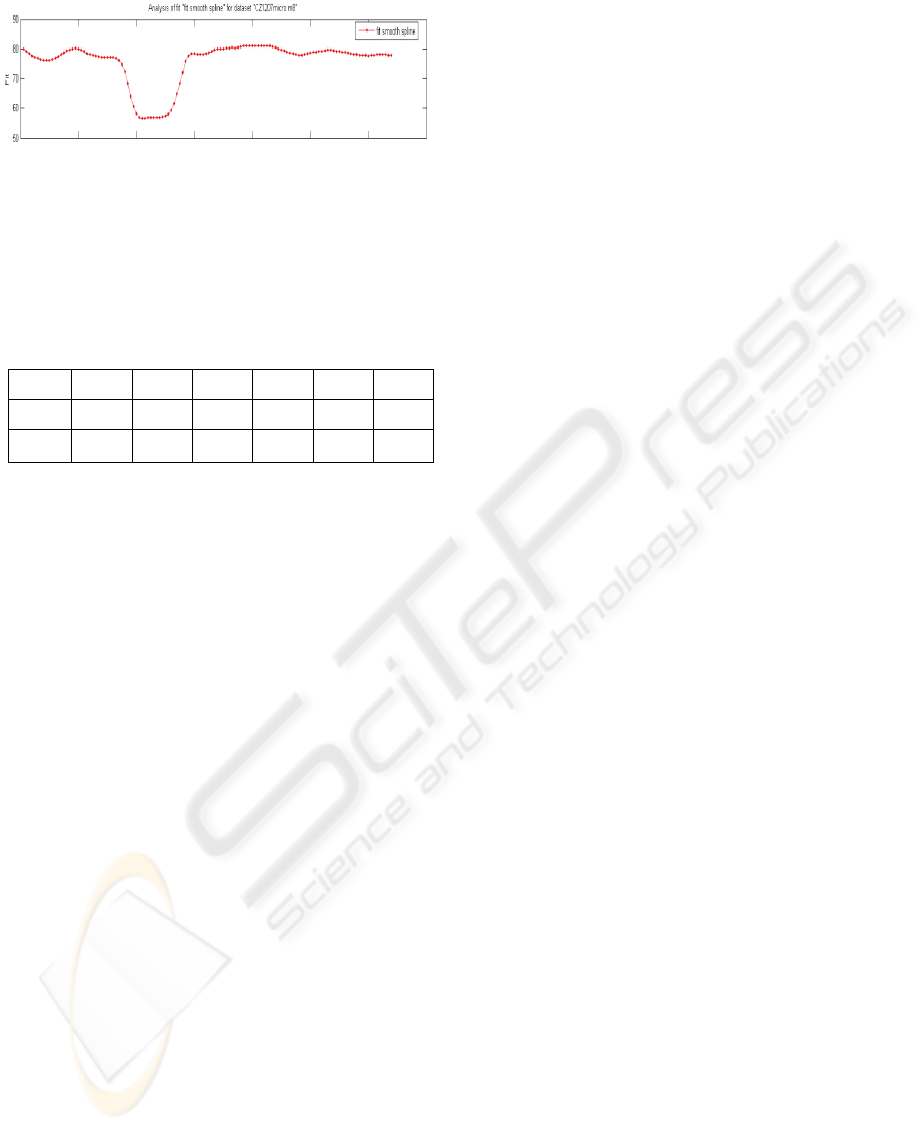
Figure 3: High variations in the heart beats number 40
seconds before a sleep-attack. The plot shows a B-spline
polynomial fit for a subject’s heart beat data. The number
of beats per minute vary from 55 to 80.
Table 3: A subject presenting very low standard deviation
values in the steering wheel’s movement, in respect to his
usual value. The six cells correspond to the six 10-second
intervals before the sleep-attack. The 6
th
interval are the
final 10 seconds before the sleep attack.
1 2 3 4 5 6
Mean 2.9958 1.1638 1.1764 0.9943 1.0264 1.1572
Std_va
r
2.8497 0.2137 0.0908 0.0822 0.2035 0.1555
8 FUTURE STEPS
A study on the applicability of neural networks to
the system described is in progress at the Politecnico
di Milano’s Laboratory of Robotics. The idea is to
use all the data acquired during a driving session
along with the current driver’s identity in order to
adapt the system to each particular driver. This will
be made at the end of every driving session, when
the engine stops, in order to ensure that the system’s
real time speed is not affected by this procedure. The
neural network shall be used to re-train the fuzzy
logic controller and make the system better with
time.
9 CONCLUSIONS
The results of the research here discussed are
promising. A control strategy based on the fuzzy
classifier and a controller that monitors the heart
beats number and the steering wheel position could
be applied for determining a high risk of sleep attack
and alert the driver.
The decrease in the heart beats number and the
peripheral body temperature, as well as the increase
in the GSR value are indicators of sleepiness that
could set the system into a general alert status. These
phenomena have a quite slow progress and so they
can only be used as pre-cursors of sleepiness and not
of an actual sleep-attack, which is a very fast
phenomenon (3-15 seconds). On the other hand, the
standard deviation values of the steering wheel
position and the heart beats number occur very fast
and permit an early notification of the driver, since
the phenomenon occurs usually 20- 30 seconds
before the sleep-attack. The standard deviation value
of the error in the car’s position cannot be used in an
actual car, as the ideal position is unknown but is a
useful parameter in simulated driving sessions (For
example if using this system in driving licence
exams).
The methodology discussed and proposed by this
paper among with the constructed simulation
prototype is innovative for the field of safety in
automobiles and is used in a daily basis to acquire
more data for the statistical analysis and the fuzzy
controller set-up. The final tests on a real car will
prove the applicability of the safety system
discussed and its capability to cover with the
maximum safety the drivers all over the world.
ACKNOWLEDGEMENTS
Thanks to Dr. Fanfulla and his medical team for
their help on valuating the polysomnographical data
as well as for their clinical advices. Thanks to all the
partners making suggestions such as Centro Stile
Alfa, Elasis, Brembo, Alcatel, Cefriel, Magneti
Marelli, STM, and particularly Fondazione
Politecnico for planning further research, together
with Regione Lombardia.
REFERENCES
Istat, 2001. Statistica degli incidenti stradali. Retrieved
Oc14, 2007 from, http://www.istat.it/salastampa/
comunicati/non_calendario/20051013_00/novita_edito
riale_incidenti _stradali_2004.pdf.
Citroen, 2007. Lane Departure Warning System – LDWS.
Retrieved October 14, 2007 from
http://www.citroen.com/cww/enus/technologies/securi
ty/afil/
Seat, 2006. Nuevos euipamientos. Retrieved on June 16,
2007 from
http://media.seat.com/view_manager.html?root=35,40
Omniauto, 2006. Mercedes contro il Colpo di Sonno.
Retrived on October 14, 2007 from
http://www.omniauto.it/magazine/2219/mercedes-
contro-il-colpo-di-sonno.
Saab, 2006. Saab AlcoKey Helps Drivers Steer Clear of
Drinking and Driving. Retrieved on October 14, 2007
frohttp://www.saabvideos.com/2006/10/11/saab-
METHODOLOGY AND SYSTEM OF EVALUATING THE DRIVER’S VIGILANCE LEVEL IN AN AUTOMOBILE
TRANSPORTATION EXAMINING BOTH PHYSIOLOGICAL AND MECHANICAL DATA
315

alcokey-helps-drivers-steer-clear-of-drinking-and-
driving/
Gizmag, 2005. Volvo experimenting with new safety
features. Retrieved on October 14, 2007 from
http://www.gizmag.com/go/4448/
Rovetta, A., Cosmi, F., 1995. Teleoperator Response in a
touch task with different display conditions. IEEE
Transaction on System, Man and Cybernetics, vol 25.
Zocchi, 2005. Report and Tables with sensors and
characters. Retrieved on October 14, 2007 from
ftp://robo55.mecc.polimi.it
Rovetta, 2005. Report on Parameters to be identified in
automotive Environment. Retrieved on October 14,
2007 from ftp://robo55.mecc.polimi.it
Rovetta A., 2001. Biorobotics: an Instrument for an
Improved Quality of Life. An Application for the
Analysis of Neuromotor Diseases. Int. Conf.
Proceedings On Automation and Robotics.
Klaassen, K., 1996. Electronic measurement and
instrumentation. Cambridge University Press.
O'Dell, T., 1991. Circuits for electronic instrumentation.
Cambridge University Press.
Sangwine, 1994. Electronic Components and technology.
CRC press.
Doebelin, E., 2004. Measurement Systems : Applications
and Design. Mc Graw Hill.
Rovetta, A., 1997. Detection and Multimodal Analysis of
Brain Weak Signals to Study Brain Funtion and
Disease. European Union Workshop.
Pinelli P., Baroni L., Zara D., Battaglia S., 1998.
Impairment of Delay Verbal Reactions in Dementia.
Advances in Occupational Medicine and
Rehabilitation, vol. 4, no. 3, pp. 87-93.
Eoh, J., Chung M., Kim, S., 2005.
Electroencephalographic study of drowsiness in
simulated driving with sleep deprivation. International
Journal of Industrial Ergonomics vol. 35, pp. 307–320
Hancock, P., Parasuraman, R., 1996. Driver-Centred
Issues in Advanced Automation for Motor Vehicles,
pp 337-364.
BIODEVICES 2008 - International Conference on Biomedical Electronics and Devices
316
