
QUALITY PERCEPTION OF SIMPLIFIED MODELS: NSA V S.
QSLIM
Frutuoso G. M. Silva
IT - Networks and Multimedia Group
Department of Computer Science and Engineering
University of Beira Interior, Portugal
Samuel S. Silva
Institute of Electronics and Telematics Engineering of Aveiro
University of Aveiro, Portugal
Keywords:
Simplification algorithms, Meshes, Quality perception.
Abstract:
Quality perception of simplified models is an important aspect for several applications. But, it is normally
evaluated only based on the analysis of geometrical errors of the simplified models. However, the analysis of
geometrical errors is not enough to evaluate the quality of the simplified models. The quality of the simplified
models and the execution times are the main aspects that distinguish the simplification algorithms. These
algorithms are of great interest in a variety of areas, since they allow the replacement of large models by
approximations with far fewer cells for manipulation and visualization purposes.
This paper presents a comparison between two simplification algorithms, NSA and Qslim, and shows the
difference between geometrical and graphical quality of the models. The comparison of results was made
using the PolyMeCo tool, which enables the analysis and comparison of meshes by providing an environment
where several visualization options and metrics are available and can be used in a coordinated way.
1 INTRODUCTION
The sophisticated modeling systems and 3D data ac-
quisition technologies enable us to create complex
and detailed geometric models. But in several appli-
cation fields these models are approximated by polyg-
onal meshes for manipulation purposes because of
their mathematical simplicity. However these mod-
els have normally redundant information that can be
removed.
Simplifying a polygonal mesh M
i
consists in gen-
erating another mesh M
j
with a lower number of cells.
The resulting mesh obeys a target criterion, which is
normally a measure of a maximum admissible error.
This error can be evaluated using different metrics and
the main difference between the algorithms is the met-
ric chosen. This metric has an influence in the quality
of generated meshes and also in the time performance
of the simplification algorithm.
The quality of the model can be evaluated using
different tools and metrics, and it is important to eval-
uate the geometric and graphical quality of the mod-
els. Normally, most works present only the results of
geometric quality ignoring the graphical quality of the
models. But quality perception of the simplified mod-
els depends both on geometrical and graphical qual-
ity. Note that the graphical quality (i.e., the visual
quality of the model) depends on several factors and
not only of the geometric quality of the model.
In this work the geometrical and graphical qual-
ity of the simplified models was compared for NSA
and Qslim algorithms using the PolyMeCo tool. This
tool provides an environment with several visualiza-
tion options and metrics which allow their usage in a
systematic and efficient way enabling a better percep-
tion of model quality.
Section 2 presents an overview of mesh compari-
son tools. The PolyMeCo tool is briefly described in
Section 3. The NSA algorithm is presented in Section
4, and the experimental results are discussed in Sec-
tion 5. Finally, Section 6 presents some conclusions.
2 MESH COMPARISON TOOLS
Mesh comparison is usually carried out with the help
of dedicated software tools that provide a numerical
and visual representation of the data, for example, the
74
G. M. Silva F. and S. Silva S. (2008).
QUALITY PERCEPTION OF SIMPLIFIED MODELS: NSA V S. QSLIM.
In Proceedings of the Third International Conference on Computer Graphics Theory and Applications, pages 74-79
DOI: 10.5220/0001094900740079
Copyright
c
SciTePress

minimum, mean and maximum value for a metric and
a model colored according to the obtained values at
each mesh vertex/face.
A few tools allowing features evaluation and
comparison are described in the literature. The
Metro (Cignoni et al., 1998b) tool, allows compar-
ing two polygonal meshes by computing the geomet-
ric distance between them and by depicting the results
using a colored model. It also provides the computa-
tion of the Hausdorff distance. According to the lit-
erature, this is the most used tool for mesh compar-
ison. Another tool, proposed by Zhou et al. (Zhou
and Pang, 2001), introduces some additional mea-
sures (e.g., surface curvature) and provides a few dif-
ferent visualization options (e.g., side-by-side view of
models). The MESH tool, developed by Aspert et
al. (Aspert et al., 2002), uses the Hausdorff distance
to measure the difference between two models and
presents a model colored according to the obtained re-
sults. The MeshDev (Roy et al., 2004) tool allows the
computation of geometric, normal, and other mesh at-
tribute deviations such as color and texture. Its output
is a VRML model depicting the obtained results.
However, these tools provide a small amount of
quality measures and lack several features which
would enable a more systematic comparison process.
To evaluate the results obtained, for example, with
different simplification methods, it is often necessary
to compare many models in order to reach a conclu-
sion. So, it is desirable that the mesh comparison tools
used support several models simultaneously for an ef-
ficient comparison of the results.
PolyMeCo is such a tool, and an overview of its
main features will be presented in the next Section.
3 POLYMECO TOOL
PolyMeCo (Silva et al., 2005) is a tool under devel-
opment, which provides an integrated environment
where mesh analysis and comparison can be per-
formed using several quality measures. Besides, the
results are properly presented to the user using dif-
ferent visualization options. These options include,
among others:
- Original vs Processed vs Colored Model, which
allows the simultaneous view of both models being
compared and a model colored according to the data
obtained with a particular measure;
- Features Comparison which allows the visualization
of data distributions obtained with the same compu-
tational measure for several processed models. This
can be very useful in situations where the purpose is
to study different processing algorithms and compare
the obtained results. In order to allow a proper com-
parison using colored models, PolyMeCo allows us-
ing a common color map for all compared models,
i.e., the maximum data value across all models is ob-
tained and all models are colored according to it. To
the best of our knowledge, this feature is not avail-
able in any other tool for mesh analysis and compari-
son and can significantly improve the way how users
explore the results. This option enables a better per-
ception of what is really happening with the analysed
models by inspecting the colored models only.
To analyse and compare polygonal meshes several
computational measures are available in PolyMeCo
and they can be divided in two groups: intrinsic prop-
erties and difference measures. Intrinsic
1
properties
allow the measurement of a particular property of a
mesh. Difference measures allow the comparison of
properties between two meshes, in general, the origi-
nal mesh and a processed version (e.g., through sim-
plification or compression).
For more details about the intrinsic properties
and difference measures available in PolyMeCo tool
see (Silva et al., 2005). A version of PolyMeCo for
test purposes is available in http://www.ieeta.pt/
polymeco/.
4 THE NSA ALGORITHM
There are several types of algorithms for simplifying
a polygonal mesh (see (Cignoni et al., 1998a), (Puppo
and Scopigno, 1997) and (Luebke, 2001)). They can
be broadly categorized into three classes: cell deci-
mation, vertex clustering and edge collapse.
The edge collapse algorithms simplifies a mesh by
iteratively collapsing edges into vertices. They tend to
preserve the topology but they may change it by col-
lapsing pairs of vertices that are not connected by an
edge (i.e., a ghost edge). The edge collapse operation
has the disadvantage that it may cause local surface
inversion.
The edge collapsing operation is standard. The
main difference between the various edge collapsing-
based simplification algorithms is the criterion used to
choose the next edge to collapse. A different criterion
implies different mesh quality, as well as a distinct
processing time. Generally, all simplification algo-
rithms make a trade-off between speed and the quality
of the resulting mesh.
QSlim algorithm follows a geometric criterion
that is based on the minimization of the error associ-
ated with each new vertex. This error is defined as the
1
Meaning a property which can be obtained from a mesh
regardless of any other mesh.
QUALITY PERCEPTION OF SIMPLIFIED MODELS: NSA VS. QSLIM
75
sum of the squared distances to the set of planes sur-
rounding the pair of the original collapsing vertices.
Thus, this algorithm produces simplified meshes with
a very good geometric quality since it minimizes the
error associated with each new vertex.
The simplification criterion used by NSA algo-
rithm is guided by the normal angle metric that is very
simple to compute. Thus, an edge is only collapsed
if the variation of the face normals around the target
edge (i.e., the faces that are incident on both vertices
adjacent to the edge) are within a given tolerance ε.
The value of ε is the threshold for the angle between
the current normal and the new normal after the edge
collapse operation.
In NSA algorithm the value of ε is adjusted auto-
matically according to the desirable reduction of the
number of faces of the mesh. A severe simplification
of the model, i.e., a great reduction in the number of
faces, implies a large value of ε. A small simplifica-
tion of the model implies a small value of ε. Note that
the number of faces of the mesh that will be created
is a input parameter to the NSA algorithm.
The normal angle criterion implies that the region
around the collapsing edge is nearly coplanar. In these
circumstances, we say that a region is quasi-coplanar.
But, the contrary is not true, i.e., the coplanarity does
not ensure a minimal variation of the face normals be-
cause we can have coplanar faces with opposite orien-
tations.
NSA algorithm guarantees the quasi-coplanarity
of the region to simplify and, at the same time, pre-
vents possible local folding or partial face overlapping
of the resulting mesh, because the edge collapse op-
eration is only allowed if the variation of the normals
is less than ε. Note that these situations have a great
variation of the face normals (see (Silva, 2007)).
Most authors distinguish between the simplifica-
tion criterion (i.e., the criterion to choose the next
edge to collapse) and the criterion that validates the
edge collapse operation. On the contrary, NSA al-
gorithm uses the same normal-based criterion to sim-
plify and validate the edge collapse operation.
NSA algorithm preserves the mesh boundaries be-
cause the collapse operation is not allowed whenever
at least one edge neighboring the collapsing edge has
only a single face incident on it. This means that the
boundary edges are never collapsed, so the boundaries
are always preserved. Thus, it produces very good ap-
proximations preserving the original visual shape and
the boundaries of the original model.
Note that the NSA algorithm was developed ini-
tially for multiresolution purposes. But a new imple-
mentation of the NSA algorithm alone was created as
a general simplification algorithm of meshes (Silva,
2007) and it is available for test purposes in
http://www.di.ubi.pt/
˜
fsilva/nsa/.
5 EXPERIMENTAL RESULTS
The comparisons are made with QSlim algo-
rithm (Garland and Heckbert, 1997) because it is re-
ferred in the literature as the algorithm that produces
better results quickly. Besides, QSlim is available
from http://www.cs.cmu.edu/
˜
garland, which
enabled running both algorithms in the same machine
for the same models.
Several models are used in the comparisons be-
tween NSA and QSlim, however, due to limited space
the results presented in this paper are based only on
the four models pictured in Figure 1. The tests were
performed with both algorithms on the same machine,
a PC Pentium(R) D at 3.20GHz with 4GB of RAM
running XP operating system.
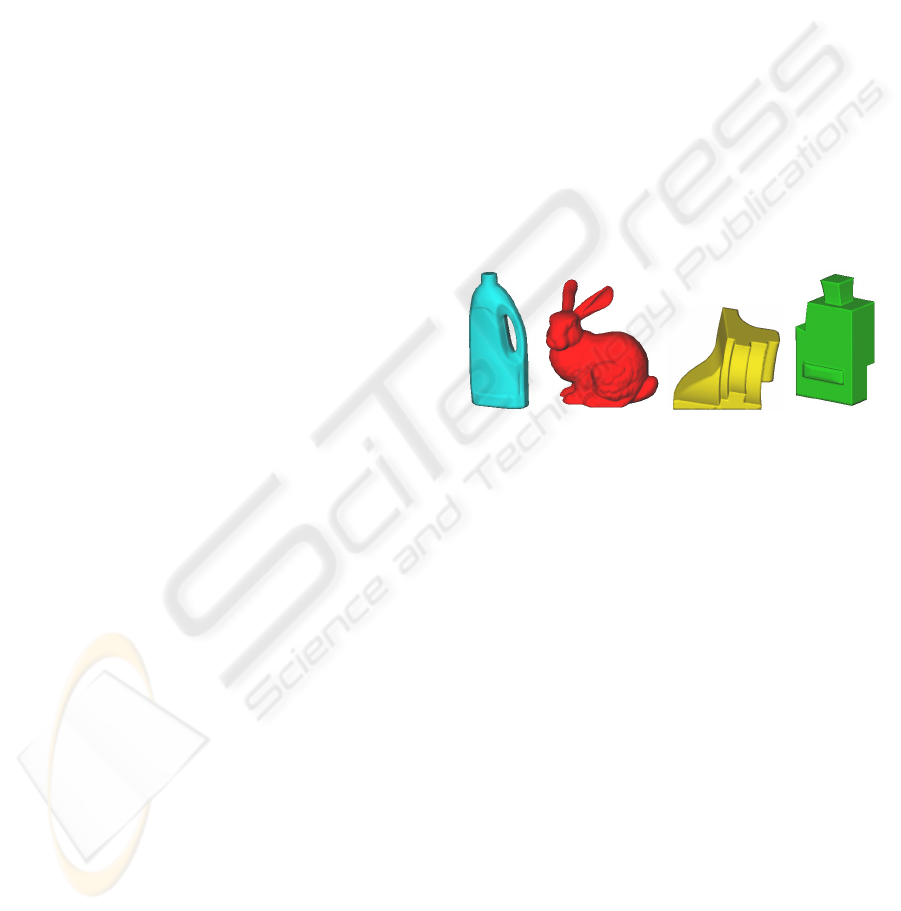
Figure 1: The four models used in this work. The FLASCHE.
model has 85524 faces (left); the BUNNY model has 69473
faces (middle left); the FANDISK model has 12946 faces
(middle right); and the BLOCKFS model has 25542 faces
(right).
5.1 Time Performance
Table 1 shows the time performance for both algo-
rithms, NSA and QSlim. As we can see, the NSA
algorithm is always the fastest algorithm for all tested
models. However, the difference of times is more sig-
nificant for CAD models (i.e., models with planar re-
gions as FANDISK and BLOCKFS). For example, with
the BLOCKFS and FANDISK models the NSA algo-
rithm is on average 8 to 10 times faster than QSlim
algorithm. But, with the BUNNY and FLASCHE mod-
els it is only on average 1.1 to 1.5 times faster than
QSlim algorithm.
The type of the model is important for the per-
formance of simplification algorithms. For example,
the QSlim algorithm spends much more time to sim-
plify CAD models (see Table 1) than for other mod-
els. However, the run times for NSA algorithm show
us that NSA algorithm is more sensible to the number
of cells than to the type of model. Besides, the NSA
GRAPP 2008 - International Conference on Computer Graphics Theory and Applications
76

algorithm produces models with high graphical qual-
ity (i.e., a more regular mesh) compared with QSlim
algorithm, in particularly for CAD models as we will
see in the next Section.
Table 1: Simplification times for NSA and QSlim.
Models # of faces NSA times QSlim times
Fandisk 8000 0.047 sec 0.687 sec
Fandisk 6000 0.062 sec 0.702 sec
Fandisk 4000 0.093 sec 0.717 sec
Fandisk 1200 0.125 sec 0.733 sec
BlockFS 15000 0.094 sec 1.421 sec
BlockFS 12000 0.125 sec 1.609 sec
BlockFS 8000 0.171 sec 1.749 sec
BlockFS 4000 0.203 sec 1.765 sec
BlockFS 2000 0.234 sec 1.796 sec
Bunny 34999 0.438 sec 0.702 sec
Bunny 24999 0.532 sec 0.843 sec
Bunny 14999 0.657 sec 0.952 sec
Bunny 5999 0.750 sec 1.030 sec
Flasche 45000 0.515 sec 0.702 sec
Flasche 35000 0.657 sec 0.796 sec
Flasche 20000 0.829 sec 0.937 sec
Flasche 8500 0.954 sec 1.046 sec
5.2 Model Quality
Model quality can be evaluated using different tools
and by different metrics. However, it is important
evaluating the geometric and graphical quality of the
models. Normally, most of the works present only
the results of geometric quality and ignore the results
of the graphical quality of the models. In this work
the geometrical and graphical quality was compared
using the PolyMeCo tool (Silva et al., 2007a). This
tool enable us a more systematic perception of the re-
sults, for example using a side-by-side viewing with a
equalized color scale.
5.2.1 Quality Metrics
There are several metrics available in PolyMeCo tool
to compare the obtained models, but for this work
we only use the most important of them to compare
the geometrical vs. graphical quality. Thus, we select
six metrics, three that compute the intrinsic proper-
ties and the other three that compute difference mea-
sures. Thus, the metrics used to evaluate the results
are the following: Geometric Deviation (GD), Nor-
mal Deviation (ND), Composed Deviation (COMP2),
Smoothness Analysis (SA3), Mean Curvature Analy-
sis (MCA) and Angle Analysis (AA).
The geometric deviation is the most commonly
used metric in the literature to compare polygonal
meshes. But, as said before, the results obtained do
not necessarily express the perceived quality of the
simplified models.
The normal deviation relates with the shape of the
model and particularly with how the model is viewed
due to the strong relation between surface normals
and light computation.
The composed deviation is a quality metric being
developed based upon perceived quality results ob-
tained using observer studies. Even though it still
needs to be further enhanced it proved to be a very
good estimator of user perceived quality in some spe-
cific conditions (Silva et al., 2007b).
The smoothness analysis measures how smooth is
a surface. It is considered as an important character-
istic of a surface which influences how its quality is
perceived (Karni and Gotsman, 2000).
The mean curvature is an important characteristic
of a surface, related with its shape, smoothness and,
consequently, surface normals.
Finally, the quality of the triangles composing a
mesh has been widely considered in Finite Element
Methods in order to obtain meshes with good numer-
ical characteristics. But, triangle quality (shape) is
also important when rendering the models, because
malformed (thin) triangles tend to result in visual ar-
tifacts which influence perceived quality.
Beyond all these quality metrics, PolyMeCo pro-
vides an additional (and important) feature to qual-
itatively evaluate perceptual quality. Its integrated
environment, where all tested models can be loaded
in a single work session, allows visually analy-
sis/comparison of the models which helps to under-
stand the meaning of the results obtained with the
quality metrics.
5.2.2 Analysis of Results
All the figures presented in this work use the same
color scale with a common color mapping among all
presented models, enabling us to see the real differ-
ences between the results of the algorithms.
Figure 2 shows the results of four metrics (GD,
ND, AA, and COMP) for a 8000-faces simplified
BLOCKFS model for both algorithms, NSA and QS-
lim. The Figures 2 a) to d) created by NSA and the
Figures 2 e) to h) created by QSlim show the met-
rics for the simplified model. In this case only the
geometric deviation is favorable to QSlim algorithm
while normal deviation, angle analysis and composed
analysis are favorable to NSA algorithm. Note that
the simplified BLOCKFS model produced by QSlim
has also geometric problems as show the Figures 3(b)
QUALITY PERCEPTION OF SIMPLIFIED MODELS: NSA VS. QSLIM
77
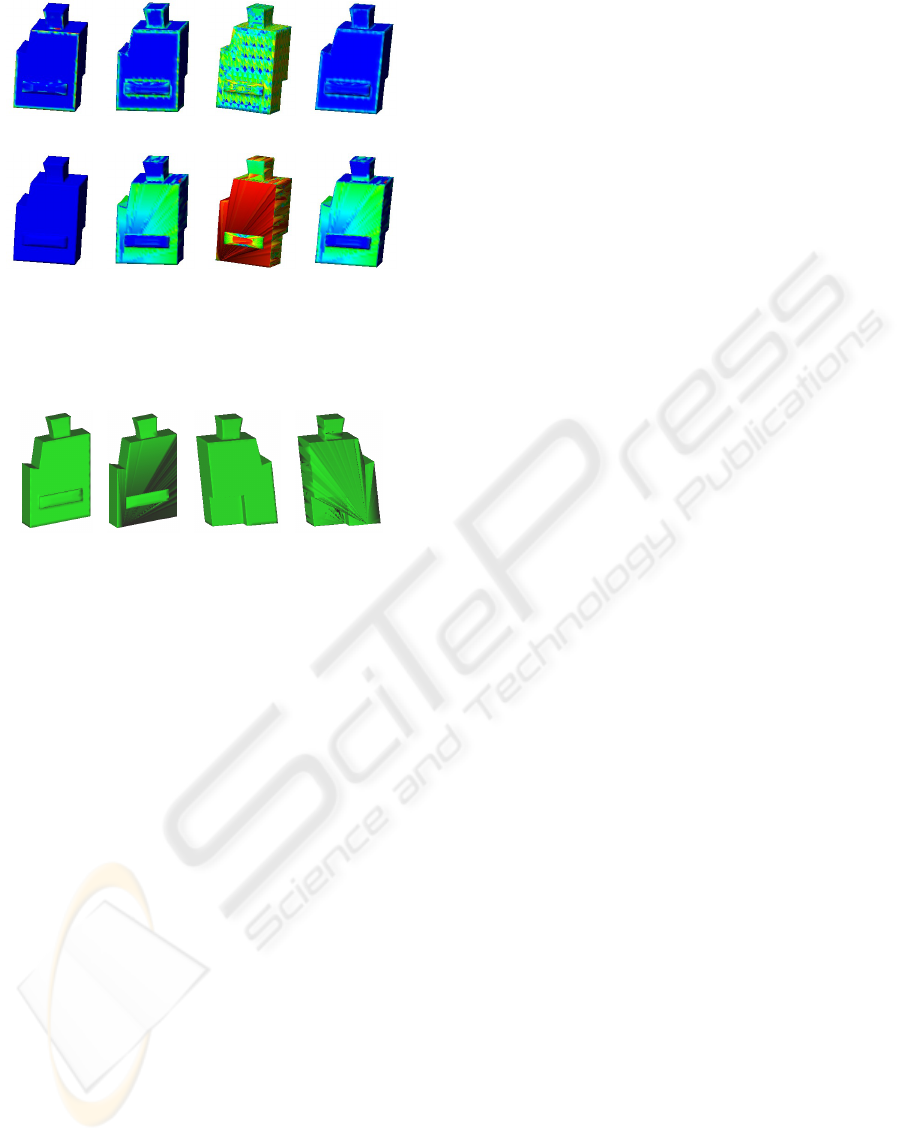
(a) GD (b) ND (c) AA (d) COMP
(e) GD (f) ND (g) AA (h) COMP
Figure 2: The simplified BLOCKFS. model. In the first row
are the results of the NSA algorithm and in the second row
are the results of the QSlim algorithm.
(a) NSA (b) QSlim (c) NSA (d) QSlim
Figure 3: A 15000-faces simplified BLOCKFS. model cre-
ated by NSA and QSlim algorithms.
and (d) but, on the contrary, the simplified BLOCKFS
model produced by NSA algorithm is correct as show
the Figures 3(a) and (c).
Other model tested with both algorithms was the
FLASCHE model which has planar regions. In this
case only the angle analysis is favorable to NSA algo-
rithm, i.e., the graphical quality of the model created
by NSA algorithm is better than the graphical qual-
ity of the model created by QSlim algorithm. Thus,
the model created by NSA algorithm is more ade-
quate for visualization purposes because the mesh is
more regular. On the contrary, the geometrical qual-
ity of the model created by QSlim algorithm is better
than the geometrical quality of the model created by
NSA algorithm, i.e., the model created by QSlim have
smaller geometric errors (see (Silva, 2007)).
For the BUNNY model, all the results are favorable
to QSlim algorithm. This fact is due to the simplifica-
tion criterion of the NSA algorithm which is based on
the planarity of the model surface. Since the BUNNY
model has not planar regions the meshes produced by
NSA algorithm have lower quality (see (Silva, 2007)).
Finally, the last model tested with both algorithms
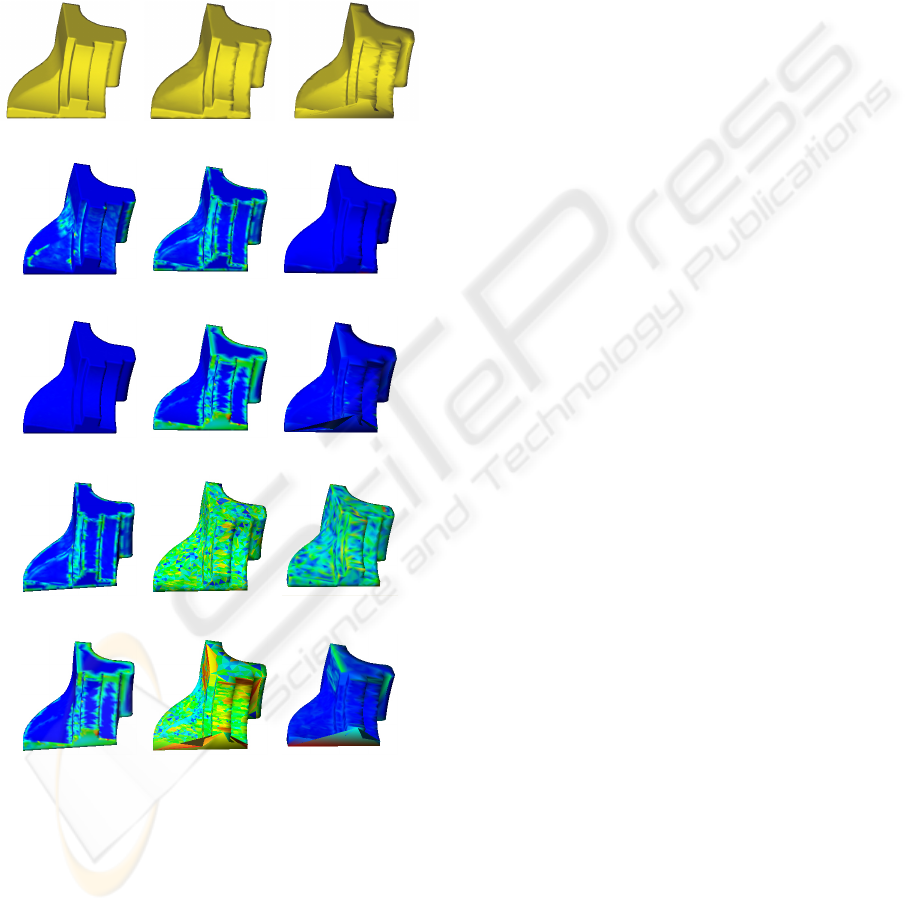
is the FANDISK which have planar regions. Figure 4
shows a simplified 4000-faces FANDISK model. The
results for NSA algorithm are pictured in Figures 4
d), e), f), j), k) and l), and the results for QSlim al-
gorithm are pictured in Figures 4 g), h), i), m), n)
and o). The Figures 4 b) and c) show a 4000-faces
simplified FANDISK model created by NSA and QS-
lim algorithms, respectively. As you can see in this
case only the geometric deviation metric is favorable
to the QSlim algorithm (see Figures 4(d) and (g)). All
the others metrics (ND, COMP, AA, MCA, and SA)
are favorable to the NSA algorithm. We can also ob-
serve that the simplified model created by QSlim (Fig-
ure 4(c)) have geometric problems. On the contrary,
the model created by NSA algorithm have a correct
geometry as shows the Figure 4(b).
Both the models, FANDISK and BLOCKFS, have
planar regions where the QSlim algorithm generates
problems in the geometry as confirmed by the simpli-
fied models and by the angle analysis metric (AA) in
Figure 4 and Figure 2. Thus for models without pla-
nar regions the QSlim algorithm generates good sim-
plified models but always spends more time, as the
case of BUNNY model.
Thus for the models with planar regions we can
say that NSA algorithm produces better simplifica-
tions than QSlim algorithm. For models without pla-
nar regions normally the QSlim algorithm produces
better simplifications than NSA algorithm, but some
times with inferior graphical quality.
6 CONCLUSIONS
The PolyMeCo tool provided the possibility of
analysing several simplified meshes using a large
range of metrics, which allowed a more precise eval-
uation of the simplification algorithms. The available
visualization options allowed a clearer understanding
of the numerical values as well as the problems re-
lated to them. A clear example is the Angle Analysis
metric that detects thin triangles which are not ade-
quate for visualization.
The analysis and comparison of mesh properties
can be performed with the help of 3D models. For
example, a model is colored according to the value
obtained for each vertex/face. This coloring can be
performed by mapping the values range to a particular
color scale and it is important to use common color
maps among the compared models in order to attain a
correct perception of the results.
The NSA algorithm is faster than the QSlim algo-
rithm for all types of models, but in particularly for
CAD models. Besides, for CAD models the QSlim
algorithm generates simplified models with geomet-
ric/topological problems. On the contrary, the NSA
algorithm produces always valid geometric models.
GRAPP 2008 - International Conference on Computer Graphics Theory and Applications
78
The results show that even though Qslim always cre-
ated simplified models with high geometric quality
they sometimes have inferior graphical quality. Thus,
if the original model has a large number of planar re-
gions, and visual quality is the most important crite-
rion, then the QSlim algorithm might not be the algo-
rithm of choice. For these cases the NSA algorithm is
the right choice because it always creates valid mod-
els with a good graphical quality.
(a) Original (b) NSA version (c) QSlim version
(d) GD -nsa (e) ND - nsa (f) MCA - nsa
(g) GD - qslim (h) ND - qslim (i) MCA - qslim
(j) COMP - nsa (k) AA- nsa (l) SA - nsa
(m) COMP - qs-
lim
(n) AA- qslim (o) SA - qslim
Figure 4: The results of several metrics for a 4000-faces
simplified FANDISK. model for algorithms NSA and QS-
lim.
ACKNOWLEDGEMENTS
The second author would like to thank research unit
127/94 IEETA of the University of Aveiro for the
grant that supported his work.
REFERENCES
Aspert, N., Santa-Cruz, D., and Ebrahimi, T. (2002).
MESH: Measuring errors between surfaces using the
Hausdorff distance. In Proc. IEEE International Con-
ference in Multimedia and Expo 2002, volume 1,
pages 705–708, Lausanne, Switzerland.
Cignoni, P., Montani, C., and Scopigno, R. (1998a). A com-
parison of mesh simplification algorithms. Computers
and Graphics, 22(1):37–54.
Cignoni, P., Rocchini, C., and Scopigno, R. (1998b). Metro:
measuring error on simplified surfaces. Computer
Graphics Forum, 17(2):167–174.
Garland, M. and Heckbert, P. S. (1997). Surface simplifica-
tion using quadric error metrics. In Proc. SIGGRAPH
1997, pages 209–216.
Karni, Z. and Gotsman, C. (2000). Spectral compression
of mesh geometry. In Proc. SIGGRAPH 2000, pages
279–286.
Luebke, D. P. (2001). A developer’s survey of polygonal
simplification algorithms. IEEE Computer Graphics
and Applications, 21(3):24–35.
Puppo, E. and Scopigno, R. (1997). Simplification, LOD
and multiresolution — principles and applications.
Eurographics Tutorial Notes.
Roy, M., Foufou, S., and Truchetet, F. (2004). Mesh com-
parison using attribute deviation metric. International
Journal of Image and Graphics, 4(1):1–14.
Silva, F. G. M. (2007). NSA simplification algorithm: geo-
metrical vs. visual quality. In Proc. of Computational
Science and Its Applications - ICCSA 2007, pages
515–523. IEEE Computer Society Press.
Silva, S., Madeira, J., Silva, F., and Santos, B. S. (2007a).
Evaluation of mesh simplification algorithms using
polymeco: A case study. In Proceedings of SPIE Vol.
6495, pages 64950D1–64950D12.
Silva, S., Madeira, J., and Sousa Santos, B. (2005). Poly-
MeCo — a polygonal mesh comparison tool. In Proc.
9th International Conference in Information Visual-
ization (IV05), pages 842–847.
Silva, S., Sousa Santos, B., Ferreira, C., and Madeira, J.
(2007b). Comparison of methods for the simplifica-
tion of mesh models using quality indices and an ob-
server study. In Proc. SPIE Vol. 6492, page 64921L.
Zhou, L. and Pang, A. (2001). Metrics and visualization
tools for surface mesh comparison. In Proc. SPIE
2001 vol 4302, pages 99–110.
QUALITY PERCEPTION OF SIMPLIFIED MODELS: NSA VS. QSLIM
79
