
A Proposal for Automatic Inference of Pressure Ulcers
Grade based on Wound Images and Patient Data
Rinaldo de S. Neves
1
, Simônia F. Silva
2
, Edvar F.Rocha Jr.
2
Levy A. Santana
2
, Renato Guadagnin
3
and Edílson Ferneda
3
1
Hospital de Apoio de Brasília (HAB), SGAN, Lote 14, Asa Norte
70.620-000 Brasília, DF Brazil
2
Universidade Católica de Brasília, Campus I, QS 07, Lote 01, EPCT
71.966-700 Águas Claras, Taguatinga, DF, Brazil
, ,
3
Universidade Católica de Brasília, Campus II, SGAN 916 Norte, 70.790-160 Brasília, DF
Abstract. A Pressure ulcer (PU) occurs in a significant amount of patients that
must remain in bed without movements for long periods. Data from patient
concerning both their individual features and wound origin are collected. PU
images and medical diagnosis about PU grade can be stored. Such sets of
information can be submitted to data mining procedures in order to be detected
some relations between data. Is seems to be also possible computationally to
generate a PU grade inference that will help medical experts to accomplish
therapeutic procedures. Present proposal aims so to support PU diagnosis
process and so to accelerate healing process towards important benefits for a
better patient life quality with lower medical assistance costs.
1 Introduction
1
Many patients must remain a long time in bed without movement. In such cases
pressure ulcers (PU) are very probable to arise. They are tissue necrosis developed
when a soft tissue is compressed between an osseous prominence and a hard surface.
[1].
Prevalence of PU in USA hospitals vary from 3% to 14%, increasing to 15% to
25% in rest homes. [2] In a study carried out in a Brazilian university hospital,
percentages of presented PU cases found were 41.0% in the general intensive care
unit, 39.5% in the surgical ward and 42.6% in the general practice ward. [3] The most
afflicted areas are the skin regions where there is a smaller quantity of muscular tissue
next to osseous prominences, such as sacrum, large trochanter, scapula, lateral
1
The computational tasks of this work are being developed in the Laboratory for Medical Image
Processing in Catholic University of Brasilia, supported by DAAD (German Office for Academic
Interchange).
de S. Neves R., F. Silva S., F. Rocha Jr. E., A. Santana L., Guadagnin R. and Ferneda E. (2008).
A Proposal for Automatic Inference of Pressure Ulcers Grade based on Wound Images and Patient Data.
In Image Mining Theory and Applications, pages 74-82
DOI: 10.5220/0002339300740082
Copyright
c
SciTePress

malleolus, thoracic column, heels, occipital, knees, ischial tuberosities and lateral
epicondyles. [1] [4].
Data from patient concerning both their individual features and the wound origin
are collected at the beginning of medical assistance. During such assistance it is
possible periodically to capture PU images and medical diagnosis about PU grade.
Such sets of information can be submitted to data mining procedures in order to be
detected some relations between data. Is seems to be also possible computationally to
generate a PU grade inference that will help medical experts to accomplish
therapeutic procedures. Present proposal aims so to support PU diagnosis process and
so to accelerate heal towards important benefits for a better life quality for patients
with lower medical assistance costs.
2 Basic Ideas
Medical assistance concerning PU patients are quite image dependent. They deliver
considerable information for decisions about therapeutic procedures. Besides that
information about the patient himself is necessary, because they can explain PU
occurrence and evolution, and how the patient will respond to therapy. Such
information amount and complexity can be too great to be always considered. This
depends strongly on physician experience and available resources to perform new
laboratory analysis.
In such context a computational tool that improves considerable data analysis
seems to be very suitable. Indeed data mining techniques are widely used to process
huge amount of data and to discover new relations between some object attributes.
[5][6].
2.1 PU Evaluation
PU evaluation lies on visual information, say color and geometric features, and
provide a diagnosis about PU grade and its evolution, and patient data. So PU expert
needs periodically to have a PU image and additional data. Based on that he will
decide about what kind of therapeutic procedures should be accomplished in order to
heal the wound.
2.2 Specific PU Features
Roughly one can distinguish three parts in PU image, say, healthy skin, PU-border
and PU-core. Image classification can reduce the image to three classes in
correspondence to such parts and the following features can be considered to check
its consistence
a) PU-core is not a lengthy form;
b) PU-core is usually somewhat red;
c) PU-core is surrounded by PU-border;
7575

d) PU-border is usually somewhat light red;
e) PU-border is surrounded by healthy skin
f) There is no healthy skin inside PU-core;
g) Usually PU do not occur one very close to each other
PU can be classified according to depth, in relation to the extension of the layer of
tissue involved, in grades from I to IV, been that grade I manifests itself as a defined
area of persistent hyperemia, grade II as a partial lesion which comprehends the
epidermis, part of the dermis or both, grade III as loss of total cutaneous thickness
involving subcutaneous tissue lesion or necrosis and grade IV as the destruction of all
the skin’s layers, sub-cutaneous and muscular tissue. [7][8][9].
2.3 Features Relations Mining
PU happens in human organisms with different features. So both structural data from
patient as periodically captured features are determinant. It seems suitable to look for
relations between such data in order to have some explanation about its evolution as
well as to preview how PU will modify when some therapy is adopted.
3 Methods
The following steps will be performed to achieve the expected results.
3.1 Capture of PU Images and other Data from Patients
Images from PU can be captured with digital camera without any disturbance for
patient. This should be done periodically with the more possible similar illumination,
distance and resolution conditions, always including wound and area pattern in visual
field.
Data from patient are collected at the moment they enter the hospital for medical
assistance as well as periodically. The first ones include following subjects.
• Identification
• Neurological evaluation by Frankel scale
• Oxygenizing
• Blood circulation
• Thermal regulation
• Mucosa and cutaneous integrity
• Perception, learning, time and space orientation
• Nutrition and hydrating
• Secretion
• Sleep and rest
• Physical activities, locomotion, personal cares
• Hygiene and body cares
7676
• Physical integrity
• Communication ability
• Leisure and entertainment
• Religiosity and life philosophy
Data that are collected periodically include the following subjects:
• Identification
• Wound classification
• Wound type
• Wound tissue
• Exsudate
• Wound picture
• PU border area
• PU core area
• PU grade
3.2 Preprocessing
Initially data form patients are being written in forms to be later digitized. The system
will perform usual consistency procedures before data are charged in PU patient data
base. This data base will periodically receive images from PU and will be actualized
when any patient data need to be altered, for instance, when patients are allowed to
leave the hospital. Images will be periodically captured by digital camera.
Each image will be separated in the images that correspond to blue, green and red
bands. Because of texture peculiarities it may happen that isolated points distort parts
of the images that belong to healthy skin, PU border or PU core. It was
experimentally verified that it is possible to minimize such distortions by convolving
each image with a 9x9 mean mask with Idrisi Software. [10] See Figs. 1, 2 and 3.
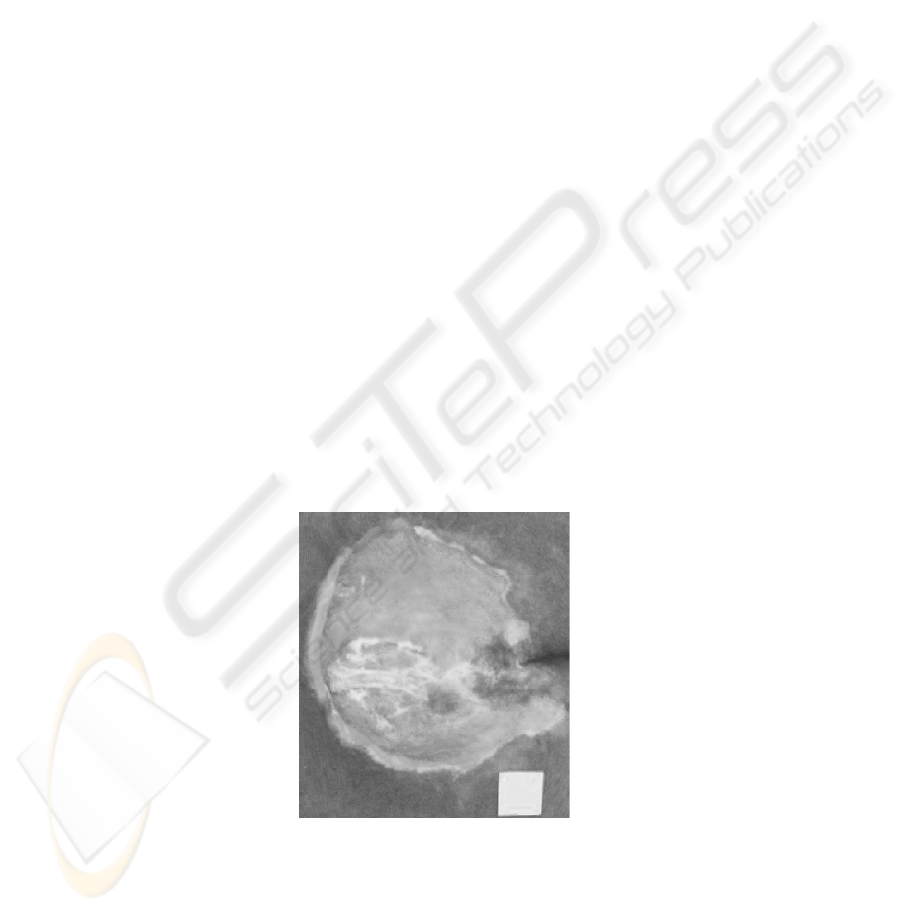
Fig. 1. Original RGB image.
7777

Fig. 2. Isoclust classified image using RGB bands.
Fig. 3. Isoclust classified image after convolution with 9x9 mean mask.
PU area can be adequately estimated in a simple but non pure computational way.
Indeed a recent study on Physiotherapy evaluated interobserver agreement and
intraobserver reproducibility in PU area evaluation. [11] After PU images were
captured they were exposed in a notebook monitor to 25 randomly selected people in
university environment. The images had been imported to Motic Images Plus 2.0 ML
Software for accomplishment of area evaluation through computational contour
marking. The results show that computerized analysis this way presents a high
interobserver agreement and intraobserver reproducibility. See an example of this
method in Fig. 4.
7878
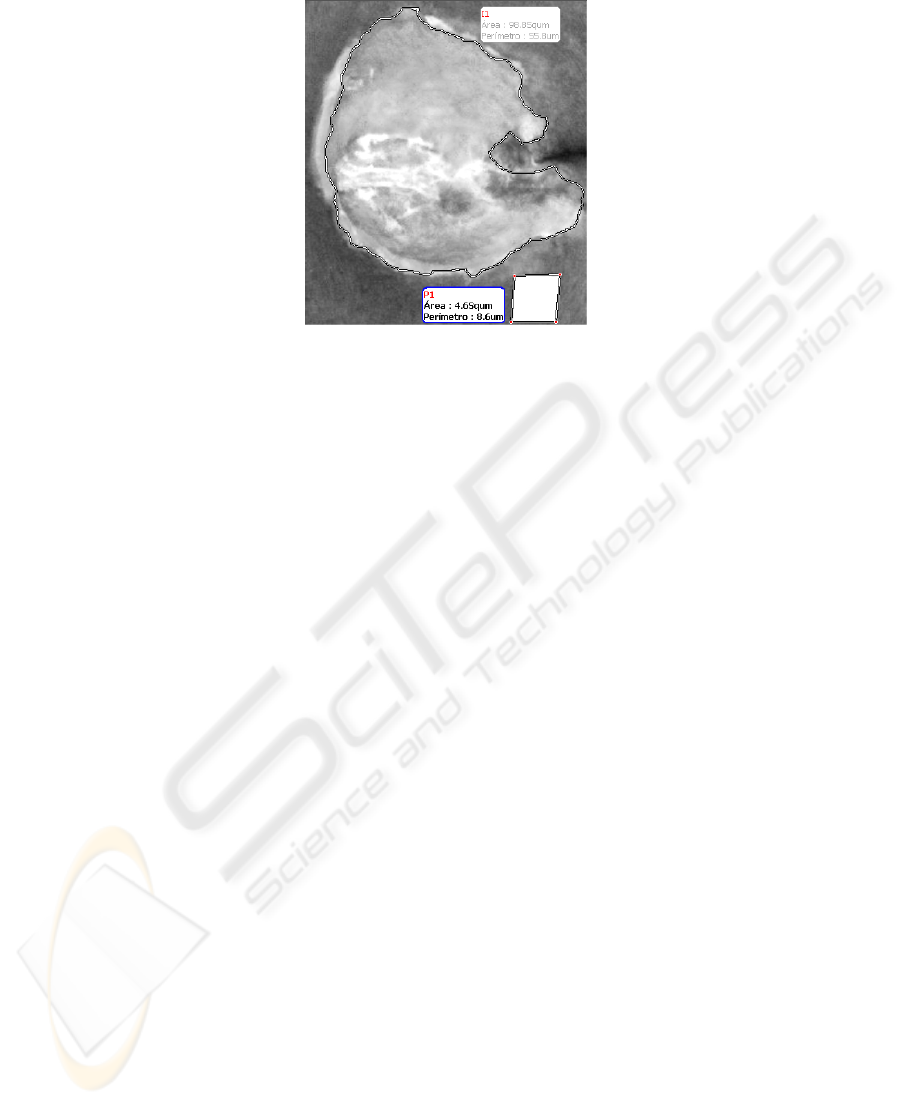
Fig. 4. PU contour marking.
3.3 Intermediate Processing
In order to automate UP area detection, preprocessed images can be classified by
means of Isoclust algorithm in software Idrisi. It has already been possible to check
its suitability for classification of PU images. [12] This classification procedure is
based on Isodata and K-means classification procedures, consisting of an iterative
process of class attribution to all the pixels, ending with a predetermined number of
iterations or when a pre-determined maximum approximation is reached. [10] [13]
This software presents a table with quantity of pixels per class, and each class area
can be derived using an area pattern in the image. See Fig.5, 6 and 7.
3.4 High Level Processing
In Weka software data from a set of patients constitute a file that contains a list of
attributes and instantiations of such attributes for every patient. So a decision tree can
be build using a chosen machine learning algorithm, where PU grade is leaf attribute.
It can happen that some attributes are not included in such decision tree because they
are not relevant to determine the leaf attribute. System reports tree performance to
find leaf attribute. Afterwards the system can identify clusters concerning PU and
patient attributes. If the results are satisfactory the decision tree will be applied to new
PU data and so be used to infer PU grade.
7979
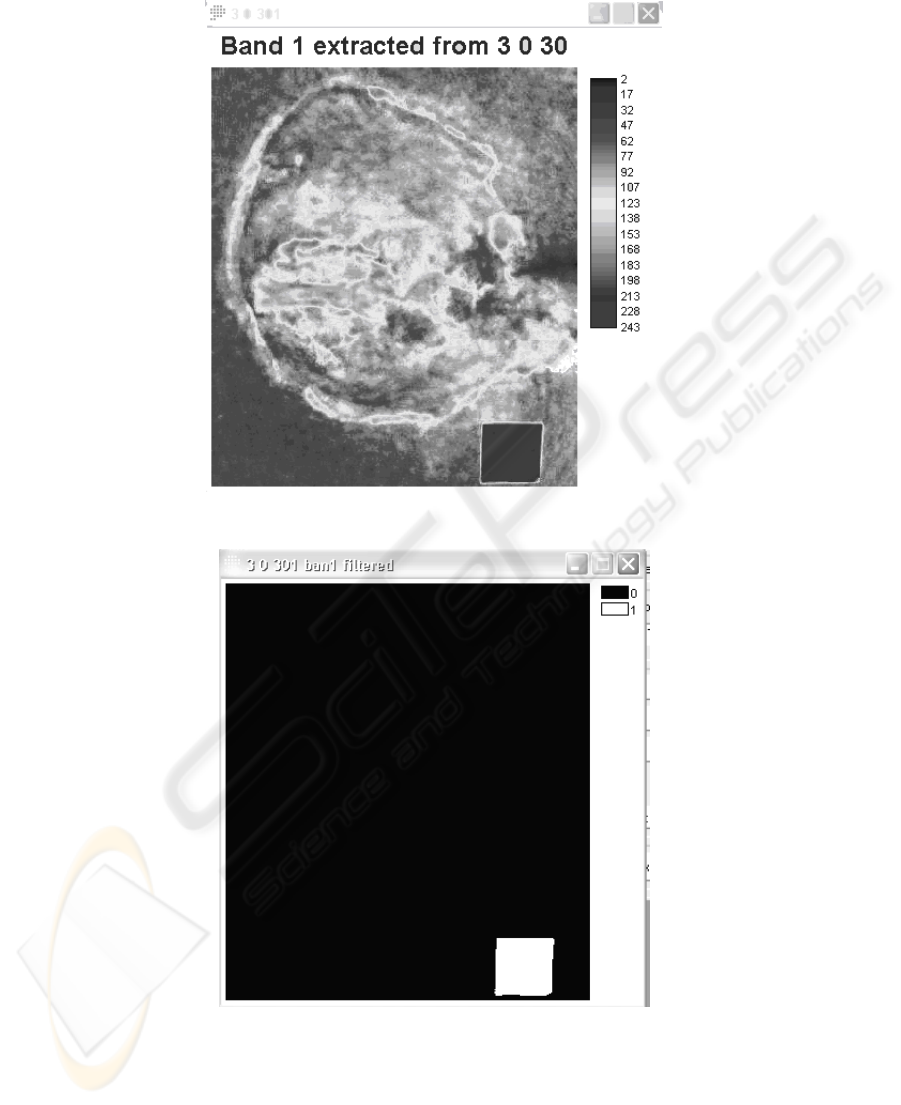
Fig. 5. Band B from original image with intensity scale.
Fig. 6. Enhancement of pixels greater than 198.
8080
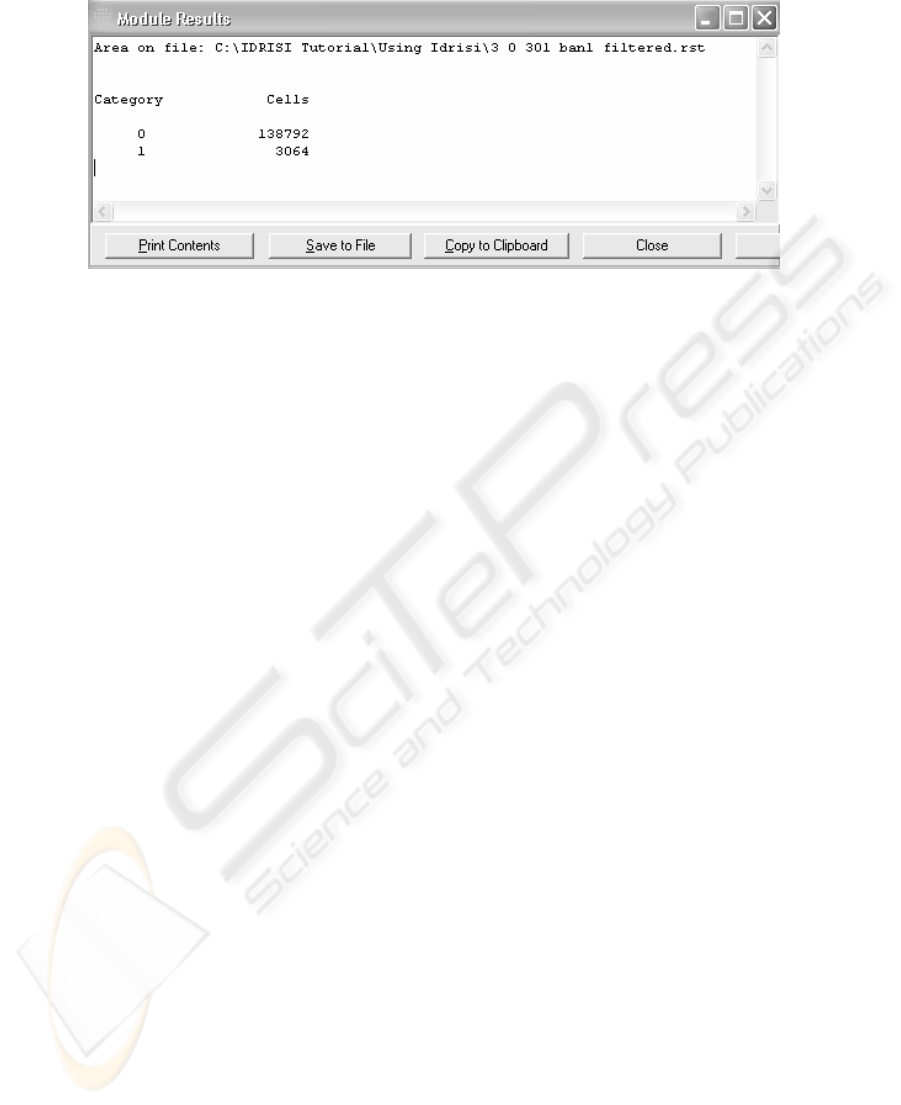
Fig. 7. Amount of cells per class in last image.
Image and patient data will feed a training set in Weka software that has shown to be
adequate after some tests [14].
4 Expected Results
So far a set of patient data is already available and data from other patients are being
collected. It is yet necessary to refine the image processing program and to insert data
in data mining software. The main results of present system proposal are inferences
about PU grade, detection of clusters in U datasets and information providing for
system feed-back after evaluation from PU experts.
5 Final Remarks
Present proposal was submitted to National Council for Scientific and Technological
Development in Brazil (CNPq), restricted to PU patients in Brasília city. Later
research efforts can refer to PU border analysis and encompass more complex PU
types and patient population
References
1. Costa IG. Incidência de úlcera de pressão e fatores de risco relacionados em pacientes de
um centro de terapia intensiva. 2003.125p. Dissertação (Mestrado em Enfermagem
Fundamental) Escola de enfermagem de Ribeirão Preto, Universidade de São Paulo, São
Paulo. Available in http://www.teses.usp.br/teses/disponiveis/22/22132/tde-09032004-
084518/ at 03 mar. 2007.
2. Blanes, L, Duarte IS, Calil JA, Ferreira LM. Avaliação clínica e epidemiológica das úlceras
por pressão em pacientes internados no Hospital São Paulo. Rev Assoc Med Bras
2004;50:182-187
3. Rogenski NMB, Santos VLCG. Estudo sobre a incidência de úlceras por pressão em um
hospital universitário. Rev latino-am Enfermagem 2005;13: 474-480
8181

4. Costa MP, Sturtz G; Costa PPC, Ferreira MC, Filho TEPB. Epidemiologia e Tratamento
das Úlceras de Pressão: experiência de 77 casos. Acta Ortop Brás 2005;13:124-133.
5. Han, J. & Kamber, M.. Data Mining: concepts and techniques: Morgan Kaufmann, 2001.
6. Fayyad et al. (1996). Advances in knowledge discovery and data mining: AAAI Press/MIT
Press, 1996.
7. Hess, CT. Úlceras de Pressão.Tratamento de Feridas e Úlceras. Rio de Janeiro: Reichmann
& Affonso Editores; 2002.79-106.
8. Brasil. Ministério da Saúde. Secretaria de Políticas de Saúde. Departamento de Atenção
Básica. Manual de condutas para úlceras neurotróficas e traumáticas. Brasília: Ministério
da Saúde, 2002. Available in http://portal.saude.gov.br/portal/arquivos/pdf/
manual_feridas_final.pdf at 18 mar. 2007.
9. Medeiros GCF. Uso de Texturas para acompanhamento da evolução do tratamento de
úlceras dermatológicas. 2001. 93p. Dissertação (Mestrado em Engenharia Elétrica) –
Escola de Engenharia de São Carlos, Universidade de São Paulo, São Paulo. Available in
http://www.teses.usp.br/teses/disponiveis/22/22132 /tde-09032004-084518/ at 03 mar.
2007.
10. Clark University. IDRISI Tutorial: 1987-2006.
11. Silva, SF, Fidedignidade inter e intra-examinador do cálculo de área de úlceras por pressão
em fotografias utilizando o software Motic, TCC Fisioterapia, Universidade Católica de
Brasília, 2007.
12. Pereira, IL Souza, LC, Santana LA, Guadagnin, RV. Restoration of pressure ulcer areas
detected by computational classification through image inclination, Proceedings of 8
th
International Conference on Pattern Recognition and Image Analysis, Yoshkar-Ola, Russia,
2007.
13. Ohata AT, Quintanilha JA O uso de algoritmos de clustering na mensuração da expansão
urbana e detecção de alterações na Região Metropolitana de São Paulo, in: Anais do XII
Simpósio Brasileiro de Sensoriamento Remoto, Goiânia, Brasil, 16-21 de Abril de 2005,
INPE, p. 647-655.
14. Witten, IH, Frank, E. Data Mining: Practical Machine Learning Tools and Technologies
with Java Implementation, Chapter 8: Morgan Kaufmann, 2000.
8282
