
BIOSIGNALS WITH A FLOOR SENSOR
Near Field Imaging Floor Sensor Measures Impedance Changes in the Torso
Henry Rimminen and Raimo Sepponen
Department of Electronics, Helsinki University of Technology, Otakaari 7B, Espoo, Finland
Keywords: Remote sensing, Non-contact measurement, Cardiac monitoring.
Abstract: We analyse biosignals recorded with a near field imaging floor sensor, using a test group of five people.
This human tracking system is capable of non-contact biosignal recording. A time domain integration
method is used to extract periodic cardiac waveforms from the raw signals, while an ECG signal is used as a
trigger for windowing. The most favourable posture for cardiac monitoring is when the test subjects are
lying prone on the sensor floor. A clear correlation between the test subjects can be found when waveforms
in the lying prone or supine postures are compared. The respiration monitoring capability is also discussed.
1 INTRODUCTION
In this study, we analyse the recorded biosignals of a
near field imaging floor sensor (Rimminen, 2008),
using a test group of five people. The main purpose
of this floor sensor is to track people walking on top
of it, but the proposed applications of the floor
sensor, such as care for the elderly and seclusion
monitoring, would most probably benefit from a
vital signs monitoring capability.
Recently, some promising results have been
presented regarding the remote sensing of the human
body. Using electric potential probes with input
impedances up to 10
15
Ω, a clear cardiac signal has
been recorded from a distance of 3 millimetres
(Prance et al., 2000) and later from a distance of one
metre (Harland, 2001). Low impedance charge
amplifiers have also proved their strength in off-
body sensing. This technique has produced good
results from a recording distance of up to 10
millimetres (Smith, 2004). These methods measure
biopotentials produced by the human body, and no
electrical stimulus is generated by the measurement
system.
Some promising experiments have also been
made with electret films, which produce a charge
under pressure. These films produce clear cardiac
and respiratory signals when applied to the chest and
to the chair on which the subject is sitting
(Alametsä, 2004). This method measures solely the
fine movements of the body.
Unlike the works discussed above, our method
uses a 90-kHz electrical stimulus to measure
impedance changes in the torso, with no galvanic
contact with the body. This kind of measurment is
often referred as Electric field tomograpy
(Korjenevsky, 2004), and has some applications
using planar electrode arrays (Tuykin, 2007) similar
to us. Instead of a spatial analysis, we sample the
signal from one electrode, and analyse the results in
the time domain. As far as we know, there is no
implementation of a biosignal monitor integrated in
a non-pressure-sensitive floor sensor.
The goal of this study is to analyse cardiac
activity in the biosignals recorded with the near field
imaging floor sensor. We also aim to find out which
the most favourable postures are for this kind of
recording. A secondary goal is to observe respiration
in the recorded signals.
2 MATERIALS AND METHODS
2.1 Measurement System Overview
The positioning system under study measures
impedance changes between conductive elements in
a thick film sensor matrix (Rimminen, 2008). The
rectangular sensor elements have a pitch of
approximately 50 cm x 25 cm. One measurement
unit can cover up to 255 sensor elements and 32 m
2
125
Rimminen H. and Sepponen R. (2009).
BIOSIGNALS WITH A FLOOR SENSOR - Near Field Imaging Floor Sensor Measures Impedance Changes in the Torso.
In Proceedings of the International Conference on Biomedical Electronics and Devices, pages 125-130
DOI: 10.5220/0001120901250130
Copyright
c
SciTePress
f = 90 kHz
MUX
LO
G = 70 dB2 - 100 Hz
LO
ADC
Tuned transformer
Sensor matrix
under floor surface
Biosignal
-
channel
ADC
DC-
channel
2.5 kHz
DAC
G = 40 dB
Bias
removal
PSD
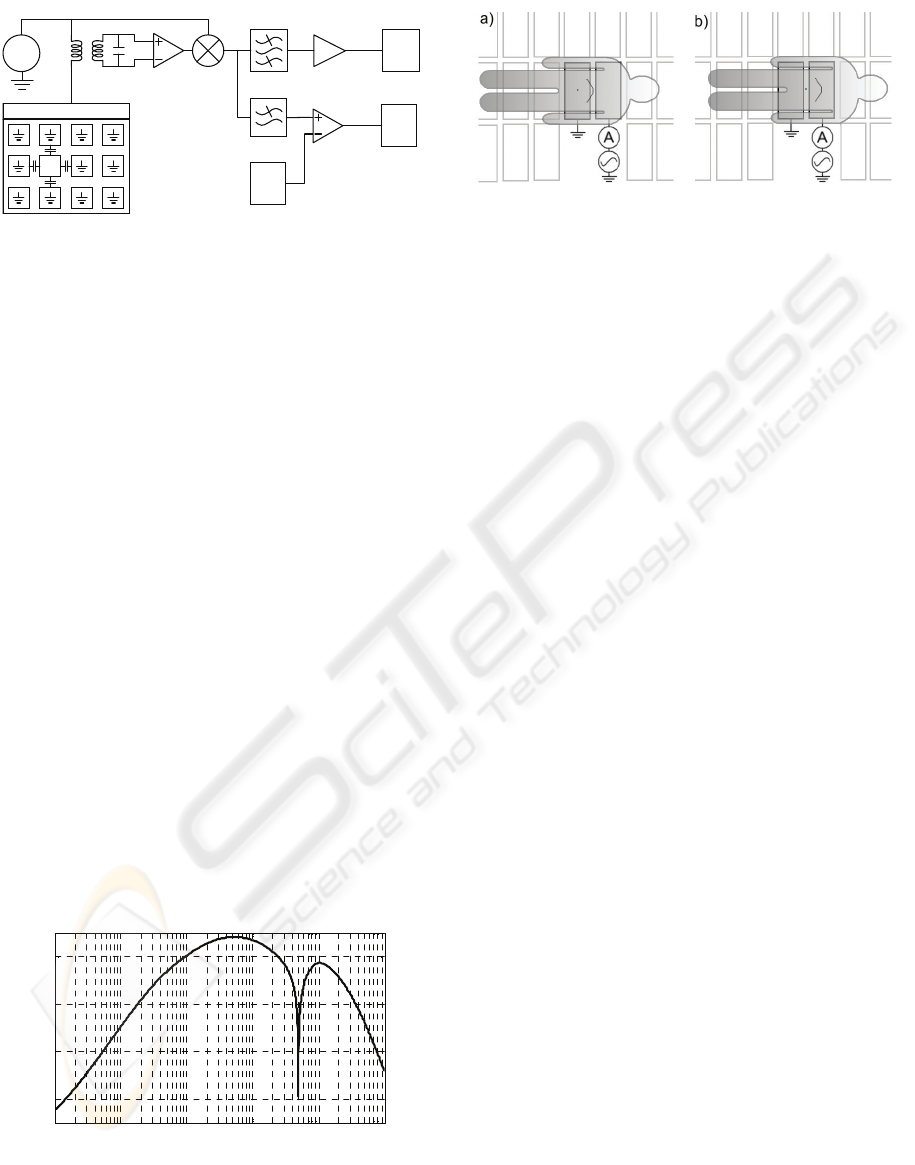
Figure 1: Block diagram of the measurement system. The
local oscillator (LO) signal is fed to one sensor element at
a time using an array of multiplexers.
of floor area. This means that small and medium size
rooms can be covered entirely. These sensor films
are installed under common dielectric floor
coverings with thicknesses of up to 10 mm. The
plastic floor covering in our test room is 3
millimetres thick. This justifies the use of the term
“non-contact measurement”.
The amplitude of the recorded biosignal is
assumed to be proportional to impedance changes in
the body. Because of this assumption, we refer to the
recorded samples as ΔZ signals.
The ΔZ recording is performed by feeding
alternating current to a single sensor element and
grounding the others (see Figure 1). The amplitude
of the current is measured using a tuned transformer
and phase sensitive detector (PSD). These structures
perform well in rejecting common mode EMI. After
this, the signal is fed through a band-pass filter and
amplified by 70 decibels. Then we use a 10-bit a/d
converter integrated in a microcontroller. The band-
pass filter has a 50-Hz twin “T” notch to reject
interference from the mains (National
Semiconductor, 1969) (see Figure 2). The DC
channel in Figure 1 is used for human tracking and
is not discussed in this study.
10
-2
10
-1
10
0
10
1
10
2
10
3
0
20
40
60
Frequency [Hz]
Gain [dB]
Figure 2: The simulated frequency response of the
Biosignal channel.
Figure 3: a) Sternal height recording b) Abdominal height
recording. The grey rectangles represent the floor sensor
elements.
2.2 Test Arrangement
We recorded 20 second samples of five different test
subjects in four different lying postures. The
postures were the following: prone, supine, left
lateral, and right lateral. Two recordings were taken
in each posture: from sternal height and from
abdominal height (see Figure 3). We selected a fixed
sensor element for the recording, which was marked
on the floor covering. The total number of 20-second
samples was 40. The test subjects were breathing
normally during the recordings.
An ECG signal between electrode locations V2
and V4 was recorded simultaneously during every
floor sensor recording. The ECG signal was
acquired using wet electrodes and an
instrumentation amplifier with an adjustable band-
pass filter (PRE AMP Model 5113, Princeton
Applied Research, Tennessee, USA).
The test group consisted of five M.Sc. students;
three males and two females. The average weight
was 74 kilograms, and the average age was 23 years.
The use of elderly people as test subjects was not
feasible because of the difficult postures on a hard
floor surface.
2.3 Pulse Integration
To extract a periodic waveform that is characteristic
for each test subject in each posture and recording
point, we integrate the ΔZ signal in the time domain
by windowing it. The windowing is done by using a
simultaneously recorded ECG signal for timing. The
rising edge of the QRS complex is used to trigger
the start and stop of each window, which are then all
summed together. This helps us to find the periodic
cycles in the sometimes noisy ΔZ signal. From now
on, we refer to them as the standard pulse
waveforms.
The analysis of the standard pulse waveforms is
performed by comparing the signal-to-noise ratios
(SNR) of different test subjects and postures. We are
BIODEVICES 2009 - International Conference on Biomedical Electronics and Devices
126
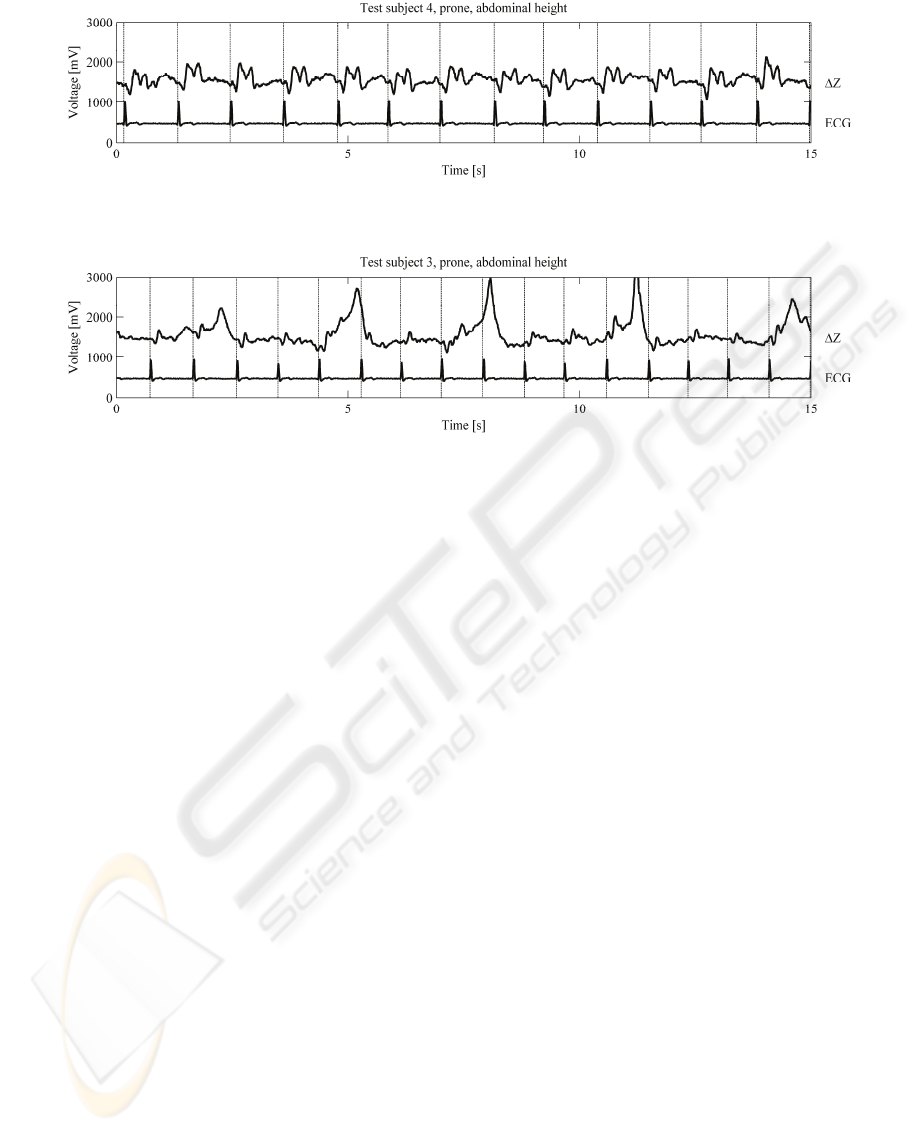
Figure 4: ∆Z signal and ECG signal recorded from test subject number 4 (male). The posture was prone and the recording
was performed at abdominal height. Cardiac activity is clearly visible. SNR is 8.64.
Figure 5: ∆Z signal and ECG signal recorded from test subject number 3 (male). The posture was prone and the recording
was performed at abdominal height. Both cardiac activity and respiration are clearly visible. SNR is 3.77.
interested in finding out if some postures are more
favourable than others, and if some people produce
stronger cardiac signals than others. The SNR is
calculated by taking the true rms voltage of a
standard pulse waveform and dividing it by the rms
voltage of the base noise. The base noise is
measured by recording a 20-second sample while the
floor is empty. Correlation coefficients are also
calculated in order to find out if different people
produce similar signals in the same postures.
3 RESULTS
3.1 Raw Signals
Some of the raw samples are presented in Figures 4,
and 5. The first shows clear cardiac activity, and the
latter shows clear respiratory activity. The
simultaneously recorded ECG signals are plotted
under the ΔZ signals. Dashed vertical lines represent
the windowing separators triggered by the rising
edges of the QRS complexes in the ECG signals.
3.2 Integrated Pulses
When the raw ΔZ signals are integrated in time
using the pace provided by the ECG signal, we get
the standard pulse waveforms presented in Figure 6.
The dark grey traces represent individual test
subjects, and the light grey fill colour represents the
variation within the whole test group. The black
trace shows the average within the group.
It seems that the clearest peaks in the averaged
pulses are present in the prone posture. Also the
supine posture at abdominal measurement height
produces clear peaks.
Table 1 shows the SNR values of the standard
pulse waveforms in every posture and at every
recording point. The higher the SNR, the stronger
the cardiac signal. Respiration and other artefacts in
the signal do not affect the SNR value because of the
ECG-based windowing. The averaged SNR of each
test subject is shown in the last row, and the average
of each posture is shown in the right-hand column.
The rms base noise voltage used in the SNR
calculations was 14.03 mV.
The correlation coefficients of the postures and
recording points are presented in Table 2. These
values are averages of the correlation coefficients
between the test subjects in a certain posture and at a
certain recording point.
If the correlation is high, people produce similar
signals in the same posture and at the same
recording point. High correlation can also be seen as
a narrow grey area in the corresponding part of
Figure 6.
It seems that the correlation between the test
subjects is over 50 percent in the prone posture. It is
also noteworthy that the correlation reaches 33
percent in the supine posture at abdominal
measurement height.
BIOSIGNALS WITH A FLOOR SENSOR - Near Field Imaging Floor Sensor Measures Impedance Changes in the Torso
127

Figure 6: The standard ΔZ pulse waveforms of all test subjects in each posture and at each recording point. The black trace
is an average of the test group. The grey fill colour represents the variation within the test group. Note that the y-scale in the
prone postures is larger (from -400 mV to +400 mV) than in the other postures (from -150 mV to +150 mV).
BIODEVICES 2009 - International Conference on Biomedical Electronics and Devices
128

Table 1: Signal-to-noise ratio in different circumstances.
SNR Test subjects
Position
1
♀
2
♀
3
♂
4
♂
5
♂
Average
Prone,
sternal ht.
1.79 1.34 7.92 4.75 3.80
3.92
Prone,
abd. ht.
1.89
0.85 3.77 8.64 3.20
3.67
Supine,
sternal ht.
3.77 1.18 0.96 2.52 1.27
1.94
Supine
abd. ht.
1.68 1.27 2.71 4.11 2.22
2.40
Left lateral,
sternal ht.
2.03 0.58 0.61 2.87 1.93
1.60
Left lateral,
abd. ht.
2.30 1.39 1.71 2.66 2.60
2.13
Right lat.,
sternal ht.
1.38 0.95 2.17 2.92 2.30
1.95
Right lat.,
abd. ht.
1.35 1.24 1.27 2.01 2.46
1.76
Average
2.03 1.10 2.70 3.81 2.47 2.42
Table 2: Correlation between the test subjects.
Posture and recording point Mean correlation
Prone, sternal ht. 0.555
Prone, abdominal ht. 0.500
Supine, sternal ht. 0.043
Supine, abdominal ht. 0.325
Left lateral, sternal ht. 0.093
Left lateral, abdominal ht. 0.265
Right lateral, sternal ht. 0.193
Right lateral, abdominal ht. -0.033
Average 0.243
4 DISCUSSION
The floor sensor produces a cyclic cardiac signal,
which has the same period as a simultaneous ECG
recording. The cardiac signal presumably originates
from changes in the blood concentration in the torso.
The relatively good conductance of blood reduces
the average tissue impedance seen with the sensor
elements. The cardiac waveform recorded with the
floor sensor resembles remotely the ΔZ signal in
impedance cardiography (Patterson, 1989).
However, this similarity is present only in the prone
postures.
The results show that the cardiac signal is clear
when test subjects are lying prone on the sensor
elements. The sternal height recording point seems
to be slightly better than the abdominal height
recording point. The SNR values when they are
lying prone are significantly higher than in other
postures (see grey cells in Table 1). Postures other
than lying prone produce weaker signal amplitudes;
however, they are still mostly above the base noise
(SNR > 1). The two females in this test group had
lower SNR values than the males.
The standard pulse waveforms show a clear
correlation between all the test subjects in both of
the prone recording points. This suggests that this
recording method could be reproducible and that
people produce similar waveforms in the prone
posture. Also the supine posture at abdominal
measurement height produces clear correlation (see
grey cells in Table 2).
In addition to the correlation values, the
recording points and postures have other similarities
to each other. Almost every part in Figure 6 has a
notch or a peak at 100 milliseconds and a second
notch/peak at 200 milliseconds. When observing the
notch/peak at 200 milliseconds, we notice that it
points upwards when the person is lying prone and
downwards when they are lying supine. The
behaviour of the 100-millisecond notch/peak is
similar but inverted.
Respiration is most often visible when the
recording is performed at abdominal height, while
the person is lying prone or supine. This suggests
that the respiratory signal originates from the
movements of the diaphragm. Observing Figure 5,
the respiratory activity seems to be similar to the
respiratory activity in bioimpedance signals recorded
with galvanic electrodes (Vuorela, 2008).
The near field imaging floor sensor under study
can not match the cardiac monitoring distance of the
ultra-high input impedance probes (Harland, 2001).
The body of the person must be in direct contact
with the insulating 3 mm floor covering. The bulk
impedance between the sensor elements of the floor
sensor system is approximately 650 Ω at 90 kHz.
The human body is coupled parallel to these
elements and is dominant compared to the bulk
impedance only at very close ranges. This explains
the low cardiac monitoring distance, which most
probably causes the severe limitations in the
postures. However, as far as we know, there is no
implementation of probes with high input impedance
incorporated in a system capable of tracking people.
The fact that we can track a person and measure
vital signs of a fallen person on an arbitrary point in
the monitored space, makes this a novel method.
5 CONCLUSIONS
The floor sensor system under study was designed to
track people, but also shows promise in vital sign
BIOSIGNALS WITH A FLOOR SENSOR - Near Field Imaging Floor Sensor Measures Impedance Changes in the Torso
129

monitoring. Cardiac activity is clearly visible when a
person is lying prone on the floor.
Waveform correlation between all the test
subjects is clear when the recording posture is prone
(at both measurement heights) or supine (at
abdominal height). Respiration is most often visible
when recording is performed at abdominal height
while the person is lying prone or supine.
Combined with automatic fall detection, the vital
sign monitoring capability would be most useful in
many applications. These could include the care of
the elderly and seclusion monitoring. The limitations
in the favourable recording postures prevent the use
of this vital sign monitoring method in crucial
applications.
Our future work includes development of
algorithms for automatic detection of the best vital
sign recording point using the results obtained from
this study. We also aim to publish our existing
method for automatic fall detection.
ACKNOWLEDGEMENTS
This study was supported by the European Union and the
Jenny and Antti Wihuri Foundation. The authors are also
grateful to UPM Corporate Venturing for providing the
necessary multi-layer thick film sensor laminates.
REFERENCES
Rimminen, H., Linnavuo, M., and Sepponen, R., 2008.
Human Tracking Using Near Field Imaging. In
Proceedings of the Second International Conference
on Pervasive Health, pp. 148-151. ICST.
Prance, R. J., Debray, A., Clark, T. D., Prance, H., Nock,
M., Harland, C. J., and Clippingdale, A. J., 2000. An
ultra-low-noise electrical-potential probe for human-
body scanning. In Measurement Science and
Technology, Volume 11, Issue 3, pp. 291-297. Institute
of Physics Publishing.
Harland, C. J., Clark, T. D., and Prance, R. J., 2001.
Electric potential probes —New Directions in The
Remote Sensing of The Human Body. In
Measurement Science and Technology, Volume 13,
Issue 2, pp. 163-169. Institute of Physics Publishing.
Smith, W. J., and LaCourse, J. R., 2004. Non-Contact
Biopotential Recording from the Human Body Using a
Low-Impedance Charge Amplifier. In Proceedings of
the 30th Annual International Conference on
Bioengineering, pp. 31-32. IEEE.
Alametsä, J., Värri, A., Koivuluoma, M., and Barna, L.,
2004. The Potential of EMFi Sensors in Heart Activity
Monitoring. In 2nd OpenECG Workshop "Integration
of the ECG into the EHR & Interoperability of ECG
Device Systems”, pp. 1.-3.
Korjenevsky, A.V., 2004. Electric field tomography for
contactless imaging of resistivity in biomedical
applications. In Physiological Measurement, Volume
25, Issue 1. pp. 391-401. Institute of Physics
Publishing.
Tuykin, T.S., and Korjenevsky, A.V., 2007. Electric field
tomography system with planar electrode array. In
Proceedings of the 13th International Conference on
Electrical Bioimpedance and the 8th Conference on
Electrical Impedance Tomography, pp. 201-204.
Springer Berlin Heidelberg.
National Semiconductor Corporation, 1969. High Q Notch
Filter. In Linear Brief series, No. 5. National
Semiconductor.
Patterson, R.P., 1989. Fundamentals of impedance
cardiography. In Engineering in Medicine and Biology
Magazine, Volume 8, Issue 1, pp. 35-38. IEEE.
Vuorela, T., Vanhala, J., Seppä, V.-P., Hyttinen, J., 2008.
Two portable long-term measurement devices for ECG
and bioimpedance. In Proceedings of the Second
International Conference on Pervasive Health, pp.
169-172. ICST.
BIODEVICES 2009 - International Conference on Biomedical Electronics and Devices
130
