
APPLICABILITY OF ISO/IEC 9126 FOR THE
SELECTION OF FLOSS TOOLS
María Pérez, Kenyer Domínguez, Edumilis Méndez and Luis E. Mendoza
Processes and Systems Department, LISI, Simón Bolívar University
PO Box 89000, Caracas 1080-A, Venezuela
Keywords: Quality Models, ISO/IEC 9126, Free Software, Analysis and Design, Business Modeling, Software Testing.
Abstract: The trend towards the use of Free/Libre Open Source Software (FLOSS) tools is impacting not only how we
work and how productivity can be improved when it comes to developing software, but is also promoting
new work schemes and business models, specifically small and medium-size enterprises. The purpose of
this paper is to present the applicability of ISO/IEC 9126 for the selection of FLOSS Tools associated with
three relevant software development disciplines, such as Analysis and Design, Business Models and
Software Testing. The categories considered for the evaluation of these three types of tools are
Functionality, Maintainability and Usability. From the results obtained from this research-in-progress, we
have been able to determine that these three categories are the most relevant and suitable to evaluate FLOSS
tools, thus pushing to the background all aspects associated with Portability, Efficiency and Reliability. Our
long-term purpose is to refine quality models for other types of FLOSS tools.
1 INTRODUCTION
There is a wide variety of tools in the market that
support the different disciplines addressed in
software product development. Software developing
organizations must adjust to the market demands and
use tools that allow them to be efficient. The
selection of an adequate tool for the development
process that meets to the organization
needs is a complex process, since it requires a fair
amount of objectivity to make the best decision.
This impartiality is promoted through the use of
a product quality model that specifies the proper
quality features for a specific type of tool.
According to the current rise and projection of
the Free/Libre Open Source Software (FLOSS)
industry, FLOSS Tools have not only become
popular, but have helped software developing
organization meeting time, quality and cost
restrictions in their developments.
Therefore, the quality model should consider this
to benefit from the advantages incorporated by the
FLOSS philosophy.
The purpose of this paper is to present the results
obtained from the application of ISO/IEC 9126
(2001) through the instantiation of the Systemic
Quality Model (MOSCA) from the product
perspective (based on ISO/IEC 9126) and suggest 3
models for quality specification of Analysis and
Design (A&D), Business Modeling (BM) and
Software Testing (ST) tools.
Thus, the Systemic Methodological Framework
(SMF) for Information Systems Research of the
Information Systems Research Laboratory (LISI by
Spanish acronym of Laboratorio de Investigación en
Sistemas de Información) (Pérez et al., 2004) was
used, which is based on the Research-Action method
(Baskerville, 1999) and the DESMET methodology
(Kitchenham, 1996). SMF provides for infinite
iterations, if necessary, to obtain the research
product sought, but for the purposes of this research,
3 iterations were considered (1 for each type of
tools). In addition, the Goal Question Metric (GQM)
approach (Basili, 1992) was used in the
operationalization of each model proposed. In order
to test the models and perform a preliminary
evaluation thereof, the DESMET Feature Analysis
Methods was used (Kitchenham, 1996).
The main contribution of this work is to provide
to software developing organizations, especially
Small and Medium-size Enterprises (SMEs), a
model for assessing these three types of tools in
accordance with three categories, namely
Functionality, Maintainability and Usability. This
367
Pérez M., Domínguez K., Méndez E. and E. Mendoza L. (2009).
APPLICABILITY OF ISO/IEC 9126 FOR THE SELECTION OF FLOSS TOOLS.
In Proceedings of the 11th International Conference on Enterprise Information Systems - Information Systems Analysis and Specification, pages
367-371
DOI: 10.5220/0002000303670371
Copyright
c
SciTePress

would help their decision making processes and their
selection of the tools that best suit their needs, and
would offer guidance to facilitate their enhancement
and use.
The present paper has been structured as follows:
first, a brief description of the MOSCA model and
ISO/IEC 9126 is supplied; then, experiences with
D&A tools, followed by the experiences with BM
tools and ST tools, are discussed; and, lastly,
conclusions and recommendation are provided.
2 MOSCA PRODUCT - ISO/IEC
9126
The model proposed for Quality Specification in
A&D, BM and ST tools is based on the Systemic
Quality Model (MOSCA by the Spanish acronym of
MOdelo Sistémico de CAlidad) (Mendoza et al.,
2005). This model encompasses three perspectives:
Product, Process and Human.
For purposes of this research, we focused on the
Product perspective, which is based on ISO/IEC
9126 (ISO/IEC 9126, 2001). To make it more
appropriate, we used the adaptation guide described
in (Rincón et al., 2004) and the algorithm to evaluate
software quality through MOSCA proposed by
(Mendoza et al., 2005).
From the six categories established by MOSCA,
namely Functionality, Efficiency, Maintainability,
Reliability, Portability and Usability, 3 categories
must be selected to estimate quality. Functionality is
a mandatory category and its features must meet a
level of satisfaction greater than 75% to be deemed
“accepted” and continue with the assessment of the
remaining categories (Mendoza et al., 2005). The
other 2 categories considered relevant to evaluate
A&D; BM and ST tools and adapt the MOSCA
model were Maintainability and Usability; the same
acceptance criterion is applied to consider its
presence. It should be noted that the selection of the
Maintainability and Usability categories was ratified
in conformity with other research works conducted
on FLOSS tool (Alfonzo et al., 2008, Pessagno et
al., 2008). Following is a definition of each category
and the features corresponding thereto which make it
possible to adapt MOSCA to each type of tool.
Functionality is the ability of a software product
to provide functions that meet specific or implicit
needs when software is used under specific
conditions.
Maintainability, according to (ISO/IEC 9126,
2001; Mendoza et al., 2005) it is the ability of a
software product to be modified. Modifications may
include software corrections, improvements or
adaptations to changes in the environment,
requirements and functional specifications. The tool
should meet this category since this will enable any
improvements, if necessary.
Usability is the ability of a software product to
be understandable, learnable, usable and appealing
to the user, under certain specific conditions
(ISO/IEC 9126, 2001; Mendoza et al., 2005).
The features selected for Functionality (ISO/IEC
9126, 2001; Mendoza et al., 2005) include:
Suitability, Accuracy, Interoperability, Correctness
and Encapsulation.
The following Maintainability features were
considered: Analyzability, Changeability, Stability,
Coupling, Cohesion and Software Maturity
Attributes.
As to Usability, the following features were
selected: Understandability, Graphical Interface,
Operability, Effectiveness, and Self-description.
Once the categories and respective features are
selected, the metrics for measuring their level of
software presence are formulated, thus achieving
MOSCA adaptation for A&D, BM and ST tools.
3 A&D EXPERIENCE
3.1 Definition and New Metrics
The related literature has established a separation
between System Analysis and Software Design
which still prevails. System Analysis is a problem-
resolution technique that breaks down a system into
compounds to analyze how parties should work
together and interact as a whole, so that the system
meets its objective (Whitten and Bentley, 2006).
Where conceived as a process, software design is the
main activity in the software engineering lifecycle,
where requirements are analyzed to generate a
description of the internal software structure that
will be used a basis for its construction (IEEE-
SWEBOK, 2004). However, the term A&D can be
conceived as a discipline (Kruchten, 2003) that has
transformed into a critical set of activities for early
system development stages, since it is aimed at the
systematic analysis of all data input-output,
processing, transformation, and storage, and the
system output to be built, modified or enhanced
(Kendall and Kendall, 2005).
The model proposed to evaluate FLOSS-based A&D
tools contains 102 metric, 52 of which are new and
distributed as follows: 41 correspond to
ICEIS 2009 - International Conference on Enterprise Information Systems
368
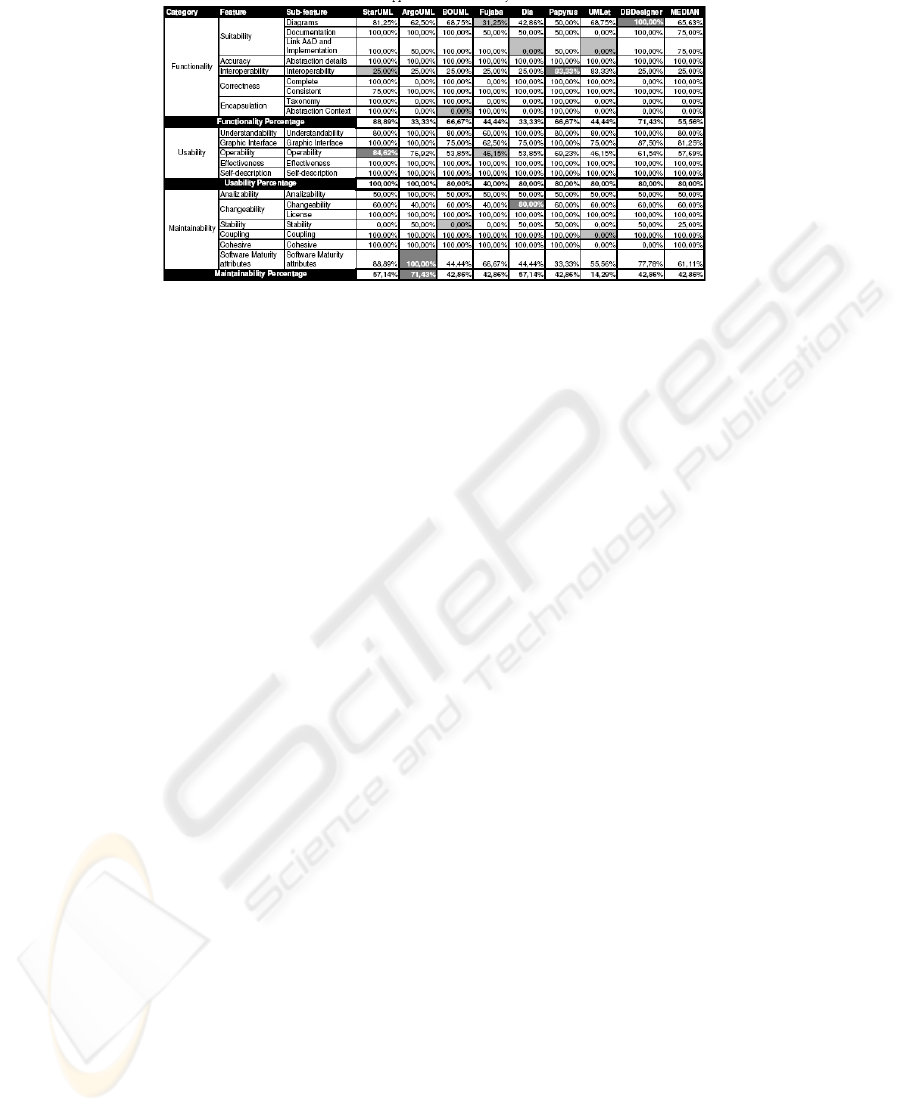
Table 1: Evaluation of 8 A&D FLOSS tools.
Functionality, 9 correspond to Maintainability and 2
correspond to Usability.
3.2 Evaluation
To be considered as an A&D tool, a tool should not
only allow plotting, but it should provide
functionalities that help integrating the analysis
process to the diagrams; therefore, tools such as
Microsoft Paint, Power Point and even UML
plotters, which generate graphics from plain plots as
Graphviz and UMLGraph, do not offer the necessary
functionalities to link such diagrams and manage
their relations, thus restricting analysis activities.
The tools subjected to study are StarUML,
ArgoUML, BOUML, Fujaba, UMLet, Papyrus, DIA
and DBDesigner. All tools allow draw UML
diagrams with the exception of DBDesigner. This
tool is oriented to A&D for Data Bases. Even though
all A&D tools evaluated are based on FLOSS
principles, they show a low Maintainability level,
which is common for this area, since in most cases,
access is granted to the source code, without
complete documentation of the product. Upon
adoption of the MOSCA algorithm, and having
obtained a satisfaction percentage over 75%,
StarUML is the only tool that reached an
Intermediate quality level for two of the three
selected categories, including Functionality.
Table 1 shows the result of the application of
metrics to the FLOSS tools evaluated.
4 BM EXPERIENCE
4.1 Definition and New Metrics
Business Modeling is a Business Process Modeling
activity (Osterwalder et al., 2005), since it deals with
the representation of such processes, whereas the
Business Modeling concept is generally understood
as a vision of the organization’s logics to create and
commercialize value. Eriksson and Penker (2000)
conceive Business Modeling as an instrument to
represent Business Models, since they state that the
main objective of BM is to generate an abstraction
from a complex reality that captures the core
business functions to create common understanding
to be communicated to the stakeholders: owners,
managers, employees, clients, etc. Also, Kruchten
(2003) states that Business Modeling is a discipline
aimed at defining processes, roles, and
responsibilities to develop a vision that allows
understanding clients, final users, and developers, as
well as the structure and dynamics of target
organization.
The instantiation of MOSCA for Business
Modeling FLOSS tools consist of 128 metrics, 75 of
which are new metrics (42 in Functionality, 9 in
Usability, and 24 in Maintainability).
4.2 Evaluation
The instantiation of MOSCA was applied to 4 tools,
namely Eclipse Process Framework Composer
(EPFC), StarUML, Intalio Designer and Dia. All
tools allow modeling Business Processes through the
use of languages, such as BPMN (BPMI, 2006),
UML business profile (Johnston, 2004), SPEM and
EPM (Stemberger et al., 2004). Besides being a tool
used to represent diagrams, EPFC also manages
processes. However, the interest in our research is
much more focused on the analysis of a subgroup of
the Functional part, specifically the business process
visual modeling.
As can be seen in Table 2, from the four FLOSS
tools assigned to BM, 3 reached over 75% of
Functionality, since very few promoted
interoperability. On the other hand, only 2 tools
APPLICABILITY OF ISO/IEC 9126 FOR THE SELECTION OF FLOSS TOOLS
369

Table 2: Evaluation of 4 BM FLOSS Tools.
Nu llBasicMediumAdvanced
Quality Level
6834.2270.2 288.89Maintainability Percentage
36206884Adoption
7037.562.582.5Software maturity attributesSoftware maturity attributes
8020100100CohesionCohes ion
6020100100Co uplin g Coupling
6010020100Services
20202073.33StabilityStability
2020 %60100Documentation
8033.3353.3 3100Modification
10077.14100100License
72286810 0Changeability Changeability
10020100100Code Legibility
100308010 0AnalyzabilityAnalyzabilityMaintainability
7574.3885.6 386.25Usability Percentage
10090100100Self-descriptionSelf-description
84649680Documentation
100100100100Error control
64527286OperabilityOperability
65.7194.2994.2 9100Graphic InterfaceGraphic Interface
20808080LearnabilityLearnability
100100100100Ergonomics
92848064UnderstandabilityUnderstandabilityUsability
64.6777.1478.6 977.78Functionality Percentage
--46 .6710 0TaxonomyEncapsulation
46.6710066 .6 760Consistent
93.3310093 .8 476.36CompleteCorrectness
20202046.67InteroperabilityInteroperability
50607010 0Abstraction DetailsAccuracy
55607550Languages
6060100100Documentation
55.5610082 .3 5100DiagramsSuitabilityFunctionality
DIA
(%)
Intalio
(%)
StarUML
(%)
EPFC
(% )
Sub-featureFeatureCategory
reached over 75% for Usability, where the lowest
levels corresponded to documentation. With regards
to Maintainability, only one of the tools evaluated
shows an acceptable value in this category, where
Stability and software maturity attributes accounted
for the lowest levels. Lastly, the one tool that
satisfied all three categories selected for the
instantiation with a percentage greater than 75% was
EPFC.
5 ST EXPERIENCE
5.1 Definition and New Metrics
ST is a process aimed at providing software
reliability (IEEE-SWEBOK, 2004; Uttimg and
Legteard, 2007) both, from the system developer and
client perspectives, since software must satisfy all
functional and non-functional requirements for its
operation or production passing. That is to say, the
Reliability of ST tools has direct impact on the
software product reliability. Accordingly, the
minimum quality expected by the client, according
to the acceptance criteria agreed upon, must be
assured. One part of the ST strategy is the use of
tools, which allows validating all expected quality
features; hence, the relevance of determining which
testing tool is the most suitable.
In summary, 15 features have been suggested for
quality specification of ST tools (4 in Functionality,
6 in Maintainability and 5 in Usability) and 83
metrics, thus accounting for 50 of the original model
(Mendoza et al., 2005), 11 taken from (Alfonzo et
al., 2008) and 22 new metrics for Functionality,
which formulated during this research work.
Table 3: Evaluation of 3 ST FLOSS Tools.
53%52%49%Total percentage
67%64%56%Satisfaction percentage
100%100%100%Self-descriptionSelf-description
100%100%100%Ef fectivenessEff ective ness
36%36%36%OperabilityOperability
38%25%25%Graphic InterfaceGraphic Interface
60%60%20%UnderstandabilityUnderstandability
Usability
74%74%74%Satisfaction percentage
33%33%33%Software maturity attributes Software maturity attributes
100%100%100%CohesionCohesion
100%100%100%CouplingCoupling
75%75%75%StabilitySta bil ity
100%100%100%License
60%60%60%Changeability
Changeability
50%50%50%Analyzability A nalyz abil ity
Maintainability
18%18%18%Satisfaction percentage
0%0%0%Taxono myEncapsu lation
100%100%100%Consistent
0%0%0%Complete
Correctness
0%0%0%Te st detailsAccuracy
0%0%0%Software details
10%10%10%Tests types and levels
Su itab ility
Functionality
PHP
Unit
CPP
Unit Tools
JUnitSub-featureFeatureCategory
5.2 Evaluation
Three FLOSS tools (JUnit, CPPUnit and PHPUnit)
were analyzed and evaluated. Following the
parameters of the Features Analysis Method
(Kitchenham, 1996), the features analyzed for each
tool correspond to those categories, features, and
sub-features, for which values were obtained from
the measurement of metrics formulated as a result of
MOSCA adaptation. The results of such
measurement are presented in Table 3.
After having applied the proposed model, we
may state that the ST FLOSS tools lack acceptable
Usability; sub-features susceptible of being
improved include Understandability, Graphic
Interface and Operability. Same sub-features should
be improved only for one of the proprietary tools.
Regarding Maintainability, all FLOSS tools must
improve, to a large extent, all sub-features
corresponding to Analyzability, Changeability, and
Software Maturity Attributes. As for proprietary
tools, except for the License sub-features, minor
improvements should be made to the same
Maintainability sub-features. Regarding Functional-
ity, except for the Consistency sub-feature, all tools
must undertake significant improvements for the rest
of the sub-features (only Checking and QACenter
obtained 100% in taxonomy).
6 CONCLUSIONS
This paper has presented all three models proposed
for Quality specification of A&D, BM and ST tools,
respectively. We performed a preliminary
reevaluation of their effectiveness through the
application of the model on a set of different types
ICEIS 2009 - International Conference on Enterprise Information Systems
370

of tools. This preliminary evaluation shows that such
models are susceptible of being applied, given their
simplicity. Also, the attempt for quality specification
in this type of tools was achieved in this first
version.
Tools show a low Maintainability level, which is
common for FLOSS area.
The final objective of this research in progress is
proposing models that can be used to evaluate
FLOSS tools for other software development
disciplines, and support their selection and use by
SMEs and further software developing
organizations.
ACKNOWLEDGEMENTS
This research was supported by National Fund of
Science, Technology and Innovation, Venezuela,
under contract G-2005000165. The authors wish to
thank Engs. O. Alfonzo, L. Pessagno and D. Iovone
for their valuable collaboration in the culmination of
this research.
REFERENCES
Alfonzo, O., Domínguez, K., Rivas, L., Pérez, M.,
Mendoza, L., and Ortega, M., 2008. Quality
Measurement Model for Analysis and Design Tools
based on FLOSS. In Proc. 19th Australian Software
Engineering Conference (ASWEC 2008). Vol. 1. pp.
258 - 267, Perth, Australia, 2008.
Basili, V., 1992. Software modeling and measurement: the
goal/question/metric paradigm. Technical Report CS-
TR-2956. University of Maryland.
Baskerville, R., 1999. Investigating Information Systems
with Action Research. Communications of the
Association for Information Systems, 2, 19, 1-32.
Business Process Management Initiative (BPMI), 2006.
Business Process Modeling Notation Specification
BPMN 1.0, OMG.
Eriksson, H. and Penker, M., 2000. Business Modeling
with UML. Business Patterns at Work, Wiley.
IEEE-SWEBOK, 2004. SWEBOK: Guide to the Software
Engineering Body of Knowledge - 2004 Version. IEEE
Computer Society.
ISO/IEC 9126-1, 2001. Software engineering - Product
quality - Part 1: Quality model. First edition.
Johnston, S., 2004. Rational UML Profile for Business
Process, IBM.
Kendall, K. and Kendall J., 2005. Systems Analysis and
Design, (6th ed.), Upper Saddle River, NJ: Prentice
Hall.
Kitchenham, B., 1996. Evaluating Software Engineering
Methods and Tools. Part 1: The Evaluation Context
and Evaluation Methods. ACM SIGSOFT - Software
Engineering Notes, 21, 1, 11- 14.
Kruchten, P., 2003. The Rational Unified Process: An
Introduction (3rd ed.). Addison-Wesley Object
Technology Series.
Mendoza, L., Pérez, M., and Grimán, A., 2005. Prototipo
de Modelo Sistémico de Calidad (MOSCA) del
Software. Computación y Sistemas, 8, 3, 196-217.
Osterwalder, A., Pigneur, I., and Tucci, Ch., (2005)
Clarifying Business Models: Origins, present and
Future of the Concept, CAIS, 16, 1-25
Pessagno, L., Domínguez, K., Rivas, L., Pérez, M.,
Mendoza, L., and Méndez, E., 2008. Modelo de
Calidad para Herramientas FLOSS que dan apoyo al
Modelado de Procesos de Negocio. Revista Española
de Innovación, Calidad e Ingeniería del Software. 4.
pp. 144 - 156.
Rincón, G., Mendoza, L., and Pérez, M., 2004. Guía para
la Adaptación de un Modelo Genérico de Calidad de
Software. IV Jornadas Iberoamericanas en Ingeniería
de Software e Ingeniería del Conocimiento - JIISIC,
Madrid, España.
Stemberger, M., Jaklic, J., and Popovic, A., 2004.
Suitability of Process Maps for Business Process
Simulation in Business Process Renovation Projects,
16TH EUROPEAN SIMULATION Symposium
ESS2004. Budapest (Hungary), pp. 109-123.
Utting, M. and Legeard, B., 2007. Practical Model-based
Testing
. Morgan Kaufmann and Elsevier Publisher.
Whitten, J., and Bentley, L., 2006. Systems Analysis and
Design for the System Enterprise (7th ed.). McGraw
Hill Higher Education.
APPLICABILITY OF ISO/IEC 9126 FOR THE SELECTION OF FLOSS TOOLS
371
