
A DISCRETE EVENT SIMULATION MODEL
FOR THE EGRESS DYNAMICS FROM BUILDINGS
Paolo Lino, Bruno Maione
Dept. of Electrical and Electronics Engineering, Technical University of Bari, Bari, Italy
Guido Maione
Dept. of Environmental Engineering and Sustainable Development, Technical University of Bari, Taranto, Italy
Keywords:
Evacuation dynamics, Queuing networks, Discrete event systems, SimEvents
c
.
Abstract:
Safe egress of people from closed buildings is a critical issue, in which modern control methodologies and
information and communication technologies play a crucial role. Current research trends suggest us to prof-
itably use wireless networks of distributed sensors and actuators. Then, a large amount of feedback from the
real scenario is needed to determine control outputs. In this paper, we use a discrete event system approach
to define a simulation model of a complex real scenario. The egress of students and academic staff from a
lecture area in the School of Engineering in Bari was simulated, to validate the modeling approach in predict-
ing the evacuation process. Performance indices (flows of individuals in spaces and at critical points, number
of evacuated people, time to complete egress) were measured in standard conditions when no emergency or
panic phenomena occurred. The results show that the model properly represents real phenomena like blocking,
congestion or overcrowding, and faster-is-slower effect. Then, the same approach could be efficient to predict
flows in emergency conditions, when specific control actions are taken for speeding-up egress safely.
1 INTRODUCTION
Recently, safe egress of people from large buildings in
standard or emergency conditions has received con-
siderable attention. In particular, after the the 9/11
Twin Towers terrorist attack in New York City the
evacuation of complex and/or high buildings has been
a focus of attention. All the world over, safety has
been based on prescriptive design regulations con-
cerning building characteristics (distances, number of
exits, exit widths, etc.) which allow the occupants to
evacuate the structure within a pre-defined acceptable
amount of time. Hence evacuation procedures assur-
ing acceptable, building safety standards have been
a major concern for engineers. Consequently, the
crowd management has been based on the assessment
of the people handling capability of building spaces
before using them. However, the shortcomings of this
strategy is that it fails to take into account how peo-
ple actually behave during the egress. Today there is
a tendency to control the behavior of occupants also
before, during and after the evacuation process. How-
ever, the egress control for influencing the behavior
implies a research effort both in mathematical model-
ing and information and communication technologies
(ICT).
The mathematical or simulation models can be
very useful in: describing the crowd dynamics dur-
ing evacuation by means of system parameters (e.g.
crowd distribution and speed); studying critical phe-
nomena (blocking and congestion); measuring per-
formance indices (number of evacuated individuals,
time required, speed, etc.); designing and optimizing
buildings and escape routes; comparing alternative
control strategies. A good control strategy to route
individuals should predict and dynamically adapt it-
self to the different emergency conditions, the differ-
ent and random distributions and behaviors of indi-
viduals (type and time of reaction to alarms, decisions
taken, etc.), the random events (interruption of escape
routes, doors or exits blocked, overcrowding close to
emergency exits, etc.). Then, suitable control actions
are based on feedback from the environment.
Sensing and communication technologies are used
to measure variables which can indicate emergency
and/or panic, and, at the same time, to communicate
84
Lino P., Maione B. and Maione G. (2009).
A DISCRETE EVENT SIMULATION MODEL FOR THE EGRESS DYNAMICS FROM BUILDINGS.
In Proceedings of the 6th International Conference on Informatics in Control, Automation and Robotics - Signal Processing, Systems Modeling and
Control, pages 84-91
DOI: 10.5220/0002193400840091
Copyright
c
SciTePress

actions for safely escaping from the risky environ-
ment. Such communications can be directed to all
people by using distributed actuators (monitors, flash-
ing lights, automatically opening doors, acoustic sig-
nals and alarms, etc.), or to specific expert human
agents, devoted to help and direct groups of people
to a safe exit, by using Personal Digital Assistants
(PDAs) or palmtop computers.
Recently, our research group started up a scien-
tific project to profitably use wireless sensor networks
and ICT for managing evacuation from buildings dur-
ing emergencies. The main goal is reducing egress
times in a safe way. After a literature review, a model
suitable to develop supervisory control policies and a
test-bed are currently under investigation. The model
of the crowd dynamics defines the feedback infor-
mation and the control actions. In particular, the
time required to manage an emergency condition is
T = T
1
+ T
2
+ T
3
, given by the time to feel and rec-
ognize emergency (T
1
), the time to elaborate sensed
information (T
2
), the time to route the crowd in a safe
condition (T
3
). Control should minimize T
3
.
Scientific literature reports flow-based models us-
ing graphs or similar tools, cellular automata, agent-
based systems in which agents represent individuals,
activity-based models including sociological and be-
havioral aspects (Schreckenberg and Sharma, 2003;
Santos and Aguirre, 2004; Kuligowski and Peacock,
2005; Waldau et al., 2007). Flow-based models are
mostly based on the carrying capacity, i.e. they
predict the evacuation dynamics by considering the
topology of the building or physical location in which
the emergency occurs, and the evacuation policies
(Schreckenberg and Sharma, 2003). Other models
consider also the human response, i.e. the psycholog-
ical or sociological factors, and individual reactions
(Galea et al., 1996; Kl¨upfel et al., 2000; Schadschnei-
der et al., 2008). The two modeling approaches differ
for a macroscopic or microscopic point of view, re-
spectively.
Macroscopic models are usually employed to stat-
ically plan escape routes, for achieving the ’quick-
est flow’ or the ’maximum flow’, and they are not
adapted by the feedback from the real scenario. Nei-
ther microscopic models can be adapted in real time,
because a dynamic optimization of escape routes
and flows would require too much computational
resources and time. Moreover, a detailed micro-
scopic simulation environment could require informa-
tion that can’t be acquired during emergency. Basi-
cally, macroscopic models do not consider individ-
ual characteristics and behaviors, but they synthesize
a common emerging behavior. On the contrary, mi-
croscopic models consider each individual as an au-
tonomous decision making entity, moving and behav-
ing according to both personal and general criteria.
Then, we built a model useful to control evacu-
ation in real time, on the basis of the information
needed and control outputs. Important state feed-
back is about: distribution and number of individu-
als in the evacuated areas; measured flows in criti-
cal points, and congestion or overcrowding of spe-
cific areas or points that reduce flow; binary condition
(crossable/not crossable) of routes, doors, exits, tran-
sit points, which can be affected by fire, smoke, struc-
tural problems, etc.. Typical control outputs can be
associated to: flashing lights showing the best direc-
tion to a safe exit; acoustic signals; automatic opening
of doors to a safe exit, and automatic closing of doors
to dangerous or critical areas; instructions and orders
given by expert operators.
Asynchronous events occurring in emergency
conditions, and the discrete nature of controlled vari-
ables and signals from actuators, justify using a dis-
crete event system (Cassandras and Lafortune, 1999)
to model, analyze, and control the evacuation of peo-
ple. Typical events are sudden variation of available
paths, blocking of doors, elevators out of service, au-
tomatic closing/opening of doors, etc..
In particular, queuing networks (Kleinrock, 1975)
easily describe precedence relations, parallelism, syn-
chronization, modularity, and other properties. More
specifically, they can be used to statistically repre-
sent the decisions and actions affecting the evacu-
ated crowd behavior. To this aim, a probabilistic ap-
proach may take into account several decision pa-
rameters, which depend on the current system state
and are related to sociological and psychological fac-
tors. The human decision is based on elaboration of
perceived signals and information, not simply on a
causal stimulus-reaction relation. For example, con-
sider when individuals interact and form groups, or
try to rescue relatives going in opposite direction to
the crowd, or the influence of leaders, expert agents,
firemen, and so on. This approach simplifies the con-
trol system design, and, at the same time, considers an
individual perspective to a certain extent. Moreover,
escape routes can be easily recognized, and minimum
time/shortest length paths can be identified.
State dependent queues in the proposed model
make it difficult to find a closed form solution for
performance analysis. Thus, a simulation model has
been implemented in MATLAB/Simulink
c
environ-
ment, by means of the discrete event simulation tool
SimEvents. Here, we report some results on a case-
study used to test our approach, based on queuing net-
works and discrete event systems theory.
Section 2 briefly introduces the model and the
A DISCRETE EVENT SIMULATION MODEL FOR THE EGRESS DYNAMICS FROM BUILDINGS
85

assumptions made. Section 3 describes the devel-
oped simulation model. Section 4 gives the perfor-
mance measured in the simulated case-study. Section
5 draws the conclusions.
2 THEORETICAL MODEL OF
THE EGRESS DYNAMICS
Here, we summarize the assumptions made to build
a discrete event system model of the crowd dynamics
in standard or emergency conditions. We represented
the phenomenon as a queueing network system, com-
posed by different queues, each one describing the be-
havior of individuals in a zone of the evacuated envi-
ronment. A zone could be a room, a corridor, a stair-
way, an exit or an entrance, a door, but also a floor or
level of a building. Then, the approach can be used to
model and simulate complex networked buildings and
environments, by integrating and connecting different
queues in a single representation.
In this framework, we described the behavior of
people as an elementary queue with parameters deter-
mined by physical human peculiarities, according to
the Kendall notation (Kleinrock, 1975). The queue
service rate is interpreted as the time necessary to
cross rooms, corridors, stairs, and depends on the free
walking speed, i.e. the speed an individual may reach
in an open space. This speed is function of age, sex,
physical conditions and abilities, external pressure to
hurry, dawdling, baggage carried, gradient of walking
area (Fruin, 1971; Tregenza, 1976). An average value
v
0
= 1.34 m/s and a standard deviation of 0.26 for
a normal distribution are commonly accepted (Wei-
dmann, 1993). But actual walking speed is nonlin-
early affected by density ρ of individuals. Experimen-
tal studies showed that the average impeded speed v
decreases as the number of persons P per unit area in-
creases (Fruin, 1971; Tregenza, 1976): ρ has almost
no influence up to 0.27 P/m
2
, and motion is stopped
when ρ
max
= 5 P/m
2
(Tregenza, 1976), which is taken
as maximum space capacity. A linear relation can be
assumed between v and ρ, if ρ ∈ [0.3,2]. Here, we
assume the motion of individuals in rooms and corri-
dors as described in (Weidmann, 1993), according to
the following formula:
v(ρ) = v
0
1− e
−γ
1
ρ
−
1
ρ
max
, (1)
where γ = 1.913 is a fit parameter.
For motion on stairways, we consider the free
’horizontal’ speed, i.e. the horizontal component of
the speed vector, as normally distributed. The aver-
age is function of the previously cited parameters and
of the stair geometry (angle and riser height). Short
and long stairways can be distinguished (Fruin, 1971;
Kretz et al., 2008): the first exhibit higher speeds
when walking down-up, the latter when going up-
down. In this paper, we assume short stairways trav-
eled in both directions (average free up-down speed
0.780 m/s, average free down-up speed 0.830 m/s),
and long stairways only down-up (average free speed
0.423 m/s). These v
0
values (Kretz et al., 2008) are
used for the impeded actual speed in (1).
Moreover, interactions between individuals in-
crease with ρ, especially in bottlenecks (Helbing
et al., 2000). Frictions occur when people wish to
move faster than the currently achieved speed, a typi-
cal panic behavior. Then, arch-like clusters form and
grow at doors, exits, or other critical points, if de-
sired walking speed v
d
exceeds the critical free walk-
ing speed (Helbing et al., 2000; Parisi and Dorso,
2007). The consequence is a faster-is-slower effect
which delays the egress. Then, two different out-
flow regimes exist depending on v
d
: the first is when
outflow depends linearly on v
d
(the faster individuals
want to move, the faster they evacuate); the second is
when outflow decreases with v
d
, due to interactions.
Queues with null queueing space and a certain
server capacity are used to represent rooms, corridors,
stairways, doors, exits, entrances and gateways. Each
queue can accommodate as many people as the ca-
pacity of the modeled space (Jain and Smith, 1997).
If a unit space has a capacity of 5 P/m
2
, an area of
length L and width W has a capacity C = 5 · L · W.
The service time is normally distributed, with an av-
erage value given by L/v(ρ). Differences between the
modeled spaces are obtained by specifying a different
v
0
for each type of space. Arrivals to queues are expo-
nentially distributed, as it is commonly assumed and
also observed. Summing up, we obtain state depen-
dent M/G/C/C queues.
In particular, doors, exits, entrances, and gateways
are modeled by queues with a server capacity equal to
the width W of the passage (more precisely the maxi-
mum number of individuals that can flow through). If
the way is filled at its capacity, then the queue of the
antecedent space is blocked.
The queue service rate is determined by taking
into account the faster-is-slower effect, as described
in the following. First of all, it is supposed that the
desired walking speed of individuals crossing a bot-
tleneck varies as proposed by (Helbing et al., 2000):
v
d
(t) = [1− p(t)]v
d
(0) + p(t)v
max
d
, (2)
where v
d
(0) is the initial desired speed, v
max
d
is the
maximum desired speed, and p(t) specifies the crowd
ICINCO 2009 - 6th International Conference on Informatics in Control, Automation and Robotics
86
impatience (Helbing et al., 2000), with:
p(t) = 1−
v(t)
v
d
(0)
, (3)
being v(t) the average speed of individuals in the
crowd. Then, we assume that the queue desired ser-
vice rate µ
d
(t) and the average service rate µ(t) re-
late to the desired and average speeds according to
µ
d
(t) = Wv
d
(t) and µ(t) = Wv(t), respectively. Fi-
nally, the actual service rate µ is normally distributed
with an average value given by (Wang et al., 2008):
E[µ | µ
d
] =
(
µ
d
if µ
d
≤ µ
c
1− e
α
µ
d
−µ
c
if µ
d
> µ
c
(4)
where E[µ | µ
d
] is the expected value of the service
rate µ, µ
c
is the flow capacity of the passage, and α is
a negative constant. To sum up, firstly µ
d
is computed
and compared to µ
c
, then E[µ | µ
d
] is used to generate
µ.
3 THE SIMULATION MODEL
The proposed model represents the main aspects of
the evacuation process, and can be exploited to carry
out performance analysis in terms of egress times,
number of evacuees per time unit, length of queues,
existence of bottlenecks and congestion. Unfortu-
nately, a closed form solution giving the steady state
probabilities of the network cannot be easily found, as
service times depend on the system state. Moreover,
the real time management of evacuation can take ad-
vantage from the knowledge of the transient dynam-
ics, which cannot be analytically determined. Thus, a
queueing network simulation model providing a tool
suitable for implementing and validating evacuation
strategies is developed in the MATLAB/Simulink
c
environment. In particular, we exploit the discrete
event system toolbox SimEvents. Just like other soft-
ware tools like Arena, Extend, Witness, etc., it al-
lows the representation of complexdiscrete-eventsys-
tems by a network of queues. Moreover, the integra-
tion with MATLAB and Simulink simplifies the mod-
eling process of hybrid dynamical systems, which
include continuous-time, discrete-time and discrete-
event subcomponents, such as sensor networks and
distributed control systems.
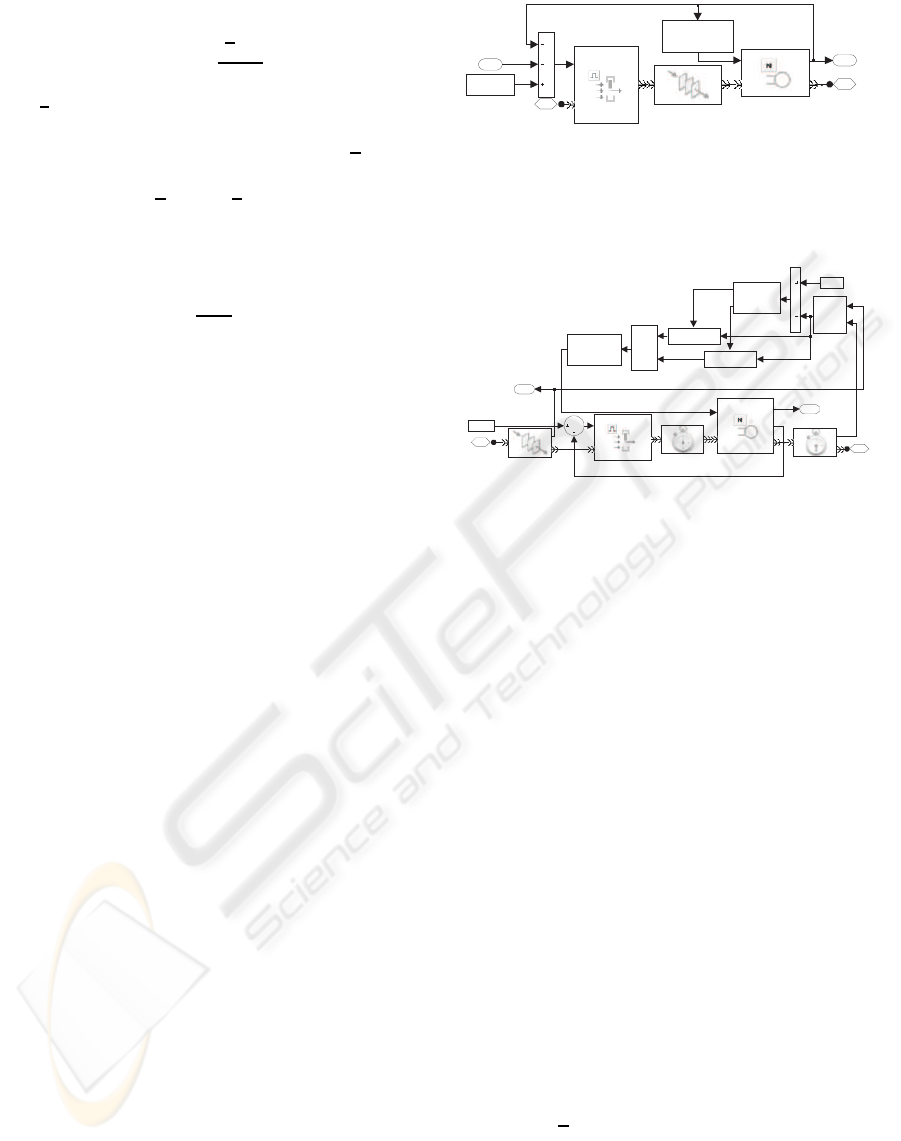
Figure 1 depicts the block scheme of the queue
which models wide areas, like rooms and corridors.
We assume the flow in one direction. The main el-
ements of the scheme are a FIFO queue represent-
ing the queueing space and a N-server, consisting of
a number of servers matching the available capacity.
UNI-DIRECTIONAL ROOM /CORRIDOR
Numberof
individuals
1
Individuals
arriving
2
Individuals
evacuating
1
ServiceTime
Computation
Servers
IN
t
OUT
#n
QueueingSpace
IN
OUT
Block/release
individuals
IN
en
OUT
Area
capacity
5*L*W
Doorqueue
length
1
Figure 1: SimEvents implementation of rooms, corridors,
and stairways.
"faster -is-slower " effectimplementation
UNI-DIRECTIONAL DOOR /BOTTLENECK
Queue
length
Queue
length
2
Cum. number
1
Individuals
arriving
2
Individuals
evacuating
1
ServiceTime
Computation
StopTimer
IN
OUT
et
StartTimer
IN
OUT
QueueingSpace
IN
OUT
#n
if {}
qd
v (t)
Merge
Max. flow
Ce
EnabledGate
IN
en
OUT
DoorServers
IN
t
OUT
#d
#n
Door
capacity
DC
Desired
Speed
else {}
qd
v (t)
Congestion
evaluation
u1
if(u1 >= 0)
else
Figure 2: SimEvents implementation of bottlenecks.
The function Service Time Computation computes the
service time depending on the area congestion. It con-
sists of two functions: the first derives the current
speed from (1) by considering the number of peo-
ple crossing the area; the second computes the ser-
vice time as the path length divided by the speed.
The Block/release element prevents individuals to en-
ter area, if the maximum capacity 5 · L · W has been
reached.
For stairways we use the same scheme in Figure 1:
free walking speeds specified in Section 2 are used in
(1) to compute the current speed in congestion condi-
tions. More precisely, the individual space occupancy
is suitably increased for upward motion, because peo-
ple oscillate sideways when rising stairways, which
reduces the available space.
The block scheme implementing bottlenecks like
doors is represented in Figure 2, and it suitably mod-
els the faster-is-slower effect. The model is composed
of a FIFO queue, whose space will be defined in the
next subsection, and a N-server with as many servers
as the individuals that can cross the bottleneck at the
same time. The service time is determined by (4),
(2) and (3), provided that an estimate of the average
service rate µ(t) is available. If ∆T is the time in-
terval taken by the last individual to cross the door, as
measured between blocks Start Timer and Stop Timer,
its reciprocal µ = 1/∆T represents the current service
rate. Thus, since the number n of individuals waiting
to be served has a zero service rate, the overall aver-
A DISCRETE EVENT SIMULATION MODEL FOR THE EGRESS DYNAMICS FROM BUILDINGS
87
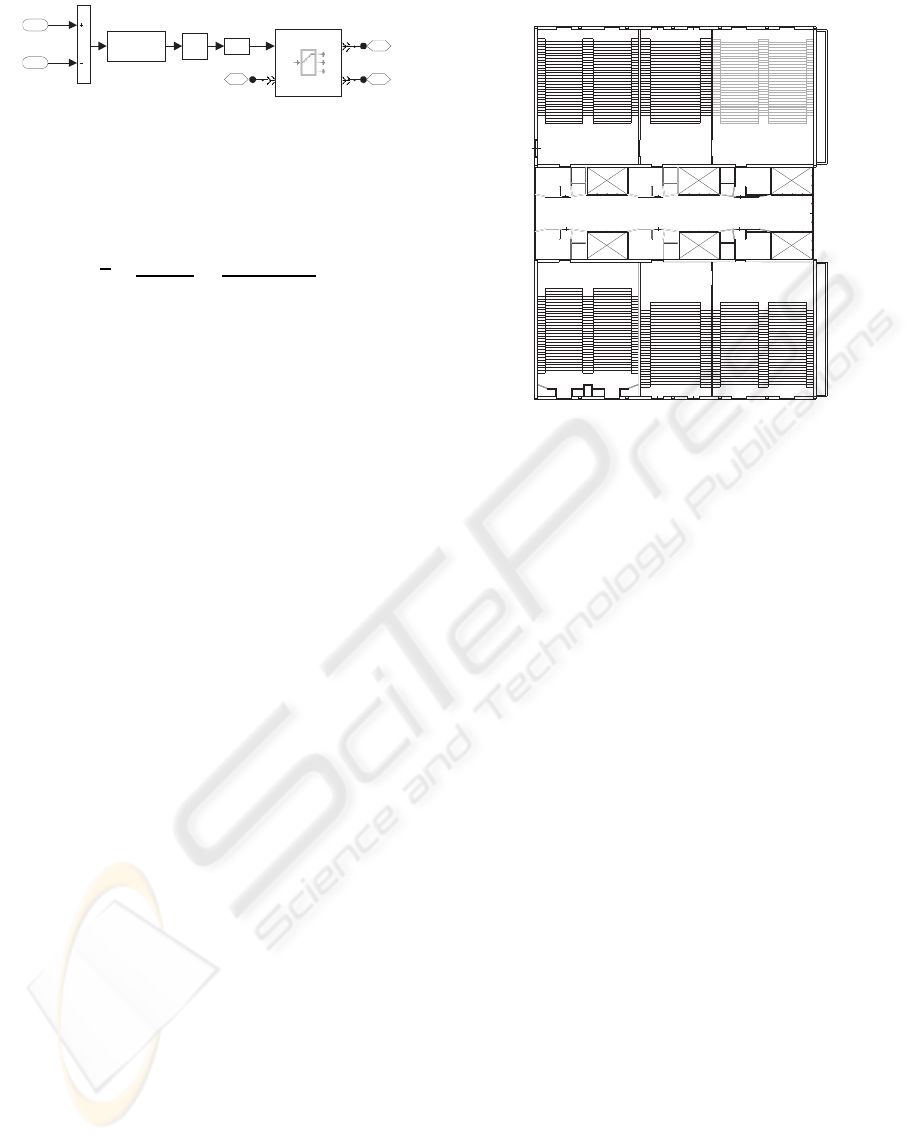
ROUTINGPROBABILITIESCOMPUTATION
Torightdoor
3
Individuals
evacuating
2
Toleftdoor
1
OutputSwitch
IN
p
OUT1
OUT2
Normal
distribution
MATLAB
Function
u+1> 0
Rightdoor
queuelength
2
Leftdoor
queuelength
1
Figure 3: Transition from corridors/rooms to multiple
doors.
age service rate can be computed as:
µ =
∑
µ
i
(n+ 1)
=
1
(n+ 1) · ∆T
(5)
Then, the Desired speed block calculates p(t) accord-
ing to (3) and v
d
(t) according to (2). If the resulting
value overcomes the door maximum flow capacity, a
congestion occurs. Finally, the Service time compu-
tation block outputs a service time obtained from a
normal distribution with a mean equal to the recipro-
cal of the service rate.
When rooms/corridors and doors share the same
queueing space, we must guarantee that the num-
ber of individuals in the system does not overcome
the overall capacity. Then, the door queueing space
capacity is set equal to the room/corridor capacity.
So, after connecting the elementary sub-models, the
number of individuals waiting in front of the door is
used to reduce the number of available servers in the
room/corridor. As an example, individuals arriving at
the end of a corridor enter the door queue and wait
for a free server. At the same time, they reduce the
corridor available space, but do not affect the walking
speed of individuals crossing the corridor. To imple-
ment this condition, the signal Door queue length rep-
resenting the number of individuals in the door queue
is fed back (see Figure 1).
For rooms/corridors with more than one door an
Output switch block connects the area to exits. The
routing probability is set for each possible direction
(Figure 3). We assume that probability to choose each
door is inversely affected by its crowding condition.
To introduce a sufficient level of uncertainty in the
choice, we generate a number from a normal distri-
bution having the length of each queue as its average.
Then, the selection comes from comparing the results.
4 SIMULATION RESULTS
As a case-study, we consider the area of large lecture
rooms at Technical University of Bari, i.e. 5 lecture
rooms and a Great Hall, all connected to a main corri-
dor, which has an entrance/exit point 2.73 m wide and
a maximum flow of 3 persons at a time (Figure 4).
ROOM A
A
ex2
ROOM BROOM C
ROOM DROOM E
MAIN CORRIDOR
GREAT HALL
A
ex1
LOWER AREA
(lecturer)
main
exit
emergency
exit
UPPER AREA
MIDDLE AREA
(desks)
(exits)
Figure 4: The case-study.
The Hall is 294 m
2
large, with a maximum capac-
ity of 270 persons. Three rooms (A, C, D) are 294 m
2
large, with a maximum capacity of 270 persons. Two
smaller rooms (B, E) are 207 m
2
large, with a max-
imum capacity of 180 persons. Sitting desks in the
Great Hall and in A, C, D are vertically distributed
from a lower to an upper level, an internal corridor
separates desks in two columns and two more exter-
nal corridors are available. Rooms B, E have only
one column of desks and two external corridors. All
rooms have one single access/exit point at the lower
level (1.6 m wide, maximum flow of 2 persons at a
time), used by academic staff, and two access/exit
doors at the upper level (2.3 m wide, maximum flow
of 2 persons at a time), used by students. The lower
level doors link rooms to the main corridor, which is
235 m
2
large. Each room communicates with its ad-
jacent room(s), except for the Great Hall: the three
communication doors are 2.3 m wide. Room C has
also a further emergency exit (see Figure 4).
To sum up, there are 14 points of exit: one from
the main corridor, 12 from the upper level doors, one
from room C. Then, the main and natural flow of stu-
dents during evacuation is through the upper doors,
otherwise through the corridor, especially the ones sit-
ting in the first lines of desks. The teaching staff can
use the room lower exit doors, the corridor and then
its exit. People in room C can use the added emer-
gency exit, which is an opportunity also for people in
the Great Hall (e.g. if the exits from the Great hall
are blocked or unavailable). Each room is divided
into 3 main areas, representing the lecturer (lower),
the desks (middle), and the exit (upper) areas, respec-
ICINCO 2009 - 6th International Conference on Informatics in Control, Automation and Robotics
88
Right
arrivals
5
Left
arrivals
4
OUT Aex2
3
OUT Aex1
2
Central
arrivals
1
UNI-DIRECTIONAL
DOOR/BOTTLENECK Aex1
Cum. number
Queuelength
Arrivals
Individualsevacuating
UNI-DIRECTIONAL
DOOR/BOTTLENECK Aex2
Cum. number
Queuelength
Arrivals
Individualsevacuating
RIGHTSTAIRWAY
Cum. number
Fromdesks
Fromdown
Departures
LEFTSTAIRWAY
Cum. number
FromDown
FromDesks
Departures
LANDING AREA
Queuelength Aex 1
Queuelength Aex 2
Individualsarriving
To Aex2
To Aex1
DESKS
In1
In2
In3
Toleftstairway
Torightstairway
Tocentr. stairway
CENTRAL STAIRWAY
Cum. number
FromDown
FromDesks
Departures
Aex 2 queuelength
Num _ per _AmA 2OD
Aex 1 queuelength
Num _ per _AmA 2OS
IN1
IN2
IN3
OUT
# ofindividuals
evacuatedfrom Aex 2
Num _ per _A2OD
# ofindividuals
evacuatedfrom Aex 1
Num _ per _A2OS
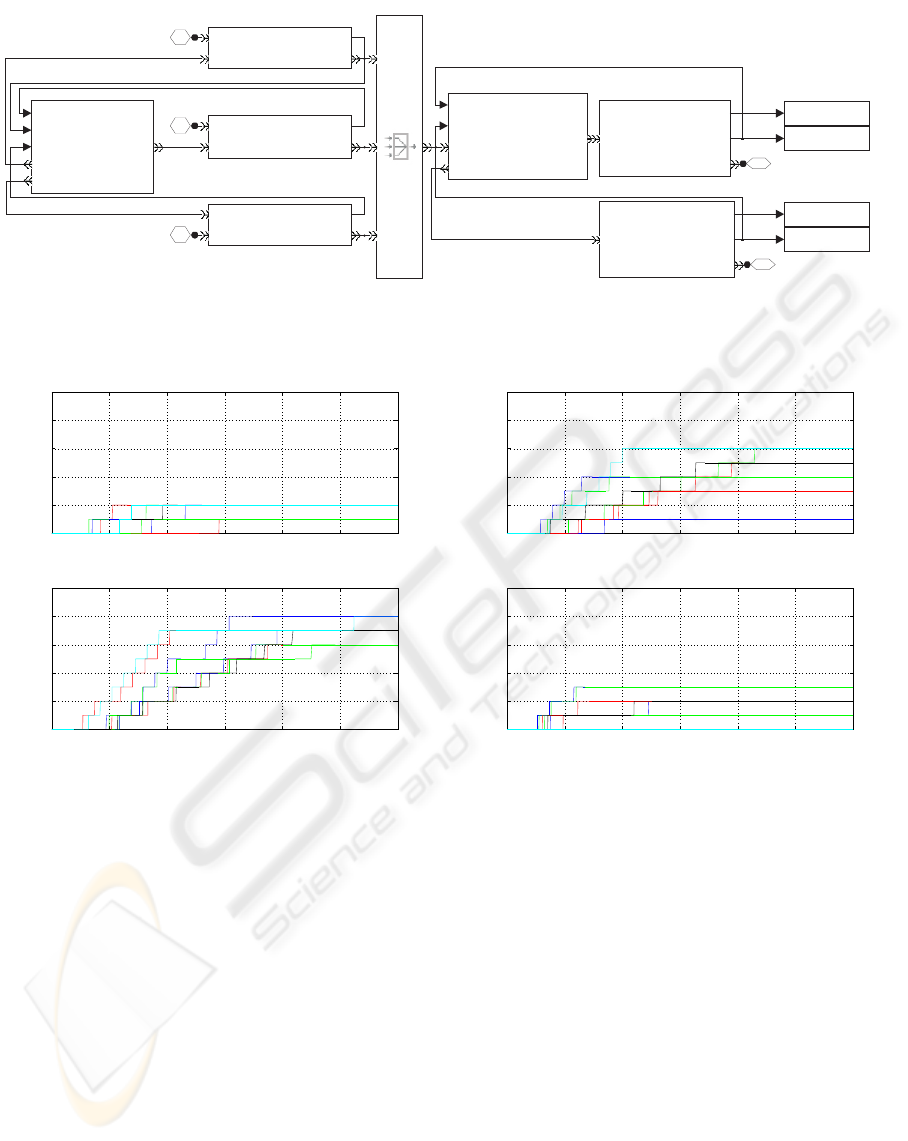
Figure 5: SimEvents model for upper and middle areas in room A.
0 5 10 15 20 25 30
0
2
4
6
8
10
Flow from Room A to Room B
Time [s]
Number of individuals
0 5 10 15 20 25 30
0
2
4
6
8
10
Flow from Room B to Room A
Time [s]
Number of individuals
0 5 10 15 20 25 30
0
2
4
6
8
10
Flow from Room B to Room C
Time [s]
Number of individuals
0 5 10 15 20 25 30
0
2
4
6
8
10
Flow from Room C to Room B
Time [s]
Number of individuals
Figure 6: Cumulative number of individuals crossing doors connecting Rooms A, B and C.
tively. The exit area consist of a landing space receiv-
ing individuals from stairways and includes two exits.
Then, 3 queues are associated to the lower area, 2-3
queues to the middle area, depending on the number
of staircases, and 3 to the last area, i.e. two for exits
and one for the landing space.
The SimEvents block scheme for the upper and
middle areas of room A is in Figure 5.
An extensive simulation analysis has been exe-
cuted to predict the evacuation dynamics. Only rele-
vant results are presented. Without loss of generality,
we assume evacuation in normal circumstances, i.e.
panic or environmental conditions do not affect the
behavior. Representation of evacuation under panic
conditions simply needs a tuning of model parame-
ters, which is under investigation.
We suppose that egress starts at the end of a lec-
ture session, so that all the rooms are evacuated simul-
taneously. As initial condition, an average population
of 150 individuals occupies each room, mainly dis-
tributed in the desks area, while the lower and upper
areas are sparsely populated. The Great Hall and the
main corridor are initially empty. We assume that in-
dividuals occupying the desk and upper areas evacu-
ate from exits in the same room, while those in lower
areas evacuate from the starting room or toward an
adjacent room or the corridor.
All results refer to 5 different simulation runs.
Figure 6 represent flows trough doors connecting
rooms A and B, and B and C, respectively. The flow is
composed of individuals initially occupying the lower
areas.
It is evident that only few of them try to evacuate
from larger rooms A and C toward room B, because
routing probabilities depend on the current crowding.
In fact, the initial crowd density is larger in the smaller
rooms. Finally, the cumulative number of individu-
als go from a room to another one changes at each
A DISCRETE EVENT SIMULATION MODEL FOR THE EGRESS DYNAMICS FROM BUILDINGS
89
0 5 10 15 20 25 30
0
2
4
6
8
10
Flow from Room A to main corridor
Time [s]
Number of individuals
0 5 10 15 20 25 30
0
2
4
6
8
10
Flow from Room B to main corridor
Time [s]
Number of individuals
0 5 10 15 20 25 30
0
2
4
6
8
10
Flow from Room C to main corridor
Time [s]
Number of individuals
0 5 10 15 20 25 30
0
2
4
6
8
10
Flow from Room D to main corridor
Time [s]
Number of individuals
0 5 10 15 20 25 30
0
2
4
6
8
10
Flow from Room E to main corridor
Time [s]
Number of individuals
0 5 10 15 20 25 30
0
2
4
6
8
10
Flow from Great Hall to main corridor
Time [s]
Number of individuals
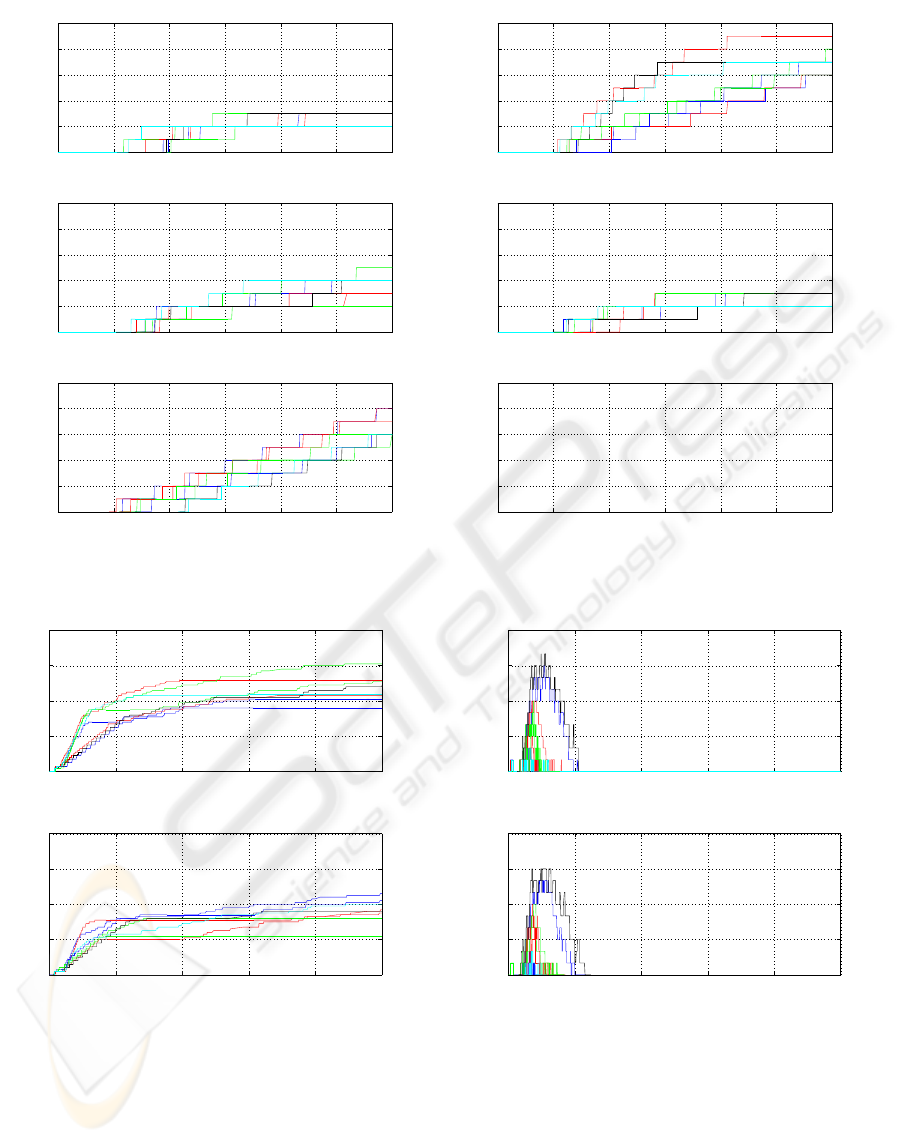
Figure 7: Cumulative number of individuals flowing from Rooms and Great Hall to main corridor.
0 50 100 150 200 250
0
20
40
60
80
Evacuation through A
ex1
Time [s]
Number of individuals
0 50 100 150 200 250
0
20
40
60
80
Evacuation through A
ex2
Time [s]
Number of individuals
(a)
0 50 100 150 200 250
0
3
6
9
12
Queue length at A
ex1
Time [s]
Number of individuals
0 50 100 150 200 250
0
3
6
9
12
Queue length at A
ex2
Time [s]
Number of individuals
(b)
Figure 8: Evacuation from Room A: (a) cumulative number of individuals evacuating from A
ex1
and A
ex2
; (b) queues length
at A
ex1
and A
ex2
.
run, due to the randomness of the transitions. Similar
flows are obtained for other rooms.
Flows of individuals choosing the main corridor
are shown in Figure 7.
Cumulative numbers of individuals increase al-
most linearly in all cases, being the doors capacities
sufficient to handle the traffic. Just after 30 s all indi-
viduals have abandoned lower areas.
Finally, Figure 8 depicts evacuation from Room A
through the two upper exits.
The flow is mainly composed of individuals leav-
ing the desk area. Figure 8(a) shows that most of
ICINCO 2009 - 6th International Conference on Informatics in Control, Automation and Robotics
90

people leaves after a delay of about 10 s, which is
nearly the time necessary to cover half of the stair
length. During the initial transient, the individuals
reaching exits can immediately evacuate with a min-
imum service time, as doors are initially free. Con-
versely, slopes of curves in Figure 8(a) reduce with
overcrowding of queues in the upper area, which de-
lay individuals. Figure 8(b) shows that individuals
reaching the upper area direct themselves almost uni-
formly towards A
ex1
and A
ex2
, as the choice is affected
by the doors crowding. After 60 s, the queues of up-
per area and exits are nearly empty, so that arriving
individuals are promptly served. The overall evacua-
tion takes 120-160 s on average.
5 CONCLUSIONS
In this paper, a simulation model describing the evac-
uation dynamics from buildings has been presented,
considering the queueing network theory as a mod-
eling tool. The model is suitable for implementing
and testing control strategies for managing emergency
situations. Results from a simulation model imple-
mented in the Matlab/Simulink
c
environment, by us-
ing the discrete events simulation toolbox SimEvents,
have shown the feasibility of the approach. Without
loss of generality, simulation represents evacuation
dynamics in ordinary conditions. Parameters tuning
for panic situations is under investigation. A further
validation is under development by comparing pre-
liminary results with those obtained using commer-
cial tools.
ACKNOWLEDGEMENTS
This work is part of the Research Project ”Infrastrut-
ture di telecomunicazione e reti wireless di sensori
nella gestione di situazioni di emergenza” funded by
Apulia Regional Government, Italy.
REFERENCES
Cassandras, C. and Lafortune, S. (1999). Introduction to
discrete event systems. Kluwer Academic Publishers,
Norwell, USA.
Fruin, J. (1971). Pedestrian - Planning and Design.
Metropolitan Association of Urban Designers and En-
vironmental Planners, New York, USA.
Galea, E., Owen, M., and Lawrence, P. (1996). he exodus
evacuation model applied to building evacuation sce-
narios. Fire Engineers Journal, 6:27–30.
Helbing, D., Farkas, I., and Vicsek, T. (2000). Simulating
dynamical features of escape panic. Nature, 407:487–
490.
Jain, R. and Smith, J. (1997). Modeling vehicular traffic
flow using m/g/c/c state dependent queueing models.
Transportation Science, 31(4):324–336.
Kleinrock, L. (1975). Queuing Systems, volume I: Theory.
John Wiley & Sons, New York, USA.
Kl¨upfel, H., Meyer-Konig, T., and Schreckenberg, M.
(2000). Microscopic simulation of evacuation pro-
cesses on passenger ships. In Proceedings of the 4th
International Conference on Cellular Automata for
Research and Industry, pages 63–71, Karlsruhe, Ger-
many.
Kretz, T., Gr¨unebohm, A., Kessel, A., Kl¨upfel, H., Meyer-
K¨onig, T., and Schreckenberg, M. (2008). Upstairs
walking speed distributions on a long stairway. Safety
Science, 46:72–78.
Kuligowski, E. and Peacock, R. (2005). A review of build-
ing evacuation models. Technical Note 1471, NIST,
USA.
Parisi, D. and Dorso, C. (2007). Morphological and dynam-
ical aspects of the room evacuation process. Physica
A, 385:343–355.
Santos, G. and Aguirre, B. (2004). A critical review of
emergency evacuation simulation models. In NIST
Workshop on Building Occupant Movement during
Fire Emergencies, pages 25–50, USA. NIST Press.
Schadschneider, A., Klingsch, W., Kl¨upfel, H., Kretz, T.,
Rogsch, C., and Seyfried, A. (2008). Encyclopedia of
Complexity and System Science, chapter Evacuation
Dynamics: Empirical Results, Modeling and Applica-
tions. Springer, Berlin, Germany. To appear.
Schreckenberg, M. and Sharma, S., editors (2003). Pedes-
trian and Evacuation Dynamics. Springer-Verlag,
Berlin, Germany.
Tregenza, P. (1976). The Design of Interior Circulation.
Crosby Lockwood Staples, London, UK.
Waldau, N., Gatterman, P., Knoflacher, H., and Schrecken-
berg, M., editors (2007). Pedestrian and Evacuation
Dynamics 2005. Springer-Verlag, Berlin, Germany.
Wang, P., Luh, P., Chang, S., and Sun, J. (2008). Model-
ing and optimization of crowd guidance for building
emergency evacuation. In 4th IEEE Conference on
Automation Science and Engineering, pages 328–334,
Key Bridge Marriot, Washington DC, USA.
Weidmann, U. (1993). Transporttechnik der fussg¨anger
- transporttechnische eigenschaften des fuss-
gngerverkehrs. London, uk, Institut f¨uer Verkehrspla-
nung, Transporttechnik, Strassen - und Eisenbahnbau
IVT an der ETH Z¨urich. In German.
A DISCRETE EVENT SIMULATION MODEL FOR THE EGRESS DYNAMICS FROM BUILDINGS
91
