
RELEVANCE AND LOCI OF ODORANT FEATURES IN THE RAT
OLFACTORY BULB
Statistical Methods for Understanding Olfactory Codes in Glomerular Images
Benjamin Auffarth, Agust´ın Gutierrez–Galvez and Santiago Marco
Intelligent Signal Processing group, Department of Electronics, University of Barcelona
Artificial Olfaction group, Institute for Bioengineering of Catalonia (IBEC), C/Baldiri Reixac 13, 08028 Barcelona, Spain
Keywords:
Olfactory coding, Olfactory bulb, Odorants, Glomeruli, Property–activity relationship, Classification, Non-
parametric statistics.
Abstract:
The relationship between physicochemical properties of odor molecules and perceived odor quality is arguably
one of the most important issues in olfaction and the rules governing this relationship remain unknown. Any
given odor molecule will stimulate more than one type of receptor in the nose, perhaps hundreds, and this
stimulation reflects itself in the neural code of the olfactory nervous system. We present a method to investigate
neural coding at the glomerular level of the olfactory bulb, the first relay for olfactory processing in the brain.
Our results give insights into localization of coding sites, relevance of odorant properties for information
processing, and the size of coding zones.
1 INTRODUCTION
Animals are able to recognize a large number of dif-
ferent odors (Axel, 1995) and this is crucial in social
interaction, feeding, and mating. This discriminatory
performance is due to a series of information process-
ing steps at several levels of the olfactory system, be-
ginning from graded affinity of olfactory receptors to
different odors. Depending on the animal, there are
several hundred olfactory receptor types, in particular
about 1000 types in the rat (Buck and Axel, 1991), the
transaction principles of which is presently not well
understood. Apparently, there are no molecular fea-
tures of the odorant that directly determine perceptive
quality (Sell, 2006).
It has been experimentally found (Malnic et al.,
1999) that each receptor type responds to a broad
range of odorants and each odorant evokes responses
from many different receptor types. The odotope the-
ory (Mori and Shepherd, 1994) is the prevalent view
on olfactory transduction and proposes that each ol-
factory receptor detects a combination of structural
molecular features, although it is not clear which
these features are. These combinations of features
are called odotopes in analogy with epitopes, the anti-
genic determinant of the immune system. Each odor-
ant molecule contains many different properties and
the information about the odorant would then be en-
coded by the combined responses of many types of
receptors, each of which recognizes a specific subset.
Axons from olfactory neurons are bundled in neu-
ropil structures in the olfactory bulb, called glomeruli,
in a way that each glomerulus receives axons just
from one type of receptor(Bozza et al., 2002). It is
well–established that there is a systematic spatial cod-
ing of chemical properties in glomerular activations
(Johnson et al., 1998; Johnson and Leon, 2007) in
the way that odorants with different chemical struc-
ture and shape generate distinct patterns of glomeru-
lar activation. It has also been found that in the rat
olfactory bulb certain properties correlate with activa-
tion in certain zones (Uchida et al., 2000; Johnson and
Leon, 2000; Mori et al., 2006; Johnson et al., 2007).
In this paper, we present a method to analyze sev-
eral aspects of property–activation relationships in rat
glomerular coding of odorants. The questions we in-
vestigate are: which odorant properties are coded and
where, what is the size of the coding zones, and how
relevant are individual odorant properties to the en-
coding. The last question should also give us infor-
mation about relevance of odorant properties to olfac-
tory processing and thereby their contribution to per-
ception of odor quality.
Our techniques consisted of a nonparametric sta-
37
Auffarth B., Gutierrez–Galvez A. and Marco S. (2010).
RELEVANCE AND LOCI OF ODORANT FEATURES IN THE RAT OLFACTORY BULB - Statistical Methods for Understanding Olfactory Codes in
Glomerular Images.
In Proceedings of the Third International Conference on Bio-inspired Systems and Signal Processing, pages 37-44
DOI: 10.5220/0002697200370044
Copyright
c
SciTePress
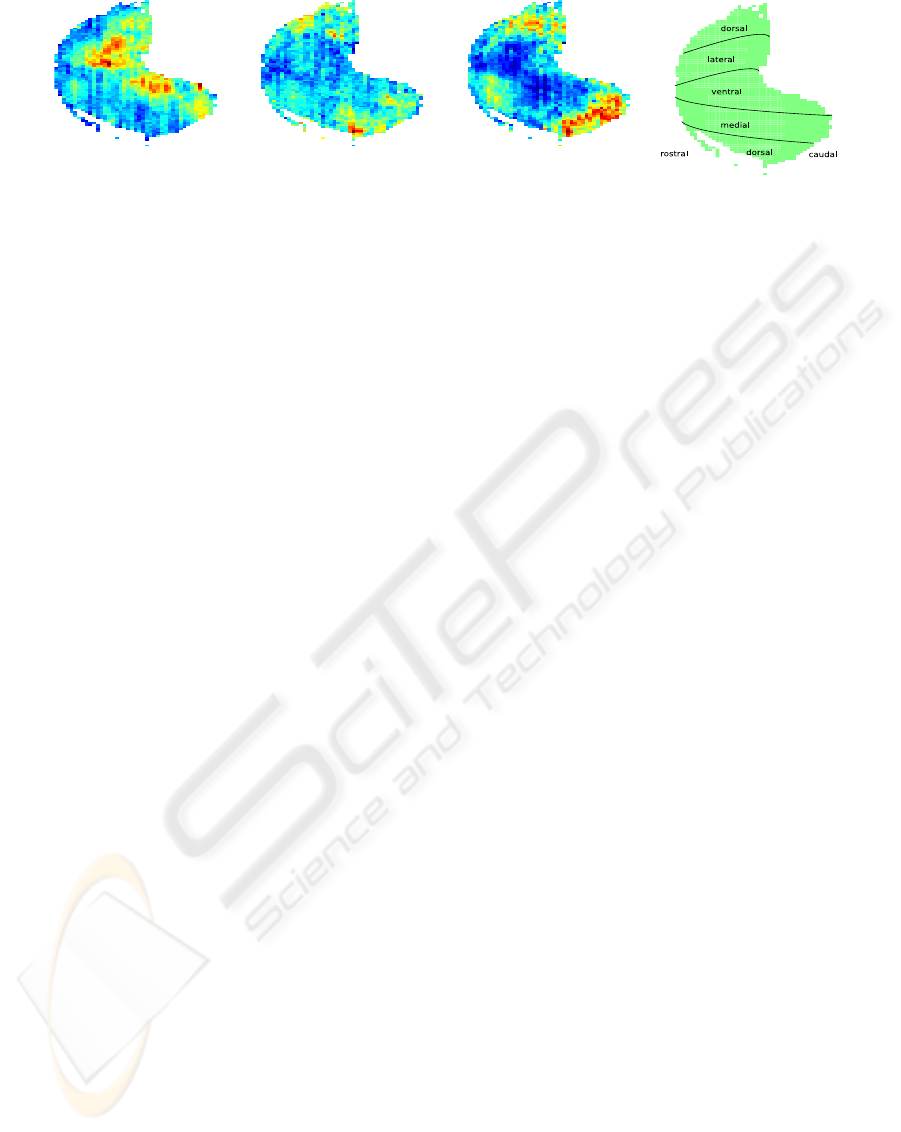
(a) Undecane (b) 2,3,5,6-
tetramethylpyrazine
(c) 3,3,5-
trimethylcyclohexanone
(d) Anatomical Lo-
cations
Figure 1: Glomerular activity in response to three odorants and anatomical locations in the olfactory bulb. In the response
maps, red stands for high activation, blue for low activation. It can be seen that odorants can be distinguished – to some extend
– by the spatial activation of glomeruli. 1(a) shows responses to the odorant undecane, which is an alkane (compare 2(a)).
Pixel intensities in 1(b) express activation in response to 2,3,5,6-tetramethylpyrazine, which is an aromatic (compare figure
2(c)). In 1(c) responses to 3,3,5-trimethylcyclohexanone (CAS number 873-94-9) can be seen. This last odorant is a ketone
(compare 2(e)). The rightmost subfigure, 1(d), denominates locations in anatomical terms for the glomerular layer of the rat
olfactory bulb. This was adapted from (Johnson et al., 1999).
tistical test with bootstrapping, and support–vector
machine classification. Information of these tech-
niques should reveal relevance of odorant properties,
and localization and size of coding zones.
We will explain first the data set, then in the meth-
ods section we explain how we approached the ques-
tions, before we look at results, discuss them, and
draw conclusions.
2 DATA SET
In this study we used a set of images of glomerular
responses in the rat olfactory bulb (Johnson et al.,
2006) provided by the group around Michael Leon
and Brett Johnson at the University of California,
Irvine. The images were taken by 2–deoxyglucose
autoradiography and covered the entire lamina. They
took measurements at systematic angle increments
around equally spaced coronal bulb sections. Their
technique has the advantages to work with unanes-
thetized, freely respiring animals and gives the ability
to analyze the entire glomerular layer. On the other
hand, it does not record temporal dynamics of the ol-
factory response and it is impossible to compare re-
sponses in the same animal.
Each of these images corresponds to glomerular
responses to one particular odorant. Examples from
this data set can be seen in figure 1, which shows
glomerular responses to two odorants.
We mean–centered all pixels to have maps that
show activation at each pixel relative to its overall
pattern, and normalized deviations to standard unit to
compensate for differences in absolute pixel intensi-
ties. We started with 472 maps, some of which rep-
resenting responses to identical odorants in different
concentrations. We took means over concentrations
and discarded a few activity maps for which we did
not have the information of the odorant. This pre–
processing left us with 308 maps corresponding to
distinct and known odorants.
There were missing values in some images. In
the bottom-left of ventral-centered charts they were
caused by loss of tissue on the knife during cryosec-
tioning. Missing values in the central-right parts of
the image were principally due to loss of tissue during
removal of the bulbs from the skull using microdis-
secting scissors. Pixels that had missing values in any
of the images were ignored in the analysis, which left
us with 1834 pixels.
After pre–processing, the data set was a matrix
M ∈ R
308,1834
of activations. Each of the 1834 points
(also: pixels) of this matrix, p ∈ R
308
, represented re-
sponses of the same glomerulus to different odorants.
For all activation maps that remain after pre–
processing we had the information concerning which
odorant they correspond to and additional descrip-
tive information also provided by the Leon Lab. De-
scriptors, about 200 in total, included physicochemi-
cal odorant properties as well as perceptual properties
ascribed to the sensed odor. Properties were of con-
tinuous and binary type. Continuous properties in-
clude molecular length, height, and weight. To give
some examples of binary properties, binary proper-
ties concerned cyclization (whether an odorant is al-
icyclic, aromatic, polycyclic, or heterocyclic), bond
saturation (whether an odorant is alkene, alkane, or
alkyne), and functional groups (whether an odorant is
BIOSIGNALS 2010 - International Conference on Bio-inspired Systems and Signal Processing
38

ester or lactone, amine, carboxylic acid, contains sul-
fur, contains halogen, is a ketone, alcohol or phenol).
Perceptual properties are all binary and included fla-
vors such as sweet, camphoraceous, floral, and minty.
For some properties there were many associated activ-
ity maps, for some very few. We had to discard many
because of insufficient representation in the data.
3 METHODS
3.1 Localization of Coding Zones
One of our goals in this research is to determine the
activation loci for each property. This is to say, find-
ing the bulbar zones that encode for each property if
such a zone exists.
For each point in the maps and each odorant or
perceptual property, we tested statistically whether
the given pixel shows significant differences with re-
spect to the property. For binary properties we com-
pared activations on images, where a property was
given, with activations on images, where property was
not given using a statistical test.
For some properties, we had only very few images
that corresponded to them. To account for statistical
variations in these distributions we used a bootstrap
(Efron, 1982) procedure to estimate p–values of the
statistical test.
The application of the bootstrap to test and de-
rive confidence intervals and p–values was introduced
by (Felsenstein, 1985). Statistical analysis is repeat-
edly applied to subpopulations of the same size, gen-
erated by sampling from the original population with
replacement. Bootstrap methods can be used for hy-
pothesis tests, calculating confidence intervals and re-
gression analysis.
The Wilcoxon ranked–sum test (also called
Mann–Whitney U test) assesses whether two sam-
ples come from the same distribution (null hypoth-
esis). It is analogous to applying the student t–test
on the data after ranking over the combined samples.
It has the advantage of not assuming normality and
of more robustness with respect to the t–test and al-
lows the two samples to be of arbitrary (unequal) size.
The assumptions of the Wilcoxon rank–sum test are
independence of the two samples and independence
of observations within samples, and that the data are
comparable. These assumptions are true for our data
set. Our two samples are the activations given the bi-
nary property and the activations not given the binary
property. The two samples are independent from each
other and activations within samples are also indepen-
dent. They represent the same space, that of activa-
tions, hence they are comparable.
At each iteration we randomly sampled from the
two distributions with replacement before applying
the Wilcoxon rank–sum test. The resulting distribu-
tion of p–values was log–normal and we took the me-
dians of p–valuesas bootstrap statistics and used these
median p–values for subsequent analysis (Limpert
et al., 2001). As estimation of the bootstrap error, we
took the interquartile range of the sampled p–values.
We found that there was a very high and very signif-
icant Pearson correlation between error and p–values
(ρ = 0.77, p = 0.001). About 94% of points below
significance level 0.05 had an associated error below
0.1. We only took these points into account (in order
to exclude spurious results).
This method avoids the need to make assumptions
about the shape of the distribution, such as normal-
ity, and uses instead the observed distributions of our
data.
We say that points are coding for a (binary) prop-
erty if the null hypothesis could be rejected at the 5%
significance level.
For continuous properties the procedure was more
involved. We discretized properties by grouping their
values into bins, taking bin numbers as first guess
from Sturges’ formula (cf. (Wand, 1997)) then ad-
justing so that in each bin there were at least roughly
5% of activation maps. We then applied the procedure
with boostrap and Wilcoxon rank–sum test for differ-
ences between activations in response to property val-
ues in a particular bin versus activations in response
to values out of bin, i. e. testing whether points corre-
sponded to different ranges of the distribution of the
chemical property.
3.1.1 Size of Coding Zones
We investigated the sizes of the zones that coded for
properties. In order to determine the size of coding
zones for a property, we defined the size as the num-
ber of points that were found to be significantly dif-
ferent with respect to the property.
Skewed distributions for some properties could
have an impact on how many points are found to be
significantly related to a property. By the statistical
test it should be much more difficult for very skewed
distributions to pass the significance threshold. In this
paper, for size of coding zones, we take only into ac-
count 13 binary molecular properties, where at least
4 images were available. It is important to note that
for these properties, data availability (odorants corre-
sponding to presented odorant properties) and size of
coding zone show no significant Pearson correlation
(ρ = 0.33, p = 0.27).
RELEVANCE AND LOCI OF ODORANT FEATURES IN THE RAT OLFACTORY BULB - Statistical Methods for
Understanding Olfactory Codes in Glomerular Images
39

3.2 Classification
The method presented in this subsection is based
on the idea that classification performance between
glomerular activation and odorant features can give
information about this structure–activation relation-
ship. Specifically we take the classification per-
formance to compare relevances of properties to
glomerular coding. We performed classification us-
ing a linear support vector machine (SVM) from
glomerular activations as input vector and each prop-
erty (present vs. not present) as target. In each of 10
iterations we randomly sampled half of the activation
maps as training set and took the other half as test.
We distinguished between two experimental con-
ditions:
1. best points – classification using most representa-
tive points, and
2. random baseline – classification using randomly
sampled points.
For the first experimental condition, for each
property, we ranked points by their signifi-
cance with respect to the property (p–values
from Wilcoxon rank–sum test) and then clas-
sified taking the best n points, with n ∈ N =
[1, 5, 10, 15, 20, 25, 30, 45, 50, 60, 70, 80, 90, 100, 110,
120, 130, 140, 150, 200, 300, 400, 500, 600, 700, 800,
900, 1000, 1100, 1200, 1300, 1400, 1500, 1600, 1700,
1834]. As a random baseline, for each property,
we took the same intervals from N, but randomly
sampled points. We averaged over 250 random
subsamples of points for each interval.
The scarceness of data for some properties
brought about problems. We found that two com-
monly used SVM implementations, Svmlight and lib-
svm, are lacking robustness to tackle our problem.
Because of this we used an in–house SVM classifier
implemented in Matlab. We used the area under the
ROC curve (AUC) as performance criterion. It has
the advantage to be unbiased by skewed class distri-
butions, which are a particular problem in our data
set. An example of such an experimental run for the
aromatic property is shown in figure 3.
4 RESULTS
4.1 Localization of Coding Zones
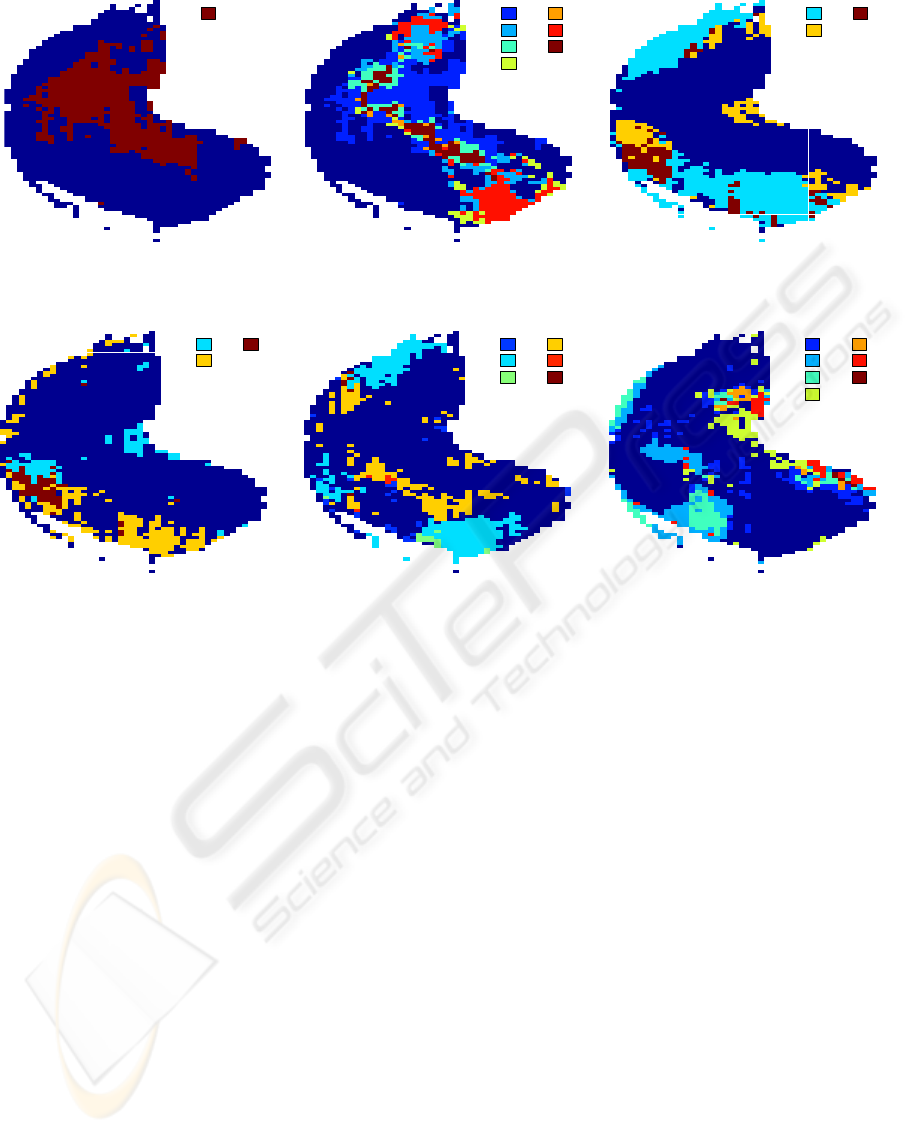
Figure 2 shows loci of coding zones for the 13 molec-
ular properties.
In figure 2(a), colors indicate where significant
differences with respect to alkane were found. This
subfigure is to illustrate results from the statistical de-
termination of coding zones for a single property.
For the other chemical properties displayed in fig-
ure 2 we grouped properties into molecular bonds, cy-
clization, and functional groups. We created a fac-
torial code so that the color code accounts for all
combinations of coding for properties. For n prop-
erties, numbers from 0 to n− 1 were assigned to each
property. For each point, a binary vector expresses
whether a property was found to significant or not.
The ith position in this vector stands for property i.
Each vector represents a subset of all possible combi-
nations b
prop
∈ { 0, 1}
n
. Each subset was assigned its
distinct color.
Colors in figures in 2 show all combinations of
properties that were encountered. To give an exam-
ple, in 2(b) there are seven kinds of zones that mark
codes for different combinations of properties alkane,
alkene, and alkyne. Zones 1, 2, and 4 code for ex-
clusively one of these properties. Zones 3 encodes
alkane and alkene, zone 5 alkane and alkyne, zone 6
alkene and alkyne, and finally zone 7 codes for all of
the three properties.
Cyclization properties, especially alicyclic, have
a moderate but highly significant Pearson correlation
(ρ = 0.33, p = 2.05e− 9 between alicyclic and poly-
cyclic, ρ = 0.36, p = 6.72e−11 between alicyclic and
heterocyclic, and ρ = 0.21, p = 1.95e − 04 between
aromatic and heterocyclic). As can be seen in 2(c) and
2(d), properties aromatic and heterocyclic and prop-
erties alicyclic and polycyclic, respectively, project to
very similar bulbar regions. Functional groups did not
have a high covariance, however there are many prop-
erties (6). To provide clearer figures, we split coding
zones of both, cyclization and functional groups into
two figures.
4.1.1 Size of Coding Zones
Table 1 shows size of coding zones as estimated.
From the table it can be seen that aromatic is broadly
coded by glomerular activations. Nearly 60% of
points were found to show differences significant at
the 5% level. Alkane covers the second biggest area
with about 40% of points. Carboxylic acid and ketone
are coded by about a third of all points. Coding zones
for properties alkene, alicyclic, and heterocyclic ex-
tend to between about 20 and 30%. For ester+lactone,
alkyne, and alcohol+phenol coding zones we mea-
sured between 10 and 16 percent of total. Properties
polycyclic, sulfur–containing compound and amine
recruit the smallest zones of compared properties with
about 7%, 4%, and 0.6%, respectively.
BIOSIGNALS 2010 - International Conference on Bio-inspired Systems and Signal Processing
40
1
(a) Alkane
1
2
3
4
5
6
7
(b) Molecular Bonds
1
2
3
(c) Cyclization I
1
2
3
(d) Cyclization II
1
2
3
4
5
6
(e) Functional Groups I
1
2
3
4
5
6
7
(f) Functional Groups II
Figure 2: Localization of Molecular Properties: Maps with coding zones for various odorant properties. Loci of the 13
binary properties, grouped into basic dimensions molecular bonds, cyclization, and functional groups. Colors in figures
serve to distinguish zones, which coded for a specific combination of several binary properties. For space efficiency legends
refer to numbers which are explained in this caption. Factorial maps for all properties of cyclization and functional groups,
respectively, were too crowded and therefore each were broken into two to be better intelligible. 2(a) shows the coding zone
for the alkane property as an demonstration of results of our statistical method of loci determination for a single property.
1 marks the coding zone for alkane. In 2(b), which represents molecular bond properties, the numbers stand for: 1 alkane
2 alkene 3 alkane, alkene 4 alkyne 5 alkane, alkyne 6 alkene, alkyne 7 alkane, alkene, alkyne. 2(c) shows 2 cyclization
properties. The number code is as follows: 1 aromatic 2 alicyclic 3 aromatic and alicyclic. 2(d) shows the other 2 cyclization
properties. The number code is as follows: 1 polycyclic 2 heterocyclic 3 polycyclic and heterocyclic. 2(e) highlights coding
zones for 3 functional group properties. The number code explained: 1 amine 2 ketone 3 amine and ketone 4 alcohol–phenol
5 amine and alcohol–phenol 6 ketone and alcohol–phenol. 2(f) details loci for the other 3 functional group properties. The
numbers: 1 ester+lactone 2 carboxylic acid 3 ester+lactone and carboxylic acid 4 sulfur-containing compound 5 ester+lactone
and sulfur-containing compound 6 carboxylic acid and sulfur-containing compound 7 ester+lactone, carboxylic acid and
sulfur-containing compound. Compare with table 1 where estimations of coding zone size are listed.
4.2 Classification
Here we present only results pertaining to 13 molecu-
lar properties, for which at least 4 images were avail-
able. It is important to note that Pearson correlation
between classification performance and availability of
data was low and very insignificant (ρ = 0.2, p = 0.5).
Table 2 ranks properties according to the classi-
fication performance (AUC) of the linear SVM. The
classification performance is indicated in the second
column.
Of the 13 compared properties, sulfur–containing
compound, akyne, alkane, alkene, and amine perform
close to ceiling. Classifications of carboxylic acid,
aromatic, and ketone also shows good performances.
Polycyclic, ester–lactone, the functional group alco-
hol+phenol, and cyclization properties heterocyclic
and alicyclic gives mediocre performances.
RELEVANCE AND LOCI OF ODORANT FEATURES IN THE RAT OLFACTORY BULB - Statistical Methods for
Understanding Olfactory Codes in Glomerular Images
41
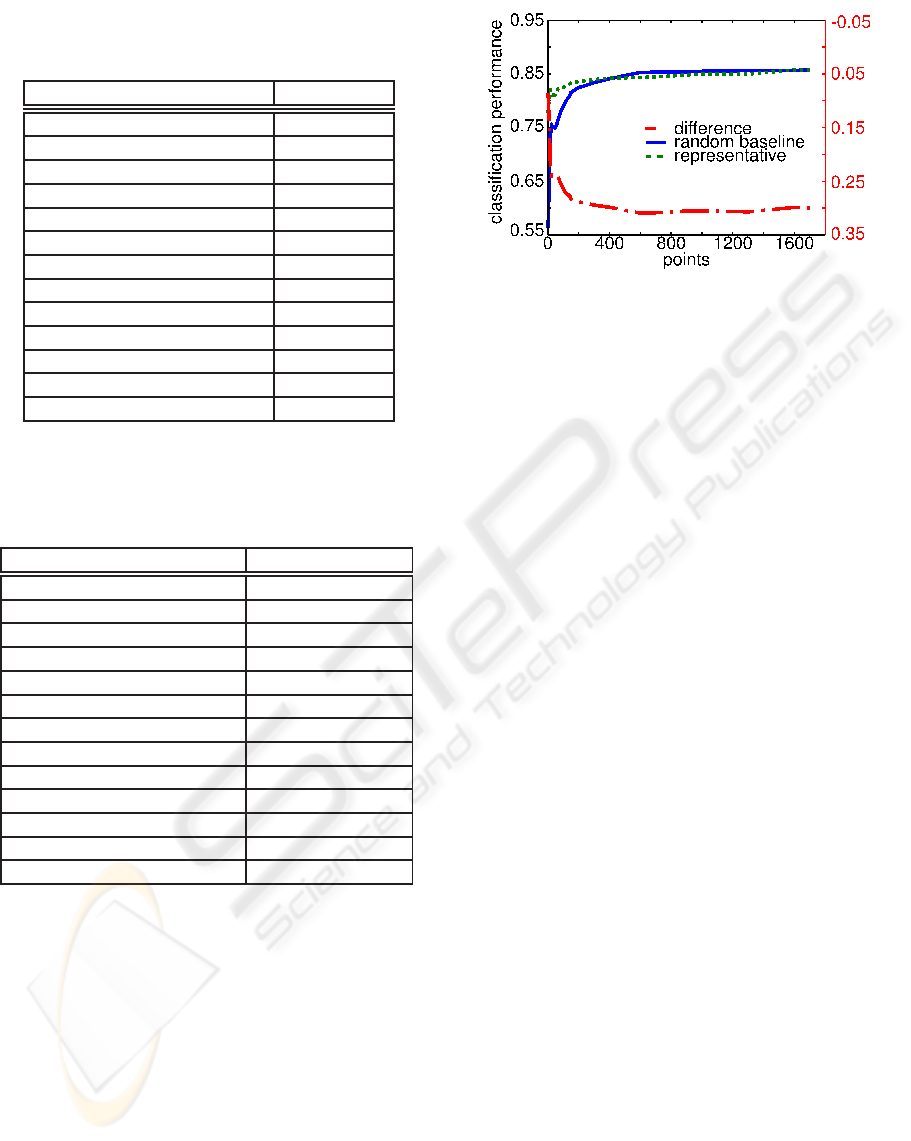
Table 1: Sizes of Coding Zones. The table shows for each
property the numbers of points found to be significantly cor-
related at 5% significance level.
property size of zone
aromatic 1070
alkane 717
carboxylic acid 646
ketone 459
alkene 424
alicyclic 399
heterocyclic 315
ester+lactone 296
alkyne 254
alcohol+phenol 204
polycyclic 125
sulfur-containing compound 76
amine 10
Table 2: Classification performance of odorant properties.
The second column shows the maximum classification per-
formance (in AUC) that was achieved in baseline or repre-
sentative conditions (whichever was best).
property max performance
sulfur–containing compound 0.99
alkyne 0.99
alkane 0.99
alkene 0.99
amine 0.99
carboxylic acid 0.93
aromatic 0.86
ketone 0.78
polycyclic 0.76
ester+lactone 0.75
alcohol+phenol 0.73
heterocyclic 0.73
alicyclic 0.72
5 DISCUSSION
5.1 Localization and Size of Coding
Zone
We confirmed that for certain properties coding sites
are clustered in zones. This could be the result of an
optimization for local processing of feature combina-
tions (Laughlin and Sejnowski, 2003). Figure 2 illus-
trates some of the properties pertaining to important
coding dimensions as proposed by Johnson and Leon
(Johnson and Leon, 2007). So far, our results of lo-
calization of properties seem to be in accordance with
Figure 3: Classification Performance for Aromatic Prop-
erty. The ordinate stands for the number of sampled points
for classification. Curves depict performance in AUC with
taking most representative points (solid line), randomly
sampled points (dashed line), and the difference between
the two (dash–dotted line).
literature.
As for the size of coding zone, it should be cau-
tioned that results should be interpreted more quali-
tatively than quantitatively. The thresholding of p–
values at certain significance values (here 5%) brings
with it that effects of concentration and relevance
cannot be completely separated from the size, how-
ever presented results can serve to group properties
roughly by their coding zones.
There seem to be very few results in the literature
on sizes of coding zones. Our results present a first
step into the direction of quantifying different aspects
of coding at the glomerular level. It seems there are
huge differences with respect of size of coding zone.
There are properties which recruit bigger zones and
properties that recruit smaller zones. This could indi-
cate that some properties are more specific with re-
spect to the bulbar zone. Some more implications
are discussed below together with the classification
results.
5.2 Classification
We take classification performance of a molecular
property to be indicative of its impact on early ol-
factory coding and — by implication — on percep-
tion. The logic behind is that properties that greatly
change activations at the olfactory bulb level are eas-
ier to classify. Knowing the relevance of molecular
properties could provide insight into early coding of
chemical information and provide vital clues for dis-
cerning which properties are functional in determin-
ing the degree of interaction between an odorant re-
ceptor and odorant molecules.
For some properties, the performance curve from
BIOSIGNALS 2010 - International Conference on Bio-inspired Systems and Signal Processing
42

representative points is below baseline at some inter-
vals (compare figure 3). We think this to be because of
the imperfect definition of most representative points.
We define relevance as the best classification perfor-
mance from either most representative points or ran-
dom baseline whichever was higher.
The performance of the classification of amine
found an early peak at 200 points, stayed at high lev-
els until 600 points before leveling offdrastically. The
early peak could be explained by a very small area
corresponding to amine (compare table 1) and in fact
activation maps for amine looked very different from
each other. Taking more points would not provide
more information, rather noise, to the classification.
We also think that the support vector machine had dif-
ficulties because of only very few data samples corre-
sponding to amine (4 of 308 maps).
Activations are very distinct with respect to
whether an odorant contained an sulfur–containing
functional group or not. Bond saturation indicative of
the reactionarity of compounds seems also to affect
coding very strongly, as we can see in the high per-
formance of alkyne, alkane, and alkene. Carboxylic
acid another functional group and aromatic, a cycliza-
tion property, still seemed to be quite important. So
far, our results confirm that cyclization, bond satura-
tion, and some functional groups are very important.
This is in line with Johnson and Leon (Johnson and
Leon, 2007), who proposed as important dimensions
of molecular properties cyclization, carbon numbers,
bond saturation, branching, functional groups, and
substitution position.
Our results can also be seen to partly confirm
Yoshida and Mori (Yoshida and Mori, 2007) who
proposed 14 primary odorant categories which could
serve to enhance category–profile selectivity. These
properties were sulfides, alcohols, methoxypyrazines,
6–carbon and 9–carbon green–odor compounds, alde-
hydes, ketones, isothiocyanates, terpene hydrocar-
bons, esters, terpene alcohols, alkylamines, acids, lac-
tones, and phenol and its derivatives. We found that
as for the properties included in this study, sulfides,
alcohols–phenol, ketones, ester–lactone, amines, per-
formance was quite good, however our results indi-
cate that other properties such as whether odorants
contained a carboxylic–acid group or their bond satu-
ration could also be very important.
6 CONCLUSIONS
The glomerular level of the olfactory bulb is the first
relay for olfactory processing in the brain. The infor-
mation from the glomerular level is factored in sec-
ondary structures with cortical downstream to give
the perception of odor. It has been confirmed that
glomerular activations determine to some degree per-
ceptual qualities of odorants (Cleland et al., 2002).
There has been lot of investigation about which prop-
erties have most impact on perception or representa-
tion in the olfactory bulb, but we are not aware of any
large–scale study to compare many different proper-
ties across a large data set. Our study is a first step
into this direction.
We present a method to investigate coding at the
glomerular level of the olfactory bulb and present re-
sults. Our method consisted of the application of the
Wilcoxon rank–sum test within a bootstrap wrapper
and the application of a support vector machine clas-
sification procedure.
By our statistical procedure we found coding
zones in clustered glomerulifor several properties and
the exact locations of coding zones. By extension
we estimated the size of coding zones and found that
investigated properties differed largely. The proper-
ties for which we found the smallest coding zones are
amine and sulfur–containingcompound, with roughly
0.5% and 4.1% of recruited area.
We then classified molecular properties by acti-
vation of glomerular activations in order to estimate
relevance of properties. Our classification results in-
dicate that there are some properties that affect odor
coding on the olfactory bulb level very strongly. Most
relevant properties we found to be alkyne, alkane,
alkene, and amine. From our study, it could be de-
rived the prediction that these properties have a very
strong impact on perception (at least in rats).
Larger coding zones could mean that properties
are broadly sensed by a range of olfactory receptors.
In turn, it can be conjectured that properties which
have a small coding zone in the olfactory bulb might
have a more direct correspondence to olfactory recep-
tor tuning. It could be hypothesized that properties
with small coding zones could be more directly re-
lated to the proposed odotopes, especially so, prop-
erties that have high relevance to coding. There are
other factors that influence size of coding zones, such
as lateral connections between glomeruli that compli-
cate matters, however – putting lateral connections
aside – from the results in tables 1 and 2, amine,
sulfur–containing compound, and alkyne could be
candidates for odotopes.
ACKNOWLEDGEMENTS
The authors thank Miquel Tarzan for implementing
a support vector machine that was robust enough to
RELEVANCE AND LOCI OF ODORANT FEATURES IN THE RAT OLFACTORY BULB - Statistical Methods for
Understanding Olfactory Codes in Glomerular Images
43

make the classification study possible. One of the au-
thors, B.A., is supported by a grant from the federal
state government of Catalonia (formaci´o de personal
investigador, FI).
REFERENCES
Axel, R. (1995). The molecular logic of smell. Sci Am,
273(4):154–9.
Bozza, T., Feinstein, P., Zheng, C., and Mombaerts, P.
(2002). Odorant Receptor Expression Defines Func-
tional Units in the Mouse Olfactory System. Journal
of Neuroscience, 22(8):3033–43.
Buck, L. and Axel, R. (1991). A novel multigene family
may encode odorant receptors: a molecular basis for
odor recognition. Cell, 65(1):175–187.
Cleland, T., Morse, A., Yue, E., and Linster, C. (2002). Be-
havioral models of odor similarity. Behavioral neuro-
science, 116(2):222–231.
Efron, B. (1982). The Jackknife, the Bootstrap and other re-
sampling plans. In CBMS-NSF Regional Conference
Series in Applied Mathematics, Philadelphia: Society
for Industrial and Applied Mathematics (SIAM), 1982.
Felsenstein, J. (1985). Confidence limits on phylogenies: an
approach using the bootstrap. Evolution, pages 783–
791.
Johnson, B., Xu, Z., Pancoast, P., Kwok, J., Ong, J.,
and Leon, M. (2006). Differential specificity in the
glomerular response profiles for alicyclic, bicyclic and
heterocyclic odorants. The Journal of comparative
neurology, 499(1):1–16.
Johnson, B. A., Arguello, S., and Leon, M. (2007).
Odorants with multiple oxygen-containing functional
groups and other odorants with high water solu-
bility preferentially activate posterior olfactory bulb
glomeruli. Journal of Comparative Neurology,
502(3):468–482.
Johnson, B. A. and Leon, M. (2000). Odorant molecular
length: One aspect of the olfactory code. Journal of
Comparative Neurology, 426(2):330–338.
Johnson, B. A. and Leon, M. (2007). Chemotopic odorant
coding in a mammalian olfactory system. Journal of
Comparative Neurology, 503:1–34.
Johnson, B. A., Woo, C. C., Hingco, E. E., Pham, K. L., and
Leon, M. (1999). Multidimensional chemotopic re-
sponses to n-aliphatic acid odorants in the rat olfactory
bulb. Journal of Comparative Neurology, 409(4):529–
548.
Johnson, B. A., Woo, C. C., and Leon, M. (1998). Spatial
coding of odorant features in the glomerular layer of
the rat olfactory bulb. Journal of Comparative Neu-
rology, 393(4):457–471.
Laughlin, S. and Sejnowski, T. (2003). Communication in
neuronal networks. Science, 301(5641):1870–1874.
Limpert, E., Stahel, W., and Abbt, M. (2001). Log-normal
distributions across the sciences: keys and clues. Bio-
science, 51(5):341–352.
Malnic, B., Hirono, J., Sato, T., and Buck, L. (1999). com-
binatorial receptor codes for odors. Cell, 96(5):713–
723.
Mori, K. and Shepherd, G. (1994). Emerging principles of
molecular signal processing by mitral/tufted cells in
the olfactory bulb. Semin Cell Biol, 5(1):65–74.
Mori, K., Takahashi, Y., Igarashi, K., and Yamaguchi, M.
(2006). Maps of odorant molecular features in the
mammalian olfactory bulb. Physiological reviews,
86(2):409–433.
Sell, C. (2006). On the unpredictability of odor. Ange-
wandte Chemie International Edition, 45(38):6254–
6261.
Uchida, N., Takahashi, Y., Tanifuji, M., and Mori, K.
(2000). Odor maps in the mammalian olfactory bulb:
domain organization and odorant structural features.
Nature Neuroscience, 3:1035–1043.
Wand, M. P. (1997). Data-based choice of histogram bin
width. The American Statistician, 51(1):59–64.
Yoshida, I. and Mori, K. (2007). Odorant Category Profile
Selectivity of Olfactory Cortex Neurons. Journal of
Neuroscience, 27(34):9105–9114.
BIOSIGNALS 2010 - International Conference on Bio-inspired Systems and Signal Processing
44
