
STUDY OF EFFECTIVE CONNECTIVITY FOR FACE
PERCEPTION IN HEALTHY SUBJECTS AND PARKINSON'S
DISEASE
Elvis Lira da Silva
1,4
, Gabriela Castellano
1,4
, João Ricardo Sato
2,3,4
Ellison Fernando Cardoso
2,4
and Edson Amaro Jr.
2,4
1
Institute of Physics “Gleb Wataghin”, University of Campinas - UNICAMP, Campinas, Brazil
2
NIF, LIM-44, Department of Radiology, University of São Paulo, São Paulo, Brazil
3
Center of Mathematics, Computation and Cognition, Universidade Federal do ABC, Santo André, Brazil
4
CInAPCe Program (Cooperação Interinstitucional de Apoio a Pesquisas sobre o Cérebro), São Paulo, Brazil
Keywords: Dynamic Causal modelling, fMRI, Connectivity, Parkinson’s disease, Face perception.
Abstract: Facial perception is a fundamental task in our daily life and plays a critical role in social interactions.
Evidence from neuropsychological, neurophysiologic, and functional imaging studies indicated that face
perception is mediated by a specialized system in the human brain. We investigated the neural connectivity
induced by face presentation with different emotional valences in Parkinson's disease (PD) patients and a
control group of healthy, drug-free volunteers, using event-related fMRI in a parametric design. In this
study, we focused on applying Dynamic Causal Modelling (DCM), an approach that allows the assessment
of effective connectivity within cortical networks (Friston et al. 2003), to the study of effective connectivity
between maximally activated brain regions in response to passive viewing of facial stimuli. A connectivity
model was built based on the literature and in our fMRI analyses, which included the fusiform gyrus,
anterior cingulate gyrus, dorsolateral prefrontal cortex (DLPFC) and dorsomedial prefrontal cortex
(DMPFC). The results showed differences in connectivity between the PD group and the control group. We
found that the effective couplings among DLPFC/DMPFC and FG, DLPFC/DMPFC and ACG, were higher
in PD patients than healthy subjects, while the effective coupling among FG and ACG was lower in PD
patients.
1 INTRODUCTION
The branch of Neuroscience that studies functional
integration between cerebral areas has recently
shown a significant growth. Functional integration
refers to the interactions among specialized neuronal
populations, where the integration is mediated by the
so called effective connectivity. Effective
connectivity is defined as the influence that regions,
which encompass given neuronal populations, exert
on each other. It is important to study the effective
connectivity to know how different areas, involved
in a particular brain processing task, are related.
Facial perception is one of the fundamental tasks
in our daily life and plays a critical role in social
interactions. It is a highly developed visual ability in
humans and it is mediated by activation in a
distributed neural system that encompasses visual,
limbic, and prefrontal regions (Fairhall and Ishai,
2007; Haxby et al., 2000). Facial perception with
different emotional valences involves the emotional
recognition that is related to the activity of
amygdala, insula, orbitofrontal cortex and ventral
striatum. The areas linked to emotional regulation
include the anterior cingulate, dorsolateral and
medial prefrontal cortices (Phillips et al., 2003a, b).
In this study we investigated the effective
connectivity induced by face presentation with
different emotional valences in Parkinson's disease
(PD) patients and a control group of healthy, drug-
free volunteers. Depression is the most common
psychiatric disease in patients with Parkinson’s
disease (PD) (Cardoso et al., 2007). Although
several studies have been performed to investigate
the pathophysiology of depression in PD, many
questions remain unanswered.
88
Lira da Silva E., Castellano G., Ricardo Sato J., Fernando Cardoso E. and Amaro Jr. E. (2010).
STUDY OF EFFECTIVE CONNECTIVITY FOR FACE PERCEPTION IN HEALTHY SUBJECTS AND PARKINSON’S DISEASE.
In Proceedings of the Third International Conference on Bio-inspired Systems and Signal Processing, pages 88-93
DOI: 10.5220/0002743800880093
Copyright
c
SciTePress
To investigate effective connectivity within the
distributed cortical network for face perception, we
combined conventional Statistical Parametric
Mapping (SPM) and the technique of Dynamic
Causal Modelling (DCM) (Friston et al., 2003).
DCM consists of a theoretical-experimental
approach that treats the brain as a nonlinear
deterministic dynamic system. DCM regards an
experiment of fMRI as a designed perturbation of
neuronal dynamics that is distributed throughout a
system of coupled anatomical nodes to change
region-specific neuronal activity (Friston et al.,
2003). In practical terms, a reasonably realistic
neuronal model of interacting cortical regions is
built, with neuro-physiologically meaningful
parameters. This model is supplemented with a
forward model of how neuronal or synaptic activity
is transformed into a measured response, and the
parameters of this model can be estimated by
attempting to match the predicted BOLD signal to
the observed BOLD signal.
DCM has been previously used to investigate
visual perception and visual imagery of faces
(Mechelli et al., 2004) and face perception in healthy
subjects (Fairhall and Ishai, 2007; Rotshtein et
al.2007).
2 METHODS
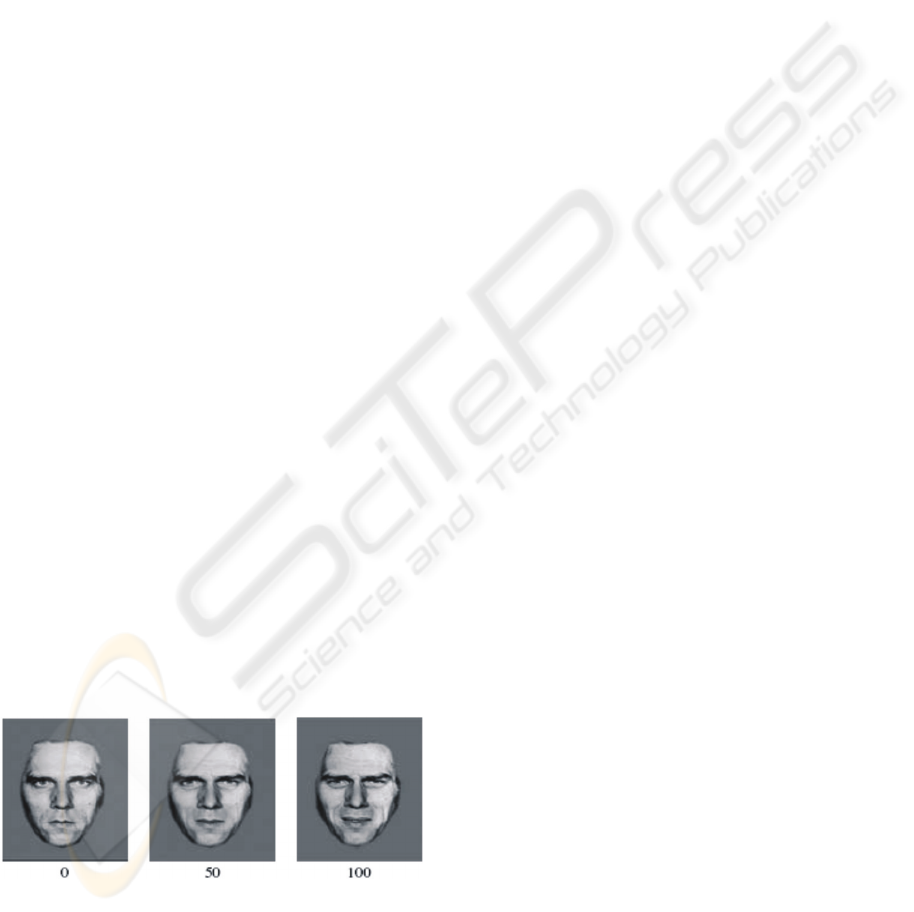
Eckmann’s faces were morphed to produce neutral,
low and high intensities of sadness, as shown in
Figure 1. An event-related fMRI paradigm, similar
to Fu et al. (2004) was used. Facial stimuli and
baseline trials (crosshair fixation) were presented in
random order. Each trial and control condition was
presented for 2 s, and the inter-trial interval was
randomly varied according to a Poisson distribution
(2–12 s; mean 5 s). All images were acquired in a
1.5 T GE scanner, equipped with a 33 mT/m gradient.
Figure 1: An example of stimuli set used. Eckmann’s faces
were morphed to produce neutral, low and high intensities
of sadness. Facial stimuli and baseline trials (crosshair
fixation) were presented in random order in the event
related fMRI paradigm.
The images were oriented according to the AC–PC
line; and 168 brain volumes were acquired, with 15
slices each (7 mm thickness, 0.7 gap), 64×64 pixels
matrix, 20×20 mm FOV, 90° flip angle, 2.0 s TR, 40
ms TE, using a gradient echo EPI acquisition.
The fMRI statistical and DCM analyses were
performed using the free software Statistical
Parametric Mapping (SPM8, www.fil.ion.ucl.ac.uk
/spm/). All volumes were slice time corrected,
realigned to the middle volume, corrected for motion
artifacts, mean-adjusted by proportional scaling,
normalized into standard stereotactic space (template
provided by SPM8), and smoothed using a 8 mm
full-width at half-maximum (FWHM) Gaussian
kernel. The time series were high-pass filtered to
eliminate low-frequency components (filter width =
128 s) and adjusted for systematic differences across
trials.
DCM is constructed by a bilinear approximation
that allows the dynamics of the system to depend on
three groups of parameters: parameters that mediate
intrinsic coupling among the areas, parameters that
mediate the influence of extrinsic inputs on the areas
and (bilinear) parameters that allow the extrinsic
inputs to modulate that coupling (Friston et al.,
2003). The model depends on the experimental
design, where the extrinsic inputs enter the model by
two ways: directly influencing the areas (driving
inputs) and/or influencing the coupling among the
areas (contextual inputs).
All patients were recruited from the Movement
Disorders Clinics of Hospital das Clínicas –
University of São Paulo (São Paulo – Brazil) and all
gave written informed consent. The study was
approved by the ethics committee of the University
of São Paulo (Project Approval number: 414/03).
2.1 Effective Connectivity Analysis
We studied 19 healthy subjects and 17 patients with
Parkinson’s disease. Initially, fMRI was used for
locating brain responses to the experimental task
(face perception with different emotional valences).
Individual maps of activations were generated using
voxel based analysis. Next, second-level analysis
was used to generate maps of the group using one
sample t-test, with corrected (FWE) p-value < 0.05.
Based on our analysis of the healthy group data and
on the works of Phillips et al. (2003a,b), we
determined which areas should enter in the model of
DCM. The model included 3 areas: left and right
Fusiform Gyri (FG), Anterior Cingulate Gyrus
(ACG), and Dorsolateral Prefrontal Cortex (DLPFC)
STUDY OF EFFECTIVE CONNECTIVITY FOR FACE PERCEPTION IN HEALTHY SUBJECTS AND
PARKINSON'S DISEASE
89
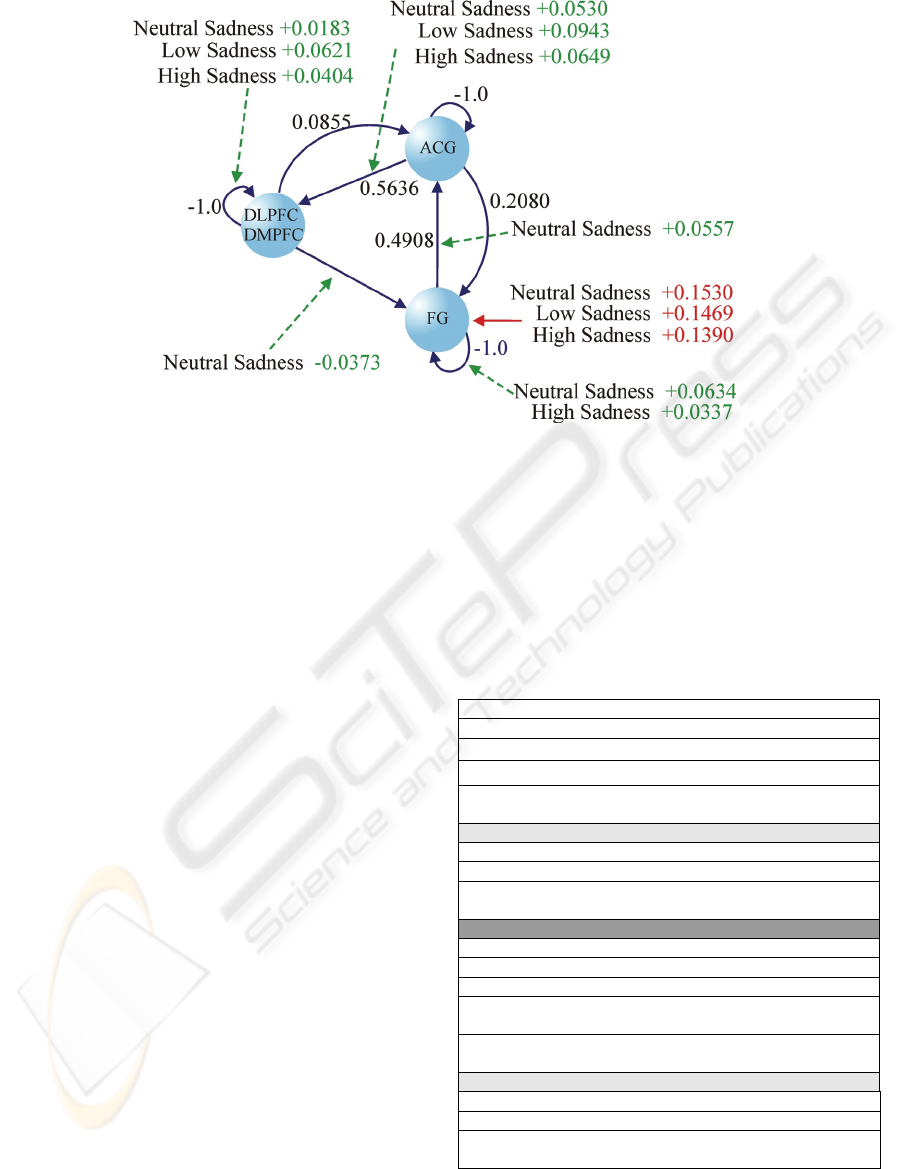
Figure 2: DCM results for healthy subjects. Black arrows (and values) are the results of intrinsic connections, green arrows
(and values) are the results of modulatory connections, and red arrows (and values) are the results of direct influence of the
stimuli on the FG area.
/ Dorsomedial Prefrontal Cortex (DMPFC). These
regions of interest (ROIs) were defined using masks
created with the WFU Pickatlas software (Maldjian
et al., 2003 and Maldjian et al.,2004).
After delimiting the brain areas aforementioned
in the individual brain activation map, time series of
voxels limited by a sphere of 8 mm were extracted.
These spheres were located in the local maxima of
the activation map for each anatomical area included
on the model. This procedure was performed for
each of the subjects. These three volumes of interest
(VOIs) were identified for each individual subject.
Mean localization and t-values of these areas are
shown in Table 1 for healthy subjects and PD
patients. All three VOIs were reliably delineated in
16 of the 19 healthy subjects and 10 of the 17 PD
patients (Table 1) (p < 0.05, uncorrected).
Initially the DCM model was estimated
separately for each subject. In order to generalize
our results to the population level, the estimated
connection strengths from that analysis were then
subjected to a second-level analysis (using Matlab
functions) where the significance of inferred
connections was tested using one-sample t-tests
against the null hypothesis that the connection
strength is equal to zero.
Table 1: Regions of the DCM model for healthy subjects
and PD patients. The x, y, z, columns give the average
coordinates across all subjects for the location of each
region (with the standard deviation – SD – in parentheses).
The T column shows the average T-statistics across
subjects in the first-level analysis (and the SD in
parentheses). “L” and “R” mean Left and Right,
respectively.
Healthy subjects
Regions x y z T
FG (R) 31.3(7.1) -59.5(6.9) -18.4(3.1) 4.0(1.5)
ACG (R) 3.7(4.0) 14.2(9.9) 20(16,9) 2.53(0.8)
DMPFC/
DLPFC(R)
21.8(13.8) 19.3(14.7) 56(18) 4.6(1.5)
FG (L) -31.3(7.9) -58(14.4) -20(4.9) 3.8(1.1)
ACG (L) -7(2) 22.3(8.2) 8.3(14.9) 2.5(0.5)
DMPFC/
DLPFC(L)
-30.1(13.1) -2.5(8.7) 63.2(8.7) 4.0(1.4)
PD patients
Regions x y z T
FG (R) 30(8.6) 48.6(16.5) -21.1(7.9) 4.1(1.2)
ACG (R) 5.2(3.2) 20.3(5.6)
28.1(12,8
)
2.9(0.6)
DMPFC/
DLPFC(R)
17(15.2) 9.0(8.3)
59.7(13,3
)
4.1(1.0)
FG(L) -22(0) -67.5(10.6) -16.0(0) 4.9(1.2)
ACG (L) -11(0) 26.0(0) 28.0(0) 2.9(0)
DMPFC/
DLPFC(L)
-32(2.8) -3.5(10.6) 63.0(4.2) 4.3(0.7)
BIOSIGNALS 2010 - International Conference on Bio-inspired Systems and Signal Processing
90
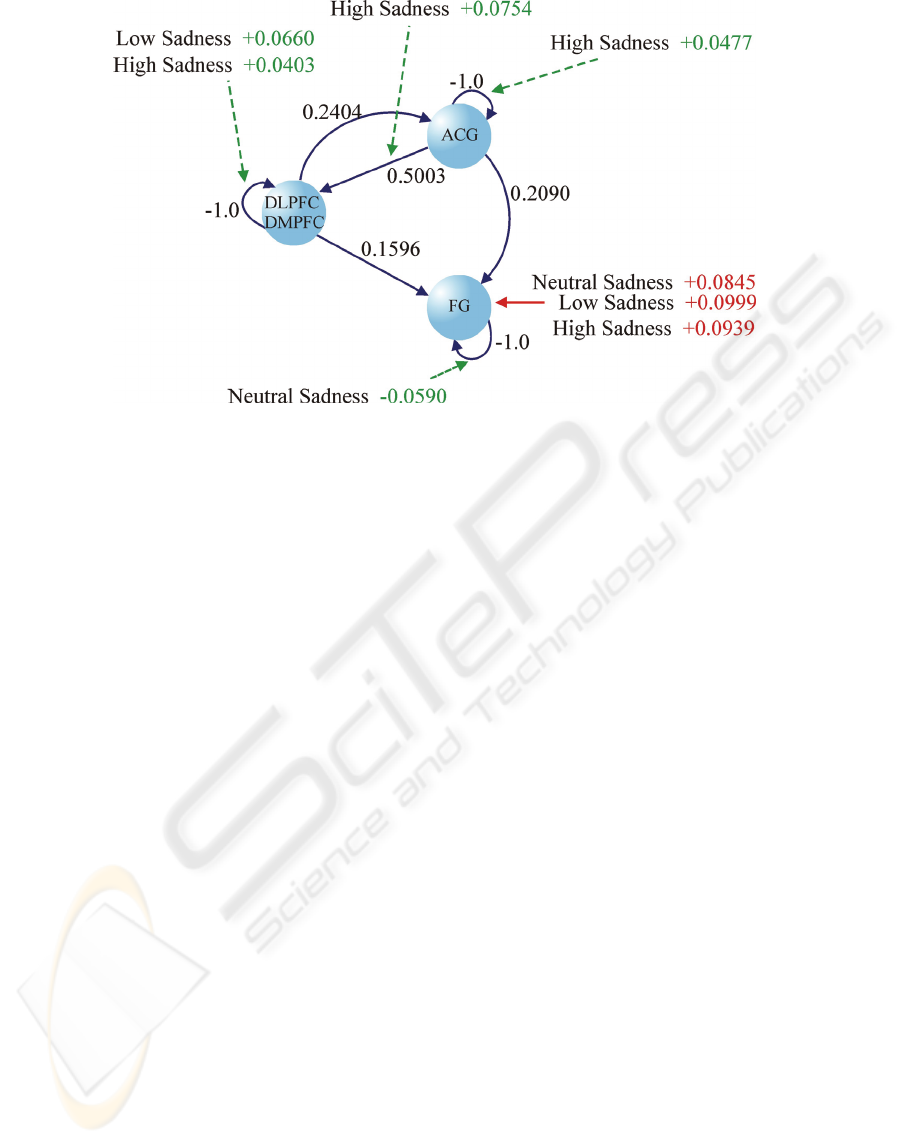
Figure 3: DCM results for PD patients. Black, green and red arrows represent the same as for Figure 2.
3 RESULTS
We found that emotion perception and recognition in
faces involve activity in the FG, ACG, DLPFC and
DMPFC brain areas. The activation of these areas
was found through the fMRI analysis. A model that
connects the different areas was defined; taking into
account the FG, ACG and prefrontal cortex regions.
As a first model we admitted that all regions
interacted with one another; and that the face stimuli
entered the model as driving inputs on FG only. The
face stimuli also entered the model as contextual
factors on all connections. From this model, the
intrinsic connections between each of the
components of the model were estimated using a
DCM analysis.
The results of the groups are shown in Figure 2,
for healthy subjects, and Figure 3, for PD patients.
Only connections that were significant (non-zero
mean) after the one-sample t-test (p < 0.05) are
shown. Black arrows (and values) are the results of
intrinsic connections, which do not depend on
external stimuli. Green arrows (and values) are the
results of modulatory connections given by
contextual inputs; these values increase or decrease
the influence of the intrinsic connections and depend
on the external stimulus. Red arrows (and values)
are results of direct influence of stimuli on the areas.
Values are shown when significant (one-sample t-
test) for each of the experimental conditions
(neutral, low and high sadness).
In principle we can see, in control subjects
(Figure 2), an increase in activity in the FG areas
induced by modulation of connectivity by neutral
and high sadness faces (FG → FG connection) and
in the DLPFC/DMPFC areas induced by modulation
of connectivity by all faces (DLPFC / DMPFC →
DLPFC / DMPFC and ACG → DLPFC / DMPFC
connections).
Neutral faces increase activity in ACG areas (FG
→ ACG connection) and decrease activity in FG
(DLPFC / DMPFC → FG connection).
For PD patients (Figure 3), we can notice an
increase in activity in the DLPFC and DMPFC areas
induced by the modulation of connectivity by low
sadness (DLPFC/DMPFC → DLPFC/DMPFC
connection) and high sadness faces (DLPFC/
DMPFC → DLPFC/DMPFC and ACG →
DLPFC/DMPFC connections). We can also see an
increase in activity in the ACG areas induced by the
modulation of connectivity by high sadness faces
(ACG → ACG connection). In addition, we see a
decrease in activity of the FG area induced by the
modulation of connectivity by neutral faces (FG →
FG).
Using a two-sample t-test (through Matlab
functions) we compared the connections of the two
groups (healthy and PD) and found a significant
difference among the intrinsic connections (black
lines in Figures 2 and 3) DLPFC/DMPFC → ACG
(p-value of 0.0345), DLPFC/DMPFC → FG (p-
value of 0.0303) and FG → ACG (p-value of
0.0487).
We found that the effective coupling
DLPFC/DMPFC → ACG and DLPFC/DMPFC →
ACG were higher in PD patients than in healthy
subjects, while the effective coupling FG → ACG
was lower in PD patients. The results are shown in
Table 2.
STUDY OF EFFECTIVE CONNECTIVITY FOR FACE PERCEPTION IN HEALTHY SUBJECTS AND
PARKINSON'S DISEASE
91

To compare the connectivity patterns between
the stimuli of high sad and neutral faces, we used a
paired t-test among these conditions within each
group (PD patients and controls), for every
connection (intrinsic, modulatory and direct
influence) in every region. We found a significant
difference between the connectivity for these two
conditions in healthy subjects. The connectivity for
the sad faces stimulus has greater modulation by
prefrontal areas in the ACG and FG, which is in
agreement to the article by Philips et al. (Phillips et
al., 2003a). According to Phillips et al., the
prefrontal areas are responsible for the regulation of
the emotional state and the perception of emotion.
Therefore, we may conclude that in healthy subjects,
the prefrontal area regulated the emotional state due
to the presentation of the sad faces stimulus. On the
other hand, we did not observe this difference in the
group of Parkinson's disease patients: the t-test did
not show significant differences in connectivity
between the different face conditions. In fact, many
studies (Assogna et al. 2008; Dujardin et al 2004;
Sprengelmeyer et al. 2003) have described the
disability that Parkinson's patients have for the
recognition and perception of emotion, suggesting
that the decline in dopaminergic nigrostriatal leads
not only to motor disorders but also to a deficit in
processing facial emotions. This suggests that the
connection between the prefrontal cortex areas and
the other areas of the model is affected by
Parkinson’s disease, and causes this deficit in
processing emotions.
Results about the comparison between different
conditions for healthy subjects and PD patients are
shown in Table 3. For clarity only the results for the
comparison between the neutral and high sadness
conditions are shown. The connection FG →
DLPFC (intrinsic and modulatory) is not shown in
the table because it was not included in the model.
4 CONCLUSIONS
Using DCM, we explored the effective connectivity
of the main cerebral regions involved in responses to
facial stimuli with different intensities of sadness,
for both PD patients and healthy subjects. The
results showed differences in connectivity between
the PD group and the control group, suggesting that
these changes in connectivity can play an important
role in Parkinson's disease and may thus provide
insights on the underlying mechanisms of PD.
Table 2: Comparison between healthy subjects and PD
patients connections. Significant differences are marked
with bold-face. Connections marked with asterisk are
higher in PD patients than healthy subjects.
Comparison between groups
Connections
Healthy
Subjects
PD
Patients
P-value
Intrinsic Connections
FG→FG -1.000 -1.000 -
FG→ACG 0.4908 0.2620 0.0487
ACG→FG 0.2080 0.2090 0.9850
ACG→ACG -1.000 -1.000 -
ACG→DLPFC 0.5636 0.5003 0.6691
DLPFC→FG 0.0361 0.1596 0.0303*
DLPFC→ACG 0.0855 0.2404 0.0345*
DLPFC→DLPFC -1.000 -1.000 -
Modulatory Connections (Neutral)
FG→FG 0.0587
0.0590 0.9896
FG→ACG 0.0557
-0.0820 0.0047
ACG→FG -0.0059
0.0017 0.6207
ACG→ACG 0.0014
0.0404 0.1135
ACG→DLPFC 0.0530
0.0390 0.6259
DLPFC→FG -0.0373
0.0128 0.0345*
DLPFC→ACG -0.0300
-0.0055 0.3046
DLPFC→DLPFC 0.0183
0.0261 0.6131
Modulatory Connections (Low Sadness)
FG→FG
-0.0192 0.0180 0.2513
FG→ACG
0.0102 0.0236 0.7676
FG → DLPFC
ACG→FG
-0.0245 -0.0010 0.3873
ACG→ACG
0.0042 0.0387 0.1190
ACG→DLPFC
0.0943 0.0671 0.5274
DLPFC→FG
-0.0246 0.0239 0.0324*
DLPFC→ACG
-0.0024 0.0011 0.8531
DLPFC→DLPF
C
0.0621 0.0660 0.8996
Modulatory Connections (High Sadness)
FG→FG
0.0337 0.0234 0.6424
FG→ACG
0.0047 0.0076 0.9513
ACG→FG
0.0226 0.0111 0.5818
ACG→ACG
0.0087 0.0477 0.0344*
ACG→DLPFC
0.0649 0.0754 0.7691
DLPFC→FG
0.0179 0.0068 0.6267
DLPFC→ACG
0.0061 0.0095 0.8716
DLPFC→DLPF
C
0.0404 0.0403 0.9974
Extrinsic Connections
Stimulus → FG (All others connections not included in
the model)
Neutral
0.1530 0.0845 0.0330
Low Sadness
0.1469 0.0999 0.2165
High Sadness
0.1390 0.0939 0.2400
BIOSIGNALS 2010 - International Conference on Bio-inspired Systems and Signal Processing
92

However, as the success of DCM is dependent on
the experimental design and on the specified
interacting regions model, other models involving
those regions should be tested for a more definitive
conclusion.
Table 3: Comparison between the neutral and high sadness
faces conditions, for healthy subjects and PD patients
connections. Significant differences are marked with bold-
face. Connections marked with asterisk are higher in the
high sadness than in the neutral condition. Healthy
subjects show many more significant differences between
high sadness and neutral faces than PD patients.
REFERENCES
Assogna F. , Pontieri F., Caltagirone C., Spalletta G. 2008.
The recognition of facial emotion expressions in
Parkinson's disease. European
Neuropsychopharmacology 18, 835–848.
Dujardin K., Blairy S., Defebvre L.,, Duhemb S., Noël Y,
Hess U., Destée A. 2004. Deficits in decoding
emotional facial expressions in Parkinson’s disease.
Neuropsychologia 42, 239–250
Cardoso, E., Fregni F., Maia F., Boggio, P., Myczkowski,
M., Coracini K., Vieira A., Melo L., Sato, J., Marcolin
M., Rigonatti S., Cruz A.,Barbosa, E. and Amaro, E.,
2007. rTMS treatment for depression in Parkinson’s
disease increases BOLD responses in the left refrontal
cortex. International Journal of
Neuropsychopharmacology, 11(2), 173 – 183.
Fairhall, S. and Ishai, A., 2007. Effective Connectivity
within the Distributed Cortical Network for Face
Perception. Cerebral Cortex, 17(10), 2400–2406.
Friston, K., Harrison, L., Penny, W., 2003. Dynamic
causal modeling. NeuroImage 19, 1273– 1302.
Fu C., Williams S., Cleare A., Brammer M., Walsh N.,
Kim J., Andrew C., Pich E., Williams P., Reed L., et
al. 2004. Attenuation of the neural response to sad
faces in major depression by antidepressant treatment:
a prospective, event-related functional magnetic
resonance imaging study. Archives of General
Psychiatry 61, 877–889
Haxby, J., Hoffman, E., Gobbini, M., 2000. The
distributed human neural system for face perception.
Trends in Cognitive Sciences, 4(6), 223–233.
Mechelli A., Price C., Friston K., Ishai A., 2004. Where
bottom-up meets top-down: neuronal interactions
during perception and imagery. Cerebral Cortex. 14,
1256-1265.
Maldjian, J., Laurienti, P., Burdette, J., Kraft, R., 2003. An
Automated Method for Neuroanatomic and
Cytoarchitectonic Atlas-based Interrogation of fMRI
Data Sets. NeuroImage, 19, 1233-1239.
Maldjian, J., Laurienti, P., Burdette, J., 2004. Precentral
Gyrus Discrepancy in Electronic Versions of the
Talairach Atlas. Neuroimage, 21(1), 450-455.
Phillips M., Drevets W., Rauch S., Lane R., 2003a.
Neurobiology of emotion perception I: The neural
basis of normal emotion perception. Biological
Psychiatry 54, 504–514.
Phillips M., Drevets W., Rauch S., Lane R., 2003b.
Neurobiology of emotion perception II: Implications
for major psychiatric disorders. Biological Psychiatry
54, 515–528.
Rotshtein P., Vuilleumier P., Winston J., Driver J., Dolan
R., 2007. Distinct and convergent visual processing of
high and low spatial frequency information in faces.
Cerebral Cortex 17, 2713–2724.
Sprengelmeyer R., Young A., Mahna K., Schroeder U. ,
Woitalla D., Büttner T. , Kuhn W. , Przuntek H. 2003.
Facial expression recognition in people with
medicated and unmedicated Parkinson’s disease.
Neuropsychologia 41, 1047–1057.
Healthy Subjects
(Comparison between conditions)
Modulatory Connections
Connections Neutral
High
Sadness
P-value
FG→FG 0.0587
0.0337
0.2430
FG→ACG 0.0557
0.0047
0.1149
ACG→FG -0.0059
0.0226
0.0459*
ACG→ACG 0.0014
0.0087
0.6311
ACG→DLPFC 0.0530
0.0649
0.5454
DLPFC→FG -0.0373
0.0179
0.0100*
DLPFC→ACG -0.0300
0.0061
0.0346*
DLPFC→DLPFC 0.0183
0.0404
0.0470*
Extrinsic Connections
Stimulus → FG
(All others
extrinsic
connections were
not included in the
model)
Neutral
High
Sadnes
s
P-value
0.1530 0.1390 0.0414
PD Patients
(Comparison between conditions)
Modulatory Connections
Neutral
High
Sadnes
s
P-value
FG→FG
0.0590 0.0234 0.1538
FG→ACG
-0.0820 0.0076 0.0427*
ACG→FG
0.0017 0.0111 0.5809
ACG→ACG
0.0404 0.0477 0.7515
ACG→DLPFC
0.0390 0.0754 0.2473
DLPFC→FG
0.0128 0.0068 0.7276
DLPFC→ACG
-0.0055 0.0095 0.6463
DLPFC→DLPFC
0.0261 0.0403 0.5526
Extrinsic Connections
Stimulus →FG
(All others
extrinsic
connections were
not included in the
model)
Neutral
High
Sadnes
s
P-value
0.0845 0.0939 0.4041
STUDY OF EFFECTIVE CONNECTIVITY FOR FACE PERCEPTION IN HEALTHY SUBJECTS AND
PARKINSON'S DISEASE
93
