
SIMULATION BASED LEARNING ABOUT COMPLEX
MANAGEMENT SYSTEMS
A Simulation Experiment
Mirjana Kljajić Borštnar, Vladislav Rajkovič, Miroljub Kljajić, Andrej Škraba and Davorin Kofjač
University of Maribor, Faculty of Organizational Sciences, Kidričeva 55a, 4000 Kranj, Slovenia
Keywords: Learning, Computer Simulation, Group Information Feedback.
Abstract: This paper describes experiences in teaching of a Modelling and simulation course at the Faculty of
Organizational Sciences. The course consists of continuous simulation based on System Dynamics (SD) and
discrete event simulation (DES). When enrolling the course the students have already taken courses of
Mathematics, Statistics, Systems Theory, as well as Organization and Economics. The final grade of the
course is derived from the student’s project and written exam. Attendance at lectures is not obligatory; only
the practical exercises are. In this paper, we will discuss the methods of teaching SD by using the classical
approach of teaching, and by the application of a business simulator. Therefore, we have developed the
simulation model in order to explicate the usefulness of the simulation in solving management problems.
Students took part in the experiment with the simulation model; the obtained results were analyzed
afterward in the students’ projects. After the experiment, students had to complete a questionnaire on their
opinion of the course. The results show that students taking the course of Modelling and Simulation thought
that application of the simulation model contribute to a better problem understanding, faster problem
solving and greater confidence of participants.
1 INTRODUCTION
The role of simulation methodology in the decision
assessment of complex systems is constantly
increasing. Human knowledge, the simulation model
and decision methodology combined in an integral
information system offer a new standard of quality
in management problem solving (Simon, 1997). The
simulation model is used as an explanatory tool for a
better understanding of the decision process and/or
for learning processes in enterprises and in schools.
Many successful businesses intensively use
simulation as a tool for operational and strategic
planning as well as enterprise resource planning
(ERP) (Schniederjans and Kim, 2003; Muscatello et.
al, 2003). Findings in literature (Forrester, 1969;
Homer, 1996) emphasize that in a variety of
industries real problems can be solved with
computer simulation for different purposes and
conditions. At the same time, potential problems can
be avoided and operative and strategic business
plans may also be tested. Although there is a
considerable amount of work devoted to simulation
methodology, its application is lacking in practice;
especially in small- and mid-sized companies. The
reason lies not in the methodology itself; the real
reason is in the problems of methodology transfer to
enterprises and the subjective nature of decision-
making. However, there are several problems, both
objective and subjective, that are the reason this
well-established methodology is not used more
frequently.
One of the objective problems is model
validation, which is very important for any model-
based methodology. The validity of the model of a
given problem is related to the soundness of the
results and its transparency for users. According to
Coyle (1996), a valid model is one that is well-suited
to a purpose and soundly constructed. The second
problem, the subjective one, is related to the
transparency of the methodology and data
presentation (Kahneman and Tversky, 1979), as well
as the preferences of the decision-maker for using a
certain decision style and poor communication
between the methodologist and the user. The
simulation methodology is a paradigm of problem
solving in which the personal experiences of users as
well as their organizational culture play an important
27
Kljaji
´
c Bor
ˇ
stnar M., Rajkovi
ˇ
c V., Kljaji
´
c M., Skraba A. and Kofja
ˇ
c D. (2010).
SIMULATION BASED LEARNING ABOUT COMPLEX MANAGEMENT SYSTEMS - A Simulation Experiment.
In Proceedings of the 2nd International Conference on Computer Supported Education, pages 27-32
Copyright
c
SciTePress

role (e.g., in transition countries: market economy,
ownership, etc.). Students are only ones who would
potentially introduce simulation methodology into
practice. However, how to present modelling and
simulation (MS) is of enormous importance to the
students, whose personal experience is limited.
This paper describes over 30 year of experience
in the teaching of a modelling and simulation course
for students of the Faculty for Organizational
Sciences. The main objective of the course has been
to show the role of modelling and simulation in
management science in teaching the students the
methods and techniques of modelling as well as
general notation in the form of computer simulator,
accompanied by presenting the field of application,
effectiveness and facets at the support of business
decisions. Our course consists of two parts:
continuous simulation based on systems dynamics
and discrete event simulation (DES). The course is
in the third year and students by the time they start
the course they have already taken courses of
mathematics, statistics, theory of systems, as well as
organizational and economic courses. The final
grade of the course is derived from the student’s
project and written exam.
In this paper, we will discuss methods of
teaching SD. Of course, by definition, simulation is
experimentation on a computer model. It is a typical
virtual reality method, which can alienate students
from real management problems. In order to
motivate students in learning and understanding the
subject, many authors have developed business
simulators of various types. One of most popular is
the beer game simulator developed at MIT (Sterman,
2000). Therefore, we have also developed a
simulation model (Škraba et. al, 2003) in order to
clarify the usefulness of the simulation in solving
management problems. Students took part in an
experiment where they had to solve a managerial
decision problem supported by the simulation
model. They were assigned to work under different
experimental conditions. Experimental results were
then analyzed and discussed in the students’
projects. Students’ contributions were rewarded as a
part of their final grade. Also, students were kept
motivated throughout the course by special rewards
for their in-class participation. After the experiment,
students had to complete a questionnaire on their
opinions. The results show that management
students, taking the course Modelling and
Simulation, thought that application of the
simulation model contributes to a greater
understanding of the problem in comparison to those
who did not participate in the course with the
business simulator. In this paper, we analyzed
methods of teaching MS and the impact of the
business simulator and active participation of the
students during lecturing on their grades.
2 BUSINESS SIMULATOR – A
TOOL TO IMPROVE
LEARNING PROCESS
In order to improve our method of teaching
modelling and simulation and to persuade students
that simulation methods in management science are
not only a tool for solving already known academic
problems, we built a business simulator aimed at
presenting decision processes in enterprises more
realistically. Students have to take active part in an
experiment and then make reports about their
results. In this way, they were motivated to regularly
attend and understand lectures. However, if one
wants to persuade participants to experiment with a
stimulator, it has to be carefully prepared; the design
of the experiment has to be as realistic as possible in
order to show this advantage of using a simulation
model in decision support. For that purpose, the
business simulator has to reasonably reflect the
business situation and its utility.
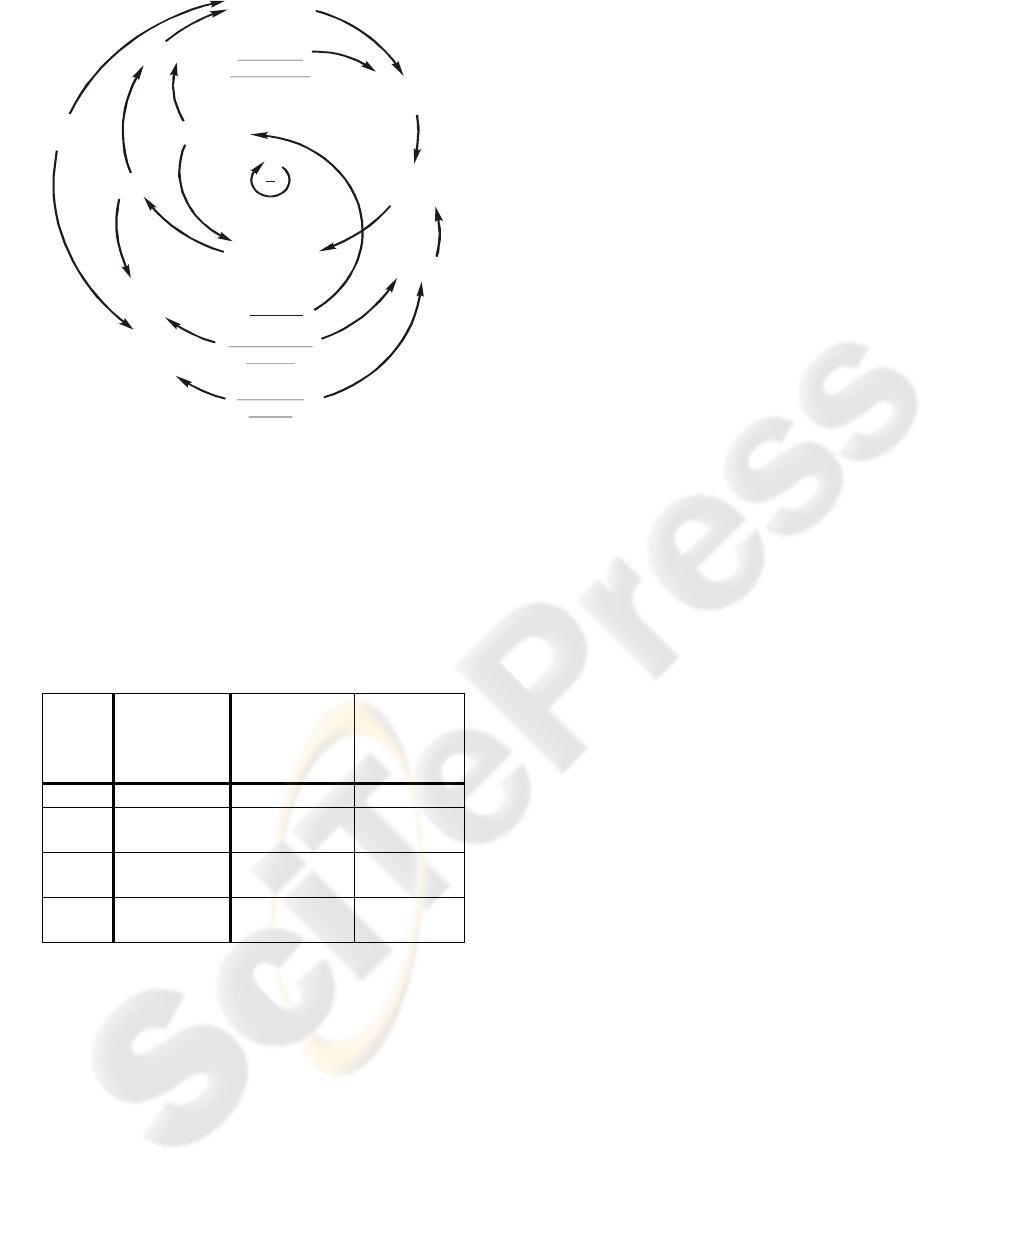
A simulation model developed by the SD
method, which was used in the experiment, is shown
in Figure 1. The model described by Škraba et. al
(2003), consists of production, workforce and
marketing segments, which are well known in
literature (Sterman, 2000). It was stated that product
price (r1) positively influences income. However, as
prices increase, demand decreases below the level it
would otherwise have been. Therefore, the proper
pricing that customers would accept can be
determined. If marketing costs (r3) increase, demand
increases above what it would have been as a result
of marketing campaigns. The production system
must provide the proper inventory level to cover the
demand, which is achieved with the proper
determination of the desired inventory value (r4).
Surplus inventory creates unwanted costs due to
warehousing; therefore, these costs have to be
considered. The number of workers employed is
dependent on the production volume and workforce
productivity, which is stimulated through salaries
(r2). Proper stimulation should provide reasonable
productivity.
CSEDU 2010 - 2nd International Conference on Computer Supported Education
28
Inventory
Shipping
Inventory
Gap
Desired
Inventory
Desired
Workforce
Desired
Production
Demand
Production
Productivity
+
+
+
+
+
+
+
+
+
+
+
+
+
+
-
-
-
-
Cash
Inflow
Workforce
Cash
Outflow
Salar y
Marketing
Costs
Product
Price
Figure 1: Causal Loop Diagram of Production Model.
The participants in the experiment had the task of
promoting a product on the market, whose life cycle
is one year. They had to find the appropriate value of
parameters r
i
defined in the interval r
min
≤ r
i
≤ r
max
.
The parameter values are shown in Table 1, where
MU in the Unit column is the abbreviation for
Monetary Unit.
Table 1: Parameter limitations.
Parame
ter
Description
Unit
Interval
r
1
Product Price
MU/product
50-200
r
2
Salaries
MU/month*
people
500-2,000
r
3
Marketing
Costs
MU/product
0-20,000
r
4
Desired
Inventory
product
1,000-15,000
The model was prepared in the form of a
simulator (Škraba et. al, 2003). The participants
changed the parameter values via a user interface
that incorporated sliders and input fields for
adjusting the values.
After setting the parameters in the control panel,
the simulation could be processed. The stop time of
the simulation was set to twelve months. Output was
shown on graphs representing the dynamic response
of the system and in the form of a table where
numerical values could be observed (Capital Return
Ratio (CRR), Overall Effectiveness Ratio (OER),
Workforce Effectiveness Ratio (WER), Inventory /
Income Ratio (IIR), Production, Workforce,
Inventory, Net Income, Shipping, Cash Inflow, Cash
Outflow). Participant had no limitations of the
simulation runs that he/she intended to execute
within the time frame of the experiment. The criteria
function was stated as the sum of several ratios,
which are easily understood and were known to the
participants. It was determined that Capital Return
Ratio (CRR) and Overall Effectiveness Ratio (OER)
should be maximized at the lowest Workforce and
Inventory costs determined by Workforce
Effectiveness Ratio (WER) and Inventory/Income
Ratio (IIR). The simulator enabled simultaneous
observation of the system response for all four
components (CRR, OER, WER and IIR) stated by
the criteria function during the experiment. The
criteria function was dependent on the chosen
parameter values and is stated as:
4321
max wIIRwWERwOERwCRRJ
Rr
i
(1)
The weight values were prescribed as:
1
w
=
0.5,
2
w
= 0.35,
3
w
= 0.1 and
4
w
= 0.05.
The goal of the participants was to maximize the
criteria function in Equation 1. The criteria function
represents the business goal, which is explicitly
stated in our case in order to achieve a proper level
of experimental control with regard to the results
obtained.
3 SIMULATION EXPERIMENT
The simulator enabled simultaneous observation of
the system response for all variables stated by the
criteria function during the experiment. In total, 147
subjects, senior university students randomly
scheduled into three groups, participated in the
experiment. The experiment was conducted under
three experimental conditions:
a
0
) Determination of strategy on the basis of a
subjective judgment of the task
Under this condition, a subject had to make an
individual judgment about the best possible strategy
on the basis of the presentation of the model by the
Causal Loop Diagram (CLD) and the stated Criteria
Function. The participants had 30 minutes to
determine the appropriate values of decision
parameters and record their decisions on paper.
a
1
) Individual decision-making supported by the
simulation model
SIMULATION BASED LEARNING ABOUT COMPLEX MANAGEMENT SYSTEMS - A Simulation Experiment
29
Under this condition, each subject was supported by
the simulation model, which provided feedback
information about the anticipated business outcome.
There was no limitation on the number of simulation
runs a particular participant executed on the
simulation model within the experimental time.
After each predetermined time interval (8+8+8+6
minutes), participants had to forward their selected
business strategy to the network server and continue
the search for the optimal business strategy.
Participants had to make a final decision about the
best business strategy and forward the selected
decision parameter to the server after 30 minutes.
a
2
) Decision-making supported by both the
simulation model and group feedback information
Under this condition, the simulation model was
connected to the GSS, which enabled the
introduction of group feedback information into the
decision process. Under experimental condition a
2
,
each individual subject was supported by the
simulation model, which provided feedback
information on the anticipated business outcome.
Under this condition, subject interaction via
computer mediation was enabled. Participants were
able to examine the chosen business strategies
(decision parameter values) of other participants in
the decision group after the strategies were
forwarded to the network server. Therefore the
participants could look into the "group’s
achievements" after the 8th, 16th and 24th minutes.
There were no limitations on how many times they
could seek group feedback. Group feedback
information was presented in the form of a table,
which contained input parameter values selected by
each participant anonymously, and the average
values of the parameters with the standard deviation.
3.1 Simulation Experiment Results
The hypothesis that model application and group
feedback information positively influence the
convergence of the decision process and contribute
to higher criteria function values was confirmed at
the p=.01 level. More precisely, the results of the
decision process gathered when group feedback
information was introduced revealed that criteria
function values of Group a
2
were higher than in
cases where the decision was based only on
individual experience with a simulation model (a
1
)
and the lowest criteria function values were achieved
on the basis of subjective judgment (a
0
).
However, we expected that the results gathered
after the first eight minutes would not differ for the
groups working with simulator (a
1
and a
2
) where the
same conditions were in force in the first eight
minutes: individual use of simulator. Because groups
were randomized and homogenous, we expected no
difference in participants' use of simulator.
However, we found that the frequency of simulator
use in first eight minutes was significantly higher in
Group a
2
than Group a
1
. In the second year, we
repeated the experiment with the next class, but only
with conditions a
1
and a
2
(Škraba et. al, 2007); the
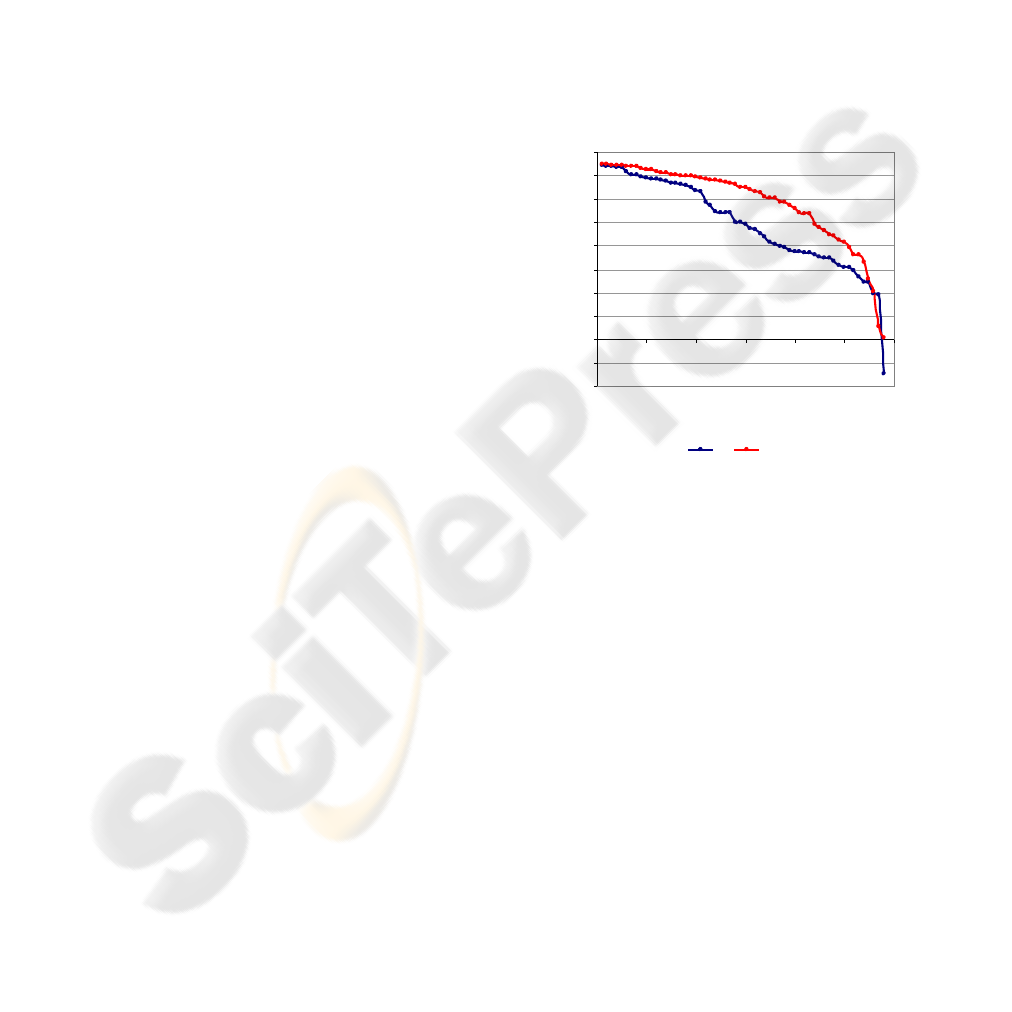
results were similar. The results of the decision
process conducted under experimental conditions a
1
)
N
a1
=58 and a
2
) N
a2
=58 are shown in Figure 2. On the
Y-axis, the values of the criteria function for each
participant are ordered from the highest to the
lowest. On the X-axis, the number of participants is
presented.
-0,4
-0,2
0
0,2
0,4
0,6
0,8
1
1,2
1,4
1,6
0 10 20 30 40 50 60
No. of participants
Criteria function (J)
a1 a2
Figure 2: Values of criteria function (J) achieved under
conditions a
1
and a
2
, ordered from the highest to the
lowest.
The single factor ANOVA showed that there are
highly significant differences among Groups a
1
and
a
2
on a p=.006 level of confidence. However, we
again found that the frequency of simulator use in
first eight minutes was significantly higher in Group
a
2
than Group a
1.
Therefore, the following year we
omitted the exercise on the business simulator in the
process of teaching with students in order to prepare
tools for a new experiment according to Solomon
Four-Group Experimental Design. That
automatically means that students are not obliged to
participate in lectures.
4 OPINION QUESTIONAIRE
SNALYSIS AND EXAM
RESULTS
Evidence of the students' grades from the course of
CSEDU 2010 - 2nd International Conference on Computer Supported Education
30

modeling and simulation, where students took part
in simulation experiment were high (first attempt:
average grade=7.08, Std. Deviation=1.78; n=118)
and student was motivated to visit lectures and
seminars. In the course for which experiment was
omitted, the attendance of lectures was rather poor
(attendance was not obligatory) and the grade was
lower (first attempt: average grade=3.38, Std.
Deviation=1.96; n=91). It must be emphasized that
the final grade of the course is derived from the
student’s individual project (40%) and a written
exam (60%). The written exam consists of six
standard question prepared in advance and selected
by chance for all students, regardless of whether
they had attend lectures or not. Therefore, the
analysis of the results could be considered an
unbiased one.
The participant’s opinions about their
involvement in the experiment were solicited with
questionnaires. Participants filled in the
questionnaires via a web application. Questions were
posed in a form of a statement, and agreement to the
statement was measured on a 7-point Likert type
scale, where “1” represents very weak agreement,
“4” a neutral opinion, and “7” perfect agreement
with the statement. The average value of an answer
and its standard deviation to the statements in the
opinion questionnaire are shown in Table 2.
Table 2: Average agreement and its standard deviation to
the statements in the opinion questionnaire.
Q Short descpription of a question a1 a2
5,733 5,724
(0,785) (0,996)
5,733 5,552
(0,980) (1,183)
5,833 5,690
(1,392) (1,256)
6,600 6,586
(0,498) (0,733)
5,067 5,931
(1,484) (1,132)
5,167 5,931
(1,683) (1,307)
4,733 4,966
(1,530) (1,149)
5,833 6,034
(1,020) (0,981)
6,400 6,483
(0,894) (0,949)
5,900 6,276
(1,269) (0,797)
10
contribution of the simulator to the quality of decision
7
motivation for solving the problem
8
benefit of participation in the experiment in the course
9
organization of the experiment
4
simplicity of the use of simulator
5
contribution of simulator to understanding of the problem
6
evaluation of the time for solving the problem
Experimental Condition
1
general quality of the experiment
2
presentation of the decision problem
3
understanding of the decision problem
From Table 2, it is evident that participants
expressed high agreement to most of the statements.
In fact, only Statement 7, regarding motivation for
participating in the experiment, was evaluated a bit
lower. In other words, it was closer to the neutral
point, but not negative.
We performed an ANOVA test to explore the
differences in opinions among the four experimental
conditions. The ANOVA test also showed high
agreement in opinion between groups. The groups’
opinions differ significantly only in two questions:
4) simplicity of use of the simulator (F=3.067,
p=.031), and 5) contribution of simulator to
understanding of the problem (F=3.274, p=.024),
both of which can be explained by different
experimental conditions requiring a slightly different
user interface and thus different levels of person-
computer communication.
From the opinion questionnaires, we can make
some general observations:
a) 99% of the participants agreed on the general
quality of the experiment.
b) 84% of all participants agreed that the use of
simulator contributed to understanding of the
problem.
c) 63% of all participants agreed that they were
motivated for solving problem.
d) 88% of all participants agreed that they
benefited from participating in the experiment.
e) 92% of all participants agreed that use of the
simulator contributed to better decision-making.
These are cross-group averages and represent the
overall agreement to the statements. We can say
that, in general, students were satisfied with the
experiment as a method of teaching and the use of
simulation in decision support.
5 CONCLUSIONS
This article describes experience in teaching of
modeling and simulation course for students of the
Faculty of Organizational Sciences, University of
Maribor. The course consisted of theoretical
lectures, practical training and participation in the
experiment. Special emphasis was made on the
motivation of students to actively participate in the
course and in the experiment. In order to participate
in the experiment, students had to actively
participate in both the theoretical and practical parts
of the course. The experiment was performed on the
business simulation model in order to clarify the
usefulness of the simulation in solving management
problems. The goal was to acquire knowledge of
learning in a group decision process supported by a
system dynamics model and group information
feedback. The criteria function was explicitly
defined in order to increase the level of experimental
SIMULATION BASED LEARNING ABOUT COMPLEX MANAGEMENT SYSTEMS - A Simulation Experiment
31

control. It was found that model application and
group feedback information positively influence the
convergence of the decision process and contribute
to higher criteria function. More precisely, the
results of the decision process gathered when group
feedback information was introduced were better
than in cases where the decision was based only on
individual experience with a simulation model and
the worst results were achieved on the basis of
subjective judgment. However, group feedback and
the facilitator are extremely important during
complex problem solving. The results show that
management students taking the course of Modeling
and Simulation thought that application of the
simulation model do contribute to a greater
understanding of the problem, faster solution finding
and greater confidence in participants. All
participants agreed that a clear presentation of the
problem motivates participants to find the solution.
According to the authors' subjective evidence of
students' grades from the course of modeling and
simulation, there is a significant difference between
classes of students taking part in simulation
experiment (higher motivation to visit lectures as
well as seminars); in the course where the
experiment was omitted, the attendance of lectures
was rather poor.
All participants agree that clear presentation of
the problem motivates participants to find the
solution. So, in the future, the use of realistic yet
sufficiently simple business models is essential, if
one wishes to close the gap between business
processes understanding and the role of modeling
and simulation in problem solving. A similar
conclusion was found in (Ståhl, 2007).
REFERENCES
Coyle, R.G., 1996. System Dynamics Modelling: A
Practical Approach. Chapman and Hall. London.
Forrester, J.W., 1969. Urban Dynamics. Cambridge MA.
Productivity Press.
Homer, B.J., 1996. Why we iterate: Scientific modeling in
theory and practice. System Dynamics Review. John
Wiley & Sons, 12.1:1-19.
Kahneman, D. and Tversky, A., 1979. Prospect theory: An
analysis of decision under risk. Econometrica, 47:263-
291.
Muscatello, J.R., Small, M.H., and Chen, I.J., 2003.
Implementing enterprise resource planning (ERP)
systems in small and midsize manufacturing firms.
International Journal of Operations & Production
Management, 23.8:850-871.
Schniederjans, M.J., and Kim, G.C., 2003. Implementing
enterprise resource planning systems with total quality
control and business process reengineering – Survey
results. International Journal of Operations &
Production Management, 23.4:418-429.
Simon, H., 1997. Models of Bounded Rationality:
Empirically-Grounded Economic Reason. Vol. 3.
MIT.
Škraba, A., Kljajić, M., Kljajić Borštnar, M., 2007. The
role of information feedback in the management group
decision-making process applying system dynamicss
models. Group Decision and Negotiation, 16:77-95.
Škraba, A., Kljajić, M., and Leskovar, R., 2003. Group
exploration of system dynamics models – Is there a
place for a feedback loop in the decision process?
System Dynamics Review, 19:243-263.
Ståhl, I., 2007. Teaching simulation to business students
summary of 30 years’ experience. Proceedings of the
2007 Winter Simulation Conference, S. G. Henderson,
B. Biller, M.-H. Hsieh, J. Shortle, J. D. Tew, and R. R.
Barton, eds.
Sterman, J.D., 2000. Business Dynamics: Systems
Thinking and Modeling for a Complex World.
Irwin/McGraw-Hill: Boston MA.
CSEDU 2010 - 2nd International Conference on Computer Supported Education
32
