
Dynamical Segmentation of Images for the Problems of
Medical Diagnostics
Evgeny Maryaskin, Sergey A. Ivanovsky and Anatoly P. Nemirko
St. Petersburg Electrotechnical University “LETI”, St. Petersburg, Russian Federation
Abstract. This article describes software realized method, suggested for the
analysis of medical data. The methods are illustrated by the examples in the
fields of echocardiography and angiography. Dynamic scenes segmentation and
motion detection, based on optical flow calculation underlie this method. The
description is illustrated by model and real medical data examples. The results
may be used in applied tasks of dynamic segmentation of medical images.
1 Introduction
A number of actual problems of image processing add up to detection of moving
objects, of objects’ scope, of motion and of motion parameters [1], etc. Solution of
these problems is based on image segmentation.
The prospects of one segmentation method developing, equally suitable for every
task seems hardly realizable [2]. Nowadays problems of dynamic segmentation are
not studied enough and there are no seriously studied computer-aided dynamic scenes
segmentation methods. In spite of fair quantity of static segmentation methods in
existence, nowadays the tendency to combining these areas is only appearing.
The goal of this work is to analyze the images segmentation method in medical
diagnostics applications and to provide some ideas devoted to medical data analysis
of echocardiography and angiography.
For the last 15-20 years echocardiography has been one of the main methods of
heart visualization. One of the drawbacks of echocardiography is evident dependence
on the researcher’s qualification[4]. Echocardiography results research methods in
existence do not imply using subsidiary computer-aided resources.
Angiography or arteriography is a medical imaging technique used to visualize the
inside, or lumen, of blood vessels and organs of the body, with particular interest in
the arteries, veins and the heart chambers. Angiographic methods are widely used in
the pulmonary thromboembolism prevention in case of acute venous thrombosis
2 Motion Analysis
Motion analysis has long been a specialized subject area, which hasn't had much
importance for the general theory of image processing [1]. But now because of the
Maryaskin E., A. Ivanovsky S. and Nemirko A. (2010).
Dynamical Segmentation of Images for the Problems of Medical Diagnostics.
In Proceedings of the Third International Workshop on Image Mining Theory and Applications, pages 78-84
DOI: 10.5220/0002962800780084
Copyright
c
SciTePress

general development in the field of image processing more advanced methods used in
motion analysis. Rapid progress in hardware and algorithms make it now possible to
analyze image sequences even on standard personal computers and workstations.
Nowadays there are no detailed systems, which make it possible to carry out
dynamic segmentation of image sequence fully and well [1, 2]. Methods in existence,
which are used for this come to the abstraction of optical flow and then to further
pixels selection, which will be interpreted as moving. However this choice comes to
the simple threshold filtration. This method appears to be extremely unsuccessful
particularly for the scenes, in which objects themselves are changing, for example
changing their irradiance, stretching, shrinking or interacting with each other.
It is necessary and, which is more important, possible to improve segmentation
methods, which can be done on the basis of already utilized methods, algorithmic and
software tools, for the improvement of final result of the operation.
2.1 Optical Flow Definition
Moving and intensity levels changing are not equivalent. In connection with this two
terms are of great importance: motion field and optical flow. Motion field of the
image is the real image in 3-D scene, adjusted to the image plane. Optical flow is
defined as a "flow" of intensity levels on image plane. Optical flow and motion field
are equal only for few restricted cases.
The notion of optical flow is taken from hydraulic gas dynamics. From the
integrated form of equation:
VAV
udadVdVu 0)(
(1)
The optical flow continuity equation results:
0
gf
g
T
(2)
where f refers to the flow vector and g – to the intensity level. The solution of this
equation for a pair of frames is a vector field of four elements: two coordinates,
velocity and the pixel shift direction, built in the frame[1]. Then we can rewrite the
(2) equation for 25 pixels (p1..p25) of this neighborhood in matrix form:
)25(
...
)1(
)25()25(
......
)1()1(
pGt
pGt
y
x
pGypGx
pGypGx
(3)
Let us designate the matrixes of this system as A, d, b. Then we obtain the equation
(3) in matrix form:
bAd
(4)
79

For optical flow calculation several algorithms are developed and implemented on
basis of these equations. The method of solving the stated problem [3], first suggested
by Lukas-Kanade in 1981, consist in the minimization of the following expression:
2
A
db
(5)
The solution of this problem results in the following:
1
()
TT TT
A
d b AAd Ab d AA Ab
(6)
From the solution method several natural constraints on the source data arise:
1. A
T
A is reversible
2. proper values of A
T
A are congruous and negligible
As a result of the Lukas-Kanade method working a shift vector finds its
positioning in every pixel of the frame.
3 Method Researching
Any video succession processing with allocation of information about motion consists
of two parts: preprocessing and the optical flow calculation and postprocessing of the
received flow data with the attempt to extract information from them. In this article
modifications, suggested for both parts of the processing procedure, are described.
3.1 The First Processing Stage
Research showed, that even on the stage of optical flow calculation, some algorithmic
modifications can be made, which will help to accelerate the calculation process
without considerable lost of information. A special software tool was designed for
quick flow calculation and for the demonstration of its structure. Flow vector field
calculation is performed on basis of Lukas-Kanade method and it has some
peculiarities:
- Vectors are calculated separately in every pixel, none of the calculations being
performed twice. That means, firstly, that it is possible to calculate optical flow
vectors only in the pixels, in which it is necessary, and secondly, it gives us a chance
of parallel vector field calculation.
- The direction, assigned by a vector is calculated not absolutely, but accurately
within π/4, which, firstly, can be done very fast, secondly, does not reduce accuracy,
because for every pixel of the image this vector sets the neighboring pixel, in
direction of which it is moving, and thirdly, it considerably simplifies the flow
postprocessing and flow vectors classification.
The important advantage of this development is the possibility of real-time
calculating, even using non-specialized equipment.
On the illustration there are screenshot of the program in the process of
angiography data researching. It may be noticed, that with the similarity of the two
sequenced frames, the calculated vector field follows the real sanguimotion,
happening at the time of filming.
80
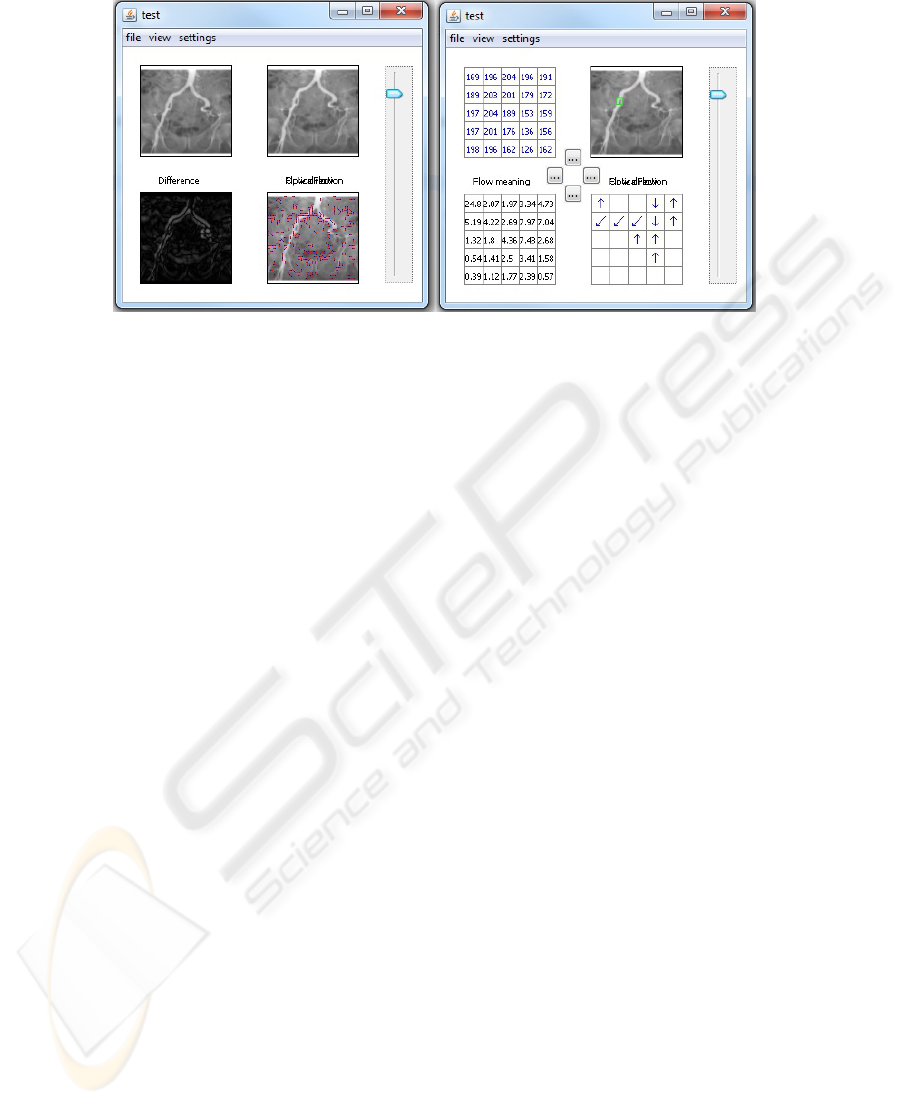
Fig. 1. Demonstration of the developed optical flow calculation and researching software.
Angiography proceeding sample.
3.2 The Second Processing Stage
The presented method differs greatly from methods, common for images processing,
firstly as it does not confine itself only to sifting short flow vectors, but take into
account both vector components and secondly as it does not end with receiving vector
field of the flow, but works with it as with new three-dimensional signal, subject to
segmentation.
Key stages of the method are the following:
- Clustering. The clustering result is a vector field, divided into clusters of similar
vectors, every cluster being a noise vectors package or a part of a real object.
- Filtration. Filters are in the large based on the statistic image processing
methods.
- Characteristics calculation. Detection of characteristics, allowing us to determine
the best moment for terminating the iterative process. Characteristics reproduce the
main properties: shape, size, location, dispersion, distribution inside the clusters, etc.
- Postprocessing. On this stage final forming of objects from clusters with
postfiltration and form accentuation takes place.
- Transition to a new iteration. This repeats until required characteristics are
achieved.
For realization of operation with calculated flows a special software tool was
developed, which makes it possible both to apply ready flow data postprocessing
algorithms, read from dynamic scenes and to manually combine any variants of
suggested filters, handlings and settings for research purposes.
The main advantage of this method is that it makes it possible to solve
segmentation problems, which have no solution for static images and to identify
complex configurations at the expense of usage of four-dimensional flow vectors.
81

4 Scenes Modeling
The possibility of inclusion independently modeled scenes into the research
methodology allows us to achieve two significant for the whole development results
1. The possibility of investigating some particular cases, which are especially
interesting in the scope of the investigation.
2. The possibility of constructing the whole processing quality characteristic
estimation, based on the comparison of the result of the methodic operation and
initially known model characteristics.
For the estimation of algorithm operation quality we need the possibility to create
input dataflows with the following settings:
Image mask specifying
Noise of arbitrary intensity and distribution.
Arbitrary quantity of objects
Adjustable motion settings
Adjustable changes of object's sizes
In the course of research a special video successions modeler was developed,
which answers these demands and considerations.
5 Segmentation Characteristics
While considering possible quantitative estimation characteristics, we can come to a
conclusion, that the comparison of the idealized model and the algorithm operation
result induces a multitude of possible quality criteria. As the criteria of quality the
following is chosen:
1. The ratio of the number of pixels having been treated as moving both in the
model and at the algorithm to the number of pixels, treated as moving by the
algorithm. It shows the percent of pixels, treated as moving, were identified correctly.
2. The ratio of the number of pixels having been treated as moving both in the
model and at the algorithm to the total number of pixels, treated as moving in the
model. It shows, what percent of actually moving pixels were identified correctly.
6 Experiments
6.1 The Model Scenes
The first model scene is destined to estimate cases, which answer the optical flow
equation, because the scene does not enclose objects which change their form or their
own intensity. However, images of 3x objects present in the tangent plane intersect
one another twice during the observation and every image is very noisy.
The second model scene is the most important, as it is destined for the estimation
of cases, not answering the optical flow equation. In this example the scene contains
an object with variable intensity, an object with changing size and the intersection of
82
objects. Each image is very noisy.
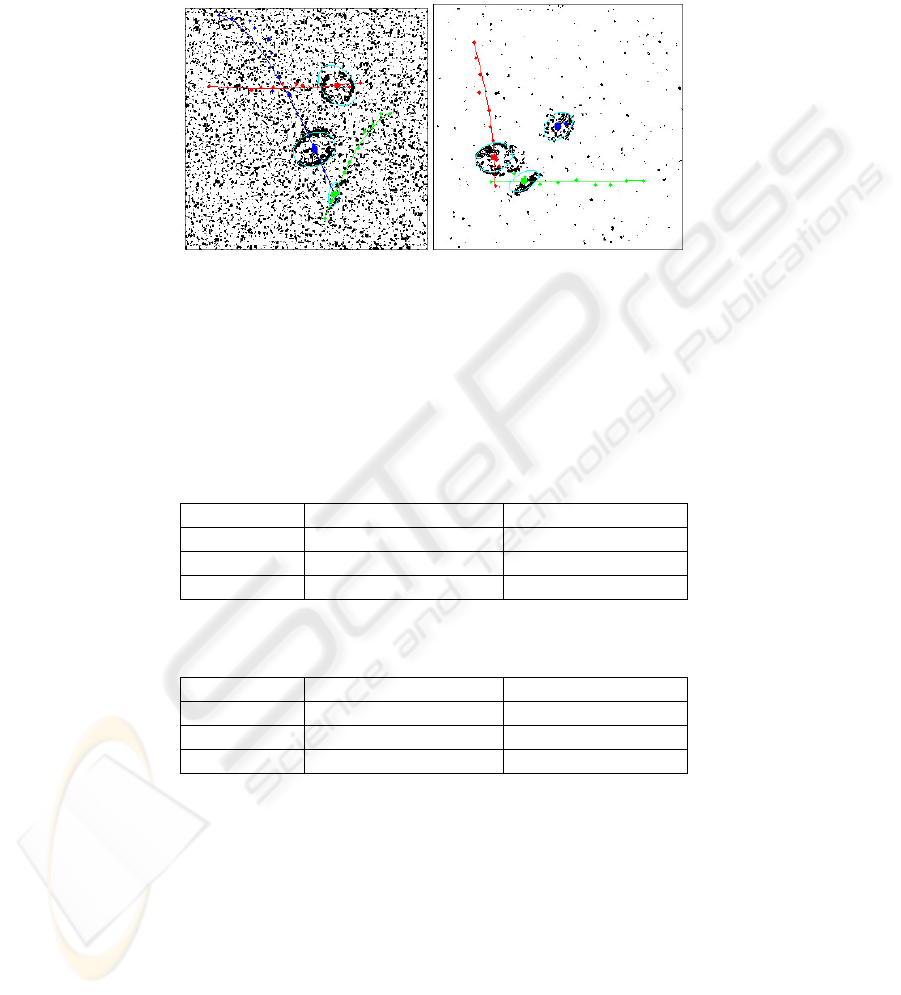
On the illustration 2 there is an image at the moment of the software operation,
which allows us to observe moving path, drawn for every object, which assists in
segmentation and tracing.
Fig. 2. Model scene 1(left) and 2(right) proceeding.
After applying the developed software package we succeed in highlighting and
tracing the three indicated objects. Then the characteristics calculation stage is
performed, which can be supplement with the meanings of characteristics for the
same cases, which, however, are calculated in the traditional method of threshold
segmentation.
Table 1. The results of characteristics calculation for the traditional and for the developed
segmentation methods. The first model scene.
1
s
t
characteristics 2
n
d
characteristics
Object #1 0.0430 / 0.7456 0,4297 / 0.7060
Object #2 0.0684 / 0.8493 0,3999 / 0.7518
Object #3 0.0405 / 0.2111 0.2411 / 0.6388
Table 2. The results of characteristics calculation for the traditional and for the developed
segmentation methods. The second model scene.
1
s
t
characteristics 2
n
d
characteristics
Object #1 0.0498 / 0.5811 0,3967 / 0.9254
Object #2 0.0382 / 0.7561 0,2873 / 0.8379
Object #3 0.0487 / 0.3008 0.2386 / 0.6132
Where the first characteristics is the ratio of right-detected moving pixels and the
second characteristics is the ratio of right-detected found pixels. The calculation
results are shown for the traditional/developed method.
6.2 The Real Scene
The results of echocardiography were taken for testing on real scenes. The main
peculiarities of these sequences are the following:
83
intense noisiness
lack of pronounced movements trajectories
constant size changing
lack of proper intensity change
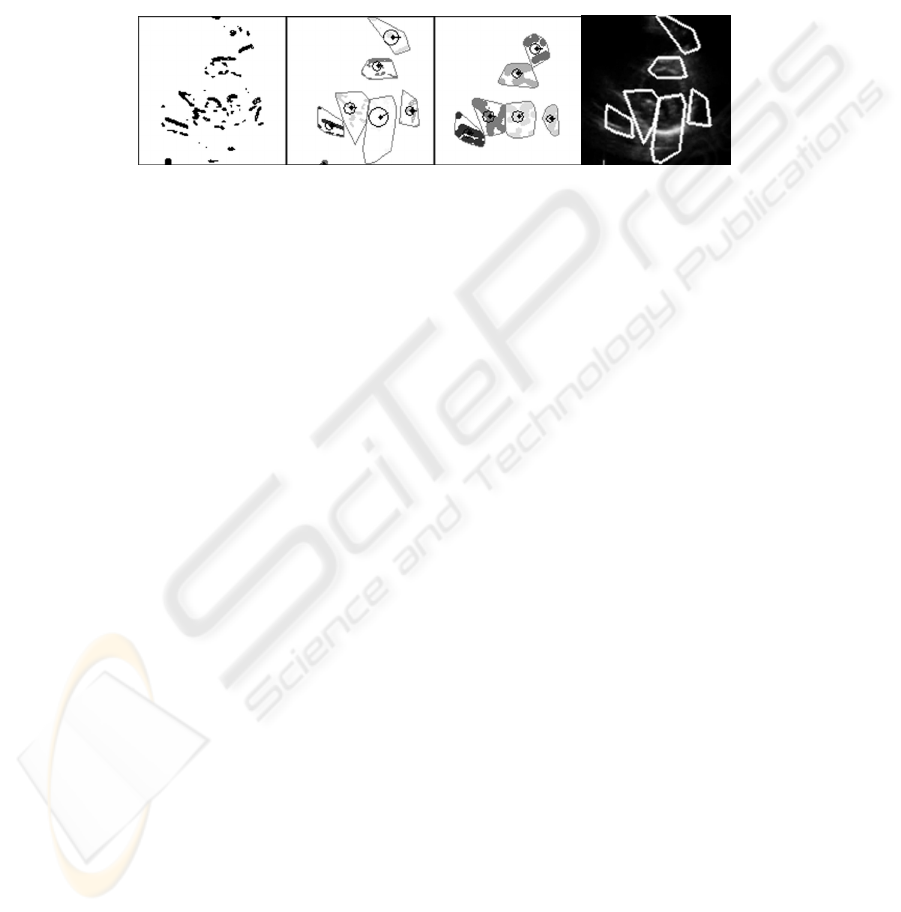
Segmentation in each of these frames is very complicated, and only experienced
specialist can draw conclusions about the object of observation. Than, to estimate the
result it takes to overlap cluster boundaries, exposed by the algorithm and the initial
image in order to state the efficiency of method operation.
Fig. 3. Real scene proceeding and result(the right one).
Image is now segmental on basis of jointly moving sections and it appears to be
much more convenient for understanding by a non-specialist in ultrasonic diagnostics.
7 Conclusions
In this work the existing methods of dynamic segmentation in the problems of
medical diagnostics illustrated by echocardiography and angiography were analyzed
and the new methods, based on the calculation of optical flow were developed. Most
attention was devoted to the critical for flow calculation cases.
A comparative survey of existing methods and the developed method of dynamic
scenes segmentation was conducted, which showed significal comparative
effectiveness of the development up to a 40 times.
References
1. Jahne, B.: Digital Image Processing. 6
th
revised and extended edn, Vol. 583. Springer-
Verlag, Berlin Heidelberg (2005)
2.
Ballard, D, Brown C..: Computer Vision, Vol. 573. Department of computer science,
University of Rochester, New York (2006)
3.
Baker, S., Matthews, I.: Lucas-Kanade 20 Years On: A Unified Framework, Vol. 30. The
Robotics Institute Carnegie Mellon University, Pittsburg(2002)
4.
Ribakova, M.: Practical Guide In Ultrasound Diagnostics. Echocardiography, Vol. 544.
Vidar-M, Moscow (2008)
84
