
CrossSense
Sensemaking in a Folksonomy with Cross-modal Clustering over Content
and User Activities
Hans-Henning Gabriel, Myra Spiliopoulou
Faculty of Computer Science, Otto-von-Guericke-University Magdeburg, Magdeburg, Germany
Alexandros Nanopoulos
Institute of Informatics, Hildesheim University, Hildesheim, Germany
Keywords:
Sensemaking, Folksonomy, Social tagging, Folksonomies, Clustering, Tensor clustering.
Abstract:
Today folksonomies are of increasing importance, many different platforms emerged and millions of people
use them. We consider the case of a user who enters such a social platform and wants to get an overview of
a particular domain. The folksonomy provides abundant information for that task in the form of documents,
tags on them and users who contribute documents and tags.
We propose a process that identifies a small number of thematically ”interesting objects” with respect to subject
domains. Our novel algorithm CrossSense builds clusters composed of objects of different types upon a data
tensor. It then selects pivot objects that are characteristic of one cluster and are associated with many objects
of different types from the clusters. Then, CrossSense collects all the folksonomy content that is associated
with a pivot object, i.e. the object’s world: We rank pivot objects and present the top ones to the user.
We have experimented with Bibsonomy data against a baseline that selects the most popular users, documents
and tags, accompanied by the objects most frequently co-occurring with them. Our experiments show that our
pivot objects exhibit more homogeneity and constitute a smaller set of entities to be inspected by the user.
1 INTRODUCTION
Folksonomies enjoy an increasing popularity. Plat-
forms with different functionalities have emerged and
millions of people use them. In its most basic form,
a folksonomy is a social platform where users con-
tribute resources and annotate them with tags. As
Golder and Huberman point out, tagging is ”an act of
organizing through labeling, a way of making sense of
many discrete, varied items according to their mean-
ing” (Golder and Huberman, 2006). However, how
can newcomers to a social platform make sense of the
whole platform and get a fast overview of the seman-
tics associated with it? Should they study the activi-
ties of the most active users? Perform a categorization
of the resources stored in it? Or inspect the most pop-
ular tags? In this study, we propose CrossSense that
helps a user get a better overview of a folksonomy by
identifying a limited number of representative objects
and their ”worlds”, composed of users, resources and
tags strongly associated to these representatives.
Intuitively, a site can be perceived as a set of
resources (we concentrate on documents hereafter).
Hence, a straightforward way of getting an overview
of a site’s content would be by invoking an unsuper-
vised learning method over the site’s content. For ex-
ample, one could invoke Probabilistic Latent Seman-
tic Analysis (Hofmann, 2001) to learn the hidden top-
ics in the site, or text clustering to group the docu-
ments on similarity and cluster labeling to identify the
representative words in each cluster, see e.g. (Aggar-
wal and Yu, 2006). However, such methods focus on
the content only, without considering the way users
perceive this content.
Essentially, a newcomer should be helped to per-
ceive the site in the same way as its users perceive
it. This perception is encapsulated in the users’ ac-
tivities, i.e. contributing resources and tagging them.
The interplay among users, resources and tags in a
social platform is intensively investigated, mostly in
the context of recommendation engines. Marco de
Gemmis et al. consider tags next to content to infer
100
Gabriel H., Spiliopoulou M. and Nanopoulos A..
CrossSense - Sensemaking in a Folksonomy with Cross-modal Clustering over Content and User Activities.
DOI: 10.5220/0003101101000111
In Proceedings of the International Conference on Knowledge Discovery and Information Retrieval (KDIR-2010), pages 100-111
ISBN: 978-989-8425-28-7
Copyright
c
2010 SCITEPRESS (Science and Technology Publications, Lda.)
user interests and thus enhance the content-based rec-
ommender of a folksonomy site (de Gemmis et al.,
2008). Begelman et al. capture tags, users and an-
notated resources on a tensor (Begeman et al., 2006).
Tensor-based clustering for recommendations has in-
deed gained momentum in the last years; Symeonidis
et al. show that considering all relationships involving
users, tags and resources leads to superior recommen-
dation performance (Symeonidis et al., 2010). How-
ever, the objective of such studies is to find the most
relevant objects to a user rather than describe a whole
site with a limited number of representatives.
Our method CrossSense models the different types
of objects (users, documents, tags) of a social plat-
form as a tensor. We use tensor decomposition and
clustering to organize the platform’s objects in groups
that reflect the associations among them. We consider
different perspectives, i.e. different combinations of
tensor modes, for clustering, and choose the represen-
tatives of the site, which we term pivot objects, among
the objects that are present in clusters of multiple per-
spectives. Keeping in mind that little may be known
for a pivot object beyond its name (that is uninforma-
tive for users and for many tags), we build for each
pivot object its world, comprised of the objects most
likely to co-occur with it. Then, the overview of a so-
cial platform is mapped to the inspection of a small
set of pivot objects and their worlds, whereupon we
rank these objects on two properties: interestingness
and world stability.
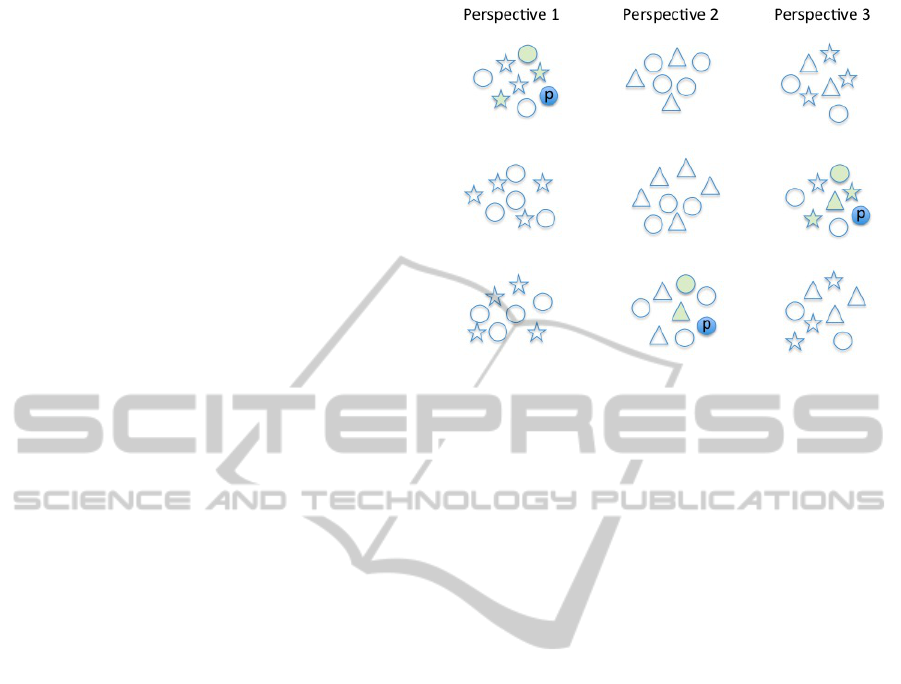
We illustrate the main idea of CrossSense in Fig-
ure 1. The objects in the figure (circles, triangles and
stars) correspond to different types of objects in a so-
cial platform’s site, i.e.documents (as circles), users
(as stars) and tags (as triangles), and thus to the cor-
responding modes of the tensor. A perspective en-
compasses objects of at least two different modi; Per-
spectives 2 and 3 in the Figure cover objects of two
modes (documents and users, resp. documents and
tags), Perspective 3 of three modes. Within each per-
spective, we see the objects grouped in three clusters.
To provide an overview of the social platform, one
could deliver these 9 clusters or their representative
objects. However, the three perspectives are different
views over the same data, i.e. they partially overlap.
A pivot object is a representative of multiple clus-
ters that belong to different perspectives but overlap
in content. In Figure 1, the object marked with a p
is a pivot object that stands for three clusters, one in
each perspective.
The pivot p in Figure 1 belongs to the mode
of documents (circles). Hence to describe ”its” clus-
ter in Perspective 1 we also need user objects (stars),
and similarly for the other two perspectives. The
Figure 1: Three perspectives over a site, Pivot object and
associated objects from different perspectives.
objects associated frequently with the pivot consti-
tute its world, comprised of the green-shaded objects
in Figure 1: the green-shaded user/star and docu-
ments/circles in Perspective 1 also appear together
with the pivot in Perspective 3, indicating that part of
the pivot’s world persists from one perspective to the
other. Instead of delivering three clusters as part of
the site’s description, CrossSense would deliver their
pivot object and the 4 distinct objects constituting its
world across the three perspectives.
The paper is organized as follows. In the next
section we start with the problem definition, then
introduce pivot objects and their worlds and define
the properties that make a pivot object interesting,
namely interestingness and stability. We then present
CrossSense, i.e. the steps of tensor-based modeling
of the folksonomy, clustering upon the tensor, extrac-
tion and ranking of pivot candidates and their worlds,
and filtering of uninteresting candidates. In section 4
we introduce a baseline method and evaluate our ap-
proach against it. Related work is presented in section
5. The last section concludes our study.
2 FINDING THE PIVOT OBJECTS
OF A SOCIAL PLATFORM
Objective of our investigation is to assist a newcomer
to a social platform by delivering a small number of
objects for inspection: these objects must be so cho-
sen as to provide an insight on the topics of impor-
tance in this platform. Which objects to choose and
of which type? A social platform is populated by
users who contribute resources (we concentrate on
documents) and tags. In terms of content, it might
CrossSense - Sensemaking in a Folksonomy with Cross-modal Clustering over Content and User Activities
101

look reasonable to supply the newcomer with infor-
mation about the documents in the collection, but this
overlooks the social aspects of the platform, includ-
ing the role of users in it and the way they perceive
documents by tagging them. On the other hand, the
only information typically available for a user is some
identifier, while some tags have at least an informative
name but others have not (contrast a tag ”good” with
a tag ”machine learning”).
Hence, our objective translates into finding a dis-
ciplined selection of objects from the platform, allow-
ing for all types of objects but providing some way
of ranking among individual objects. Our method
CrossSense starts with modeling documents, users
and tags in a tensor, so as to highlight the relation-
ships among them. We perform tensor decomposition
and clustering on these data and derive cross-modal
clusters that contain objects of two or all three types
(all types in the general case). We introduce a mea-
sure of interestingness to rank cluster members and
select the top-k ones as candidate pivot objects, i.e. as
representatives of the platform’s content. For each of
these top-k candidates we identify closely associated
objects; they constitute the candidate’s world. We
then select as pivot objects those that have the highest
interestingness and the most stable worlds.
We first present our tensor model, specify per-
spectives over the data and explain how cross-modal
clustering is done on them. We then introduce pivot
objects and their worlds and define interestingness
and stability on them. Finally, we describe the
CrossSense algorithm that extracts, ranks and selects
the pivot objects to be presented to the user. Our no-
tation is captured in Table 1 and explained in sequel.
Table 1: All variables used in this work.
Notation Description
M Set of all modi
X ∈ R
N
1
×...×N
|M|
Tensor with |M| modi
P Subset of modi that constitute
a perspective
ξ
P
Cross-modal clustering with
modi from P
x Candidate object
B
x
Subset of clusters in which x
appears
C Set of all clusterings
τ Threshold for minimum
number of co-occurences
W
τ
x
World of x w.r.t. threshold τ
2.1 Perspectives over Multi-modal Data
To identify pivot objects, i.e. objects that are rep-
resentative of the subdomains in the folksonomy,
we must first form the subdomains as object clus-
ters, exploiting the relationships among them, namely
that a user contributes resources, a user contributes
tags, a tag annotates resources. These types of ob-
jects constitute the set of modi M of a tensor X ∈
R
N
1
×...×N
|M|
, where N
i
is the cardinality of the i
th
mode. For a typical folksonomy we consider M =
{users,tags,resources}; a digital library may have
modi like articles, conferences, authors, editors etc.
Definition 1. Given is a tensor X ∈ R
N
1
×...×N
|M|
and
M the set of modi in this tensor. A ”perspective” P
is a combination of at least two distinct modi, i.e. an
element of Powerset P(M) \{m ∈ M ∪
/
0}.
We use perspectives instead of single modi since
we would like to discover objects of different types
that thematically belong together and describe the
pivot objects. As pivot objects we consider only ob-
jects that appear in clusters of at least one perspective.
This means that an object is a candidate pivot only if
it is strongly associated with other objects, whereby
the notion of ”strong association” will be captured
through the eigenvalues of the eigenvectors of the core
tensor, as we will see below.
For tensor-based clustering we use the method
proposed in (Sun et al., 2006): Singular Value De-
composition (SVD) is performed upon the original
feature space and a core tensor is derived with Tucker
decomposition. Similar to Sun et al., we build a clus-
ter by considering only the positions with the top-n
eigenvalues (absolute values, for some parameter n).
A high value in the core tensor implies that the objects
in the corresponding eigenvector are strongly associ-
ated. The value in the core tensor points to a particu-
lar eigenvector from each mode. By our definition of
perspective, we perform clustering only upon combi-
nations of at least two modi; such a cluster contains
objects of different types, so we term it a cross-modal
cluster. A pivot candidate is then an object from
eigenvectors a high value in the core tensor points to,
and that have high energy in the eigenvectors. High
energy means that the SVD has associated the object
with a high absolute value in the eigenvector. But
pivot objects must satisfy further constraints, as we
explain in the next subsection.
2.2 Pivot Objects and their
Interestingness
A pivot object is a representative of a cross-modal
cluster. It must have following properties:
KDIR 2010 - International Conference on Knowledge Discovery and Information Retrieval
102

• It contributes to at least one cluster in many per-
spectives,
• is associated with the same objects in several per-
spectives and
• does not contribute to many clusters of the same
perspective.
The first property states that a pivot object must be
characteristic of some cluster; in tensor-based cluster-
ing we, quite naturally, use energy as criterion. The
third property excludes objects that are characteris-
tic of many clusters within the same perspective, be-
cause they are not informative. For example, consider
a tag associated with many objects: the two proper-
ties together say that if these objects form one coher-
ent group, then the tag is a pivot candidate, but if they
form many groups it is not. The second property says
that a pivot object must cover multiple perspectives,
but it must be associated with the same objects. For
example, consider a tag associated with documents
on machine learning in the ”tag-resource” perspective
(two object types) and take the ”tag-resource-user”
perspective (three object types): if the tag contributes
to a cluster on machine learning documents, then it is
a good pivot object that associates the hidden subject
”machine learning” with both documents and users.
If the tag rather contributes to a cluster with machine
learning documents in the first (two-modi) perspec-
tive and to a cluster with image processing documents
in the second (three-modi) perspective, then it is a less
good candidate.
Since in the first place all objects from the origi-
nal data set are candidates to be pivot objects, we need
some criteria on which we base the decision whether a
candidate becomes a pivot object or not. The first cri-
terion to be fulfilled is that we require a candidate to
be under the top-m interesting objects. We motivate
interestingness of a candidate as follows: Though a
candidate object may be representative of a domain
that describes part of the folksonomy and this domain
can be viewed from different perspectives, still within
a single perspective the candidate object may occur in
different clusters (and thus causes the clusters to over-
lap) which is not desired w.r.t. the third property for
pivot objects. This results in two antagonistic ways
a candidate object influences its interestingness: the
more often it occurs in the same perspective but in
different clusters the less informative it is; the more
often it occurs in different perspectives, the more in-
formative it is. Thus, we define interestingness as fol-
lows:
Definition 2. Let C =
S
P∈P(M)\{m∈M∪
/
0}
{ξ
P
} be the
set of all clusterings, where ξ
i
is the clustering for
perspective i. Let x be a pivot candidate. We define
the interestingness of x over all perspectives in C as
the number of clusterings where x appears , divided
by the maximum number of times x appears within a
single clustering.
In particular, let B
x,i
= {A ∈ ξ
i
|x ∈ A} be the sub-
set of clusters in ξ
i
for perspective i, in which x ap-
pears. Then:
interestingness(x,C) =
| ∪
i=1...|P|,B
x,i
6=
/
0
B
x,i
|
max
|P|
i=1
|B
x,i
|
(1)
The range of the interestingness function is
[0,+∞], higher values are better. Candidates with an
interestingness of less than 1, i.e. objects that ap-
pear in only one perspective, are pruned right away
(see Algorithm CrossSense in subsection 3). The de-
sirable properties of a pivot candidate, i.e. appear-
ing in many perspectives and appearing in only few
(preferably only one) cluster in each perspective, are
reflected in the nominator, resp. denominator of the
interestingness function.
2.3 The World of a Pivot Object
The second criterion to be fulfilled is that we require a
candidate to be associated with one of the top-q stable
worlds. Thus, before we motivate stability, we have
to define what the world of a candidate object is. We
say that the world of a candidate object are all objects
frequently co-occurring with it:
Definition 3. Let x be a pivot candidate, let C be the
set of all clusterings over the perspectives of tensor X
as in Def. 2. For each perspective i, let ξ
i
∈ C be the
corresponding clustering and let B
x,i
= {A ∈ ξ
i
|x ∈
A} ⊆ ξ
i
be the set of clusters in ξ
i
which contain x.
The ”world” of x under threshold τ, W
τ
x
, is the set
of objects co-occurring with x at least τ times in the
clustering of some perspective i.
In particular, let y 6= x be an object such as there is
an A ∈ B
x
i
with y ∈ A. The number of co-occurrences
of y with x is cooccur
x
(y) =
∑
P
i=1
∑
A∈B
x,i
|A ∩ {y}|
,
i.e. the number of clusters over all perspectives where
both x and y appear. Then the world of x under τ is
defined as:
W
τ
x
= {y|cooccur
x
(y) ≥ τ} (2)
In the trivial case of τ = 1, the world of a pivot
candidate x would consist of all objects that ever ap-
peared together with x in a cluster of some perspec-
tive. By increasing τ, objects with few co-occurrences
with x can be excluded. However, the fact that x ap-
pears in different perspectives should also be consid-
ered. For example, assume that x is a document that
CrossSense - Sensemaking in a Folksonomy with Cross-modal Clustering over Content and User Activities
103

co-occurs with some tags t,t
0
,t
00
,.. . and some docu-
ments d,d
0
,.. . under the perspective i of documents
and tags. When we consider the perspective j of doc-
uments and users, it is intuitive to expect that some
of d, d
0
,.. . also appear in the same cluster as x in that
perspective. If this is the case, then the association
of x with these documents is more stable than if x
were associated with completely different documents.
From this consideration we derive the notion of world
stability: the world of pivot candidate x is the more
stable, the more often its elements co-occur with x.
Definition 4. Let x be a pivot candidate and let W
τ
x
be its world under threshold τ. The stability of this
world is defined as:
stability(W
τ
x
) =
∑
y∈W
τ
x
cooccur
x
(y)
τ × |W
τ
x
|
(3)
The range of world stability is [1,+∞), where
higher values are better. The lowermost value cor-
responds to the case where each element of the world
appears no more than τ times (i.e. the lower bound-
ary) together with x.
We use the concepts of interestingness and world
stability to select a set of pivot candidates and their
corresponding worlds. In particular, we can choose all
pivot candidates whose worlds are not empty, given
τ. However, we can constraint the output further
by ranking the pivot candidates on interestingness,
choose the top-m ones for some m, compute their
worlds, rank them on stability and choose the top-
q ones. Hence, the output to the newcomer is a
set of the q most interesting pivot objects and their
worlds. In the next subsection we show the algo-
rithm CrossSense that computes this set of pivot ob-
jects given threshold values τ,m,q.
3 ALGORITHM CrossSense
Our algorithm CrossSense takes as input a tensor X
with a set of M modes and derives m pivot candidates,
ranked on interestingness, and at most q ≤ m worlds,
ranked on stability. It outputs the best pivot objects
with respect to interestingness and stability of their
worlds; if q = m, then m pivot objects are returned,
otherwise only the top-q ones are output.
CrossSense builds cross-modal clusters using ten-
sor analysis techniques, and thus requires the num-
ber of clusters y per perspective as input. From each
cross-modal cluster we select n initial pivot candi-
dates per mode, i.e. n × |M| candidates. Of these,
the top-m candidates will be chosen in the algorithm’s
second loop, as explained below.
Algorithm 1. CrossSense.
1: Input:
2: Tensor X ∈ R
N
1
×···×N
|M|
3: y: number of clusters to be build
4: n: number of objects from each eigenvector
5: τ: frequency threshold for object co-occurrence
within the world of a pivot candidate
6: m: top-m interesting pivot candidates
7: q: top-q stable worlds (q ≤ m)
8: Output:
9: Set T = ∪
q
i=1
{(W
τ
x
i
,x
i
)} of pivot objects and their
worlds
10: Algorithm:
11: C ←
/
0; // init set of all clusterings
12: for all P in P(M) \ {m ∈ M ∪
/
0} do
13: derive X
P
from X with modes in P
14: derive clustering ξ
P
of y clusters from X
P
, each
including n objects per object type
15: C ← C
S
ξ
P
;
16: end for
17: T ←
/
0; // init set of all pairs (W
τ
x
,x)
18: X ←
/
0; // init set of quadruples for all candidates
19: for all ξ
P
in C do
20: for all x in ξ
P
do
21: if |B
x,P
| < y/2 then update(X, x, B
x,P
)
22: end for
23: end for
24: compute interestingness and stability for all
quadruples in X
25: if x ∈ X among top-m and W
τ
x
among top-q then
T ← T
S
(W
τ
x
,x)
Table 2: Left: Three-mode tensor with eight entries. Right:
Tensor reduced to two-modi.
1,2,1 : 1 1,2 : 3
1,2,3 : 1 3,3 : 2
1,2,7 : 1 4,5 : 1
3,3,1 : 1 7,1 : 2
3,3,8 : 1
4,5,2 : 1
7,1,7 : 1
7,1,9 : 1
The first loop of CrossSense derives a clustering for
each perspective P (lines 12-16). First step in the first
loop is to reduce the modality of original tensor X
from |M| to |P| (line 13). This is done iteratively -
one mode less at a time. Reducing modality is done
by fixing the modes that are to be remained and sum-
ming up the values in the tensor from the mode that is
to be reduced. Consider for example the sparse rep-
resentation of a tensor in left column of Table 2. This
is a three-mode tensor having eight entries equal to
one, comma separated are the indices (one per mode)
KDIR 2010 - International Conference on Knowledge Discovery and Information Retrieval
104

pointing to the entries. In the right column the three-
mode tensor is reduced to a two-mode tensor by fixing
mode one and two and summing up the values for all
occurrences in mode three.
In a next step (line 14) from the reduced tensor
X
P
we derive the clustering ξ
P
using a generalization
of PCA: We derive a number of eigenvectors for each
mode and we derive the core tensor (Sun et al., 2006).
Entries in the core tensor point to eigenvectors that are
to be combined. From the combined eigenvectors we
choose those objects with highest energy (highest ab-
solute value) that form our cross modal clusters. Pa-
rameters in this generalized PCA are y for the number
of cross modal clusters to be build (y values of high-
est energy from core tensor) and n for the number of
objects to choose from each eigenvector (again values
of highest energy). All clusterings derived this way
are collected into set C (line 15).
Although we have as many perspectives as are the
combinations of at least two modes, we must keep in
mind that (a) the number of modes in a social plat-
form is not large, and (b) the number of object types
that should be delivered to a newcomer for inspection
should be kept low anyway, to avoid confusion.
The second loop of CrossSense computes the pivot
objects and their worlds by iteratively updating a set
of quadruples, where each quadruple contains infor-
mation required to decide whether a candidate object
will become a pivot object. These information are the
object itself (x), the number of clusterings where x ap-
pears (|∪
i=1...P,B
x,i
6=
/
0
B
x,i
|) (cf. Definition 2), the maxi-
mum number of times x appears within the same clus-
tering (max
P
i=1
|B
x,i
|) and the world W
τ
x
of x. Note that
we store the world of x as a set of pairs (co-occurring
object, number of co-occurrences), which is all infor-
mation needed to compute stability of the world.
Initially, for each perspective P, all n × |P| objects
in ξ
P
are candidates (line 20). But only if x belongs
to less than y/2 clusters in ξ
P
, it is considered for fur-
ther investigation, otherwise x is pruned away (line
21): although it is desirable that x appears in several
perspectives, it is not desirable that it appears in many
clusters of the same perspective, as this indicates am-
biguous semantics (e.g. a tag that appears in both
a cluster with documents on machine learning and a
cluster with documents on robotics). If x fulfills this
condition it is passed to the update function (line 21),
which is shown in Algorithm 2.
Input to the update function is the set X of all
quadruples, the current candidate object o and all
clusters B from current clustering ξ
P
, where o ap-
pears. In a first step we extract from B all objects
that are co-occurring with o and store them as pairs
together with their frequency (number of clusters in B
Algorithm 2. Update.
1: Input:
2: X: Set of all quadruples (x: candidate, a: num-
ber of clusterings where x appears, b: maximum
number of times x appears within single cluster-
ing, W
τ
x
: world of x )
3: o: Candidate object
4: B: All clusters containing o
5: Algorithm:
6: extract W
τ
o
from B as set of pairs (co-occurring
object, number of co-occurrences);
7: if X does not contain quadruple with o then
8: X ← X
S
(o,1,|B|,W
τ
o
);
9: else
10: t is quadruple from X, where t
x
= o;
11: update t
a
= t
a
+ 1;
12: update t
b
= max (t
b
,|B|);
13: update t
W
= t
W
∪W
τ
o
; // sum up co-occurrences
where such an object co-occurs with o) in W
τ
o
(line 6).
If there is not yet a quadruple for candidate object o,
we create one and add it to the set of all quadruples
X (line 8). Otherwise the existing quadruple in X is
updated: the number of clusterings where o appears
is incremented (line 11) and the maximum number of
appearances within a single clustering is updated by
simply taking the maximum as in line 12. And the
world is updated by summing up the frequencies of
objects that are already in the world and in B, and
adding those objects (and frequencies) from B to the
world that have not yet been in it.
In Algorithm 1 we can then compute interesting-
ness and stability for each quadruple in X (line 24)
since all information needed is stored in a quadru-
ple (cf. Definition 2 and Definition 4). Finally in
Algorithm 1 we decide whether a candidate and its
world from X will become a pivot object or not. To do
so, we first rank the candidates by interestingness and
choose the top-m from them. We then check whether
its world is one of the top-q worlds ranked by stabil-
ity. Finally, we can return T that contains the pivot
objects and their worlds.
4 EVALUATION
Objective of the evaluation is to check whether
our mechanism delivers more intuitive semantics for
sensemaking than a baseline that returns the top-k
tags, documents and users associated with a given
pivot object.
CrossSense - Sensemaking in a Folksonomy with Cross-modal Clustering over Content and User Activities
105

4.1 Dataset
To see how our method helps a user in sensemaking
in a folksonomy we use the Bibsonomy dataset. The
data is from the year 2007 and originally comprises
335.789 transactions. A transaction is of the form
(userId, tagId, documentId). This means that the user
with the userId has the tagged the document with the
given documentId with the tag of the given tagId. We
prepared this dataset with a number of steps listed be-
low:
• We removed all transactions with documents that
occur in less than four transactions.
• We removed all transactions with tags that occur
in less than four transactions.
• We removed all transactions with tags that occur
more than 100 times.
The basic idea behind these preparation steps is to re-
move the long tail and to remove very frequent items
that do not contain useful information. After these
preparation steps, from 335.789 transactions 41.729
have remained. Furthermore we split up the data into
four subsets - one subset per quarter of the year. Table
Table 3: Number of transactions and distinct objects for
each quarter of the year 2007.
Quarter Number of Users Tags Docs
Transactions
1 4.696 69 1226 643
2 15.833 81 2330 2024
3 15.143 83 2132 1783
4 6.057 97 1432 791
3 shows for each quarter how many transactions it
contains. Also this table shows how many distinct
objects of each object type there are in each quarter.
4.2 Setup
4.2.1 Homogeneity
To be able to compare quality of Clusters we intro-
duce special homogeneity measures for the Bibson-
omy dataset. To measure homogeneity of a cross-
modal cluster Y
P
| P = {user,tag,document}, we uti-
lize co-occurence counts from objects of different
type in that cluster. We count the number d
u
of doc-
uments in Y
P
that were annotated by the users in that
cluster. We count the number d
t
of documents in Y
P
that were annotated with tags from that cluster. Ho-
mogeneity w.r.t. documents is then measured as
h
d
=
d
u
+ d
t
2 ∗ numDocs
(4)
where numDocs is the number of documents in the
cluster. Similarily we define homogeneity w.r.t. the
other two object types tag and user:
h
t
=
t
u
+t
d
2 ∗ numTags
(5)
h
u
=
u
d
+ u
t
2 ∗ numDocs
(6)
In the above equations, t
u
is the number of tags in
Y
P
that were used by any of the users in that cluster,
t
d
is the number of tags that were used with any of
the documents in that cluster. Respectively, u
d
is the
number of users that have annotated any of the docu-
ments in the cluster and u
t
is the number of users that
have used any of the tags in the cluster.
(a) (b)
Figure 2: Homogeneity (left) and corresponding baselines
(right).
4.2.2 Baseline
In order to get a baseline for a particular cluster we
use an approach of two steps:
• First, for each object type in Y
P
we choose a ran-
dom object from the cluster.
• Then we try to find the top-n most similar objects
of the same type from the database, for each ob-
ject type.
This gives us a baseline cluster with top-n times |P|
objects. As similarity measure in the second step, we
use a straight forward approach by adapting a tech-
nique proposed in (Markines et al., 2009a): We flatten
the 3-mode data to 2-dimensional space and measure
similarity as the euclidian distance between objects
in that space. For the process of flattening, we use
the same procedure as in algorithm 1. For example,
to find the most similar tags to a given tag, we first
create a 2-dimensional matrix where rows are docu-
ments, columns are tags and where an entry is the fre-
quency the document was annotated with the tag by
any user. This gives a frequency vector for each tag
and distances between these vectors can be computed
by applying standard measures like cosine similarity.
Analogous we do this to find most similar users and
documents for a given user or document.
KDIR 2010 - International Conference on Knowledge Discovery and Information Retrieval
106

(a) (b) (c)
Figure 3: Homogeneity h
u
(left), h
t
(middle) and h
d
(right) for first 20 clusters derived from core-tensor, compared to base-
lines. Left bar: derived cluster; Right bar: baseline.
Table 4: First three cross-modal clusters derived from dataset of first two quarters.
Cluster Tags Documents
1 semantics, taggingsemantic, Trend Detection in Folksonomies. Emergent Semantics in BibSonomy.
semantictagging, tagging, FolkRank: A Ranking Algorithm for Folksonomies. TRIAS - An Algorithm for
library Mining Iceberg Tri-Lattices. Proceedings of the First Workshop on Semantic
Network Analysis.
2 poetry, poebeat, poems, Dream Haibun. Implacable Time and the Long, Slow Pull of the Irresistible
poets, poetics Sun. Across the Table. Going on About Haibun. Divorce Ceremony.
3 magnetic, resonance, Diffusion tensor imaging in multiple sclerosis: a tool for monitoring changes
brain, humans, image in normal-appearing white matter. Applications of diffusion tensor MR imaging
in multiple sclerosis. Diffusion tensor imaging of cerebral white matter: a
pictorial review of physics, fiber tract anatomy, and tumor imaging patterns.
Diffusion tensor imaging of early relapsing-remitting multiple sclerosis with
histogram analysis using automated segmentation and brain volume correction.
The pathogenesis of lesions and normal-appearing white matter changes in
multiple sclerosis: a serial diffusion MRI study.
4.3 Results
In a first experiment we investigate how homogene-
ity of cross-modal clusters develops, compared to the
baseline, when clusters are sorted by energy values
provided by the core-tensor. As described in Section
2.1, the core tensor can be used to decide which eigen-
vectors to choose to form a cross-modal cluster. The
greater an entry in the core-tensor, the greater the cor-
relation between corresponding eigenvectors. We uti-
lize this property to show how homogeneity of these
clusters develops w.r.t. correlation-strength between
the different eigenvectors. To do so, we first order the
entries of the core-tensor by size (descending) and we
then create all the corresponding cross-modal clus-
ters. We measure homogeneity h
d
of these clusters
and their corresponding baselines as described above.
As dataset we use first two quarters from all transac-
tions. Results are shown in Figure 2.
A first observation is that as correlation decreases,
the homogeneity decreases as well (in both plots).
Also it can be seen that clusters from the baseline
are often of less homogeneity than their correspond-
ing clusters from our method.
To see things in greater detail, in Figure 3 we show
only the first 20 clusters, directly compared to their
baselines for all three homogeneity measures.
For each cluster there are two bars: left bar is ho-
mogeneity of the cluster, right bar is homogeneity of
its baseline. In all three plots, the great majority of
clusters derived by our method is of equal or greater
homogeneity than the baseline. Only in few cases (six
for h
u
, five for h
t
and six for h
d
) the homogeneity of
baseline clusters is greater. Also an interesting obser-
vation is that homogeneity measures based on docu-
ments (h
d
) is on average greater than the values mea-
sured based on tags (h
t
) which on average are greater
than the values measured based on users (h
u
). The
worse result for h
u
may stem from the fact that there
are only few distinct users in the dataset (cf. Table 3),
but much more distinct tags and documents.
To give a better impression what the actual clus-
ters look like, in Table 4 we show the contents of first
three cross modal clusters, derived from data of first
two quarters. We show the top-5 objects of each type,
for documents we show the title of the document. For
anonymization reasons we do not show the names of
the users in the clusters. The table shows that the
top three cross modal clusters are of the different top-
ics semantic tagging, poetry and magnetic resonance
CrossSense - Sensemaking in a Folksonomy with Cross-modal Clustering over Content and User Activities
107

(a)
(b)
Figure 4: Interestingness for all unique objects from all per-
spectives. Top: based on data from q1; Bottom: data from
q1 and q2.
imaging. It can also be seen that within one cluster
documents and tags are from the same topic.
In a second experiment we investigate how inter-
estingness is distributed among all users, tags and
documents. Therefor we first derive all unique ob-
jects of a certain type (e.g. all unique users) from all
clusterings across all perspectives. Then we compute
interestingness values for each of these objects and
plot them in descending order. We show the result in
Figure 4.
One observation is that different object types have
completely different levels of interestingness. For ex-
ample in the first plot, interestingness of top users is
always less than interestingness of top tags or top doc-
uments. Also we can see that the number of distinct
objects strongly varies between different object types.
There are much less distinct users than distinct tags or
documents. On the other hand, the results do not dif-
fer very much if we use twice as much data (two quar-
ters in plot b). Also it can be seen that interestingness
decreases fast, there are relatively few objects of each
type, that have very high interestingness values.
For the next experiment we apply a slightly ad-
justed version of our algorithm. We do not derive
top-m pivot objects and their worlds from all objects
across all object types. Rather we investigate each ob-
ject type and derive top-m=30 objects from each type
together with the worlds. We do so to get better in-
sight how results are influenced by choice of object
type, when objects are sorted decreasing on interest-
ingness. Thus, we derive the top-m users, top-m tags
and top-m documents (m=30), ordered on interesting-
ness, and derive their worlds. We show the size of
these worlds in Figure 5. Each bar shows the size of
the world of the corresponding object. The bars are
of up to three parts: bright is the fraction of users,
grey is the fraction of tags and dark is the fraction
of documents. From the figure we see that depend-
ing on object type the size of worlds can vary heavily.
Note that a world can be empty, which is the case if
the number of co-occurrences of an object with the
candidate object is always less than τ. For top user
worlds the size increases with decreasing interesting-
ness. Another observation is that the fraction of doc-
uments is decreasing. The sizes of top tag worlds
are independent from interestingness values. In docu-
ment worlds, with decreasing interestingness, the size
of the world decreases as well.
In Figure 6 we show for each of the worlds corre-
sponding stability values. For the case that a world is
empty, its stability is equal to zero. We can observe
that stability of worlds is independent from size of the
worlds. There can be small worlds that are more sta-
ble that big worlds and vice versa. Also stability is not
influenced by interestingness. There can be worlds of
less interesting candidate objects that are still stable.
In a final experiment we measure diversity be-
tween the worlds we derived with CrossSense and
compare it with diversity of worlds derived as a base-
line, based on co-occurrences of original data objects.
For the newcomer who wants to get an overview of
the folksonomy it is desired that the worlds presented
to her are diverse from each other. Otherwise there
would not be much information from the objects and
their relation in the folksonomy. In particular the
baseline worlds are derived in two steps: First we de-
rive top-m most frequent objects of each type, which
are the candidate objects. Baseline worlds are then
composed of top-n=10 most frequently co-occurring
objects from the other two types and top-n most sim-
ilar objects of the same type as the candidate object
(Similarity is computed the same way as for the base-
line in Section 4.2.2.). Diversity between two worlds
KDIR 2010 - International Conference on Knowledge Discovery and Information Retrieval
108
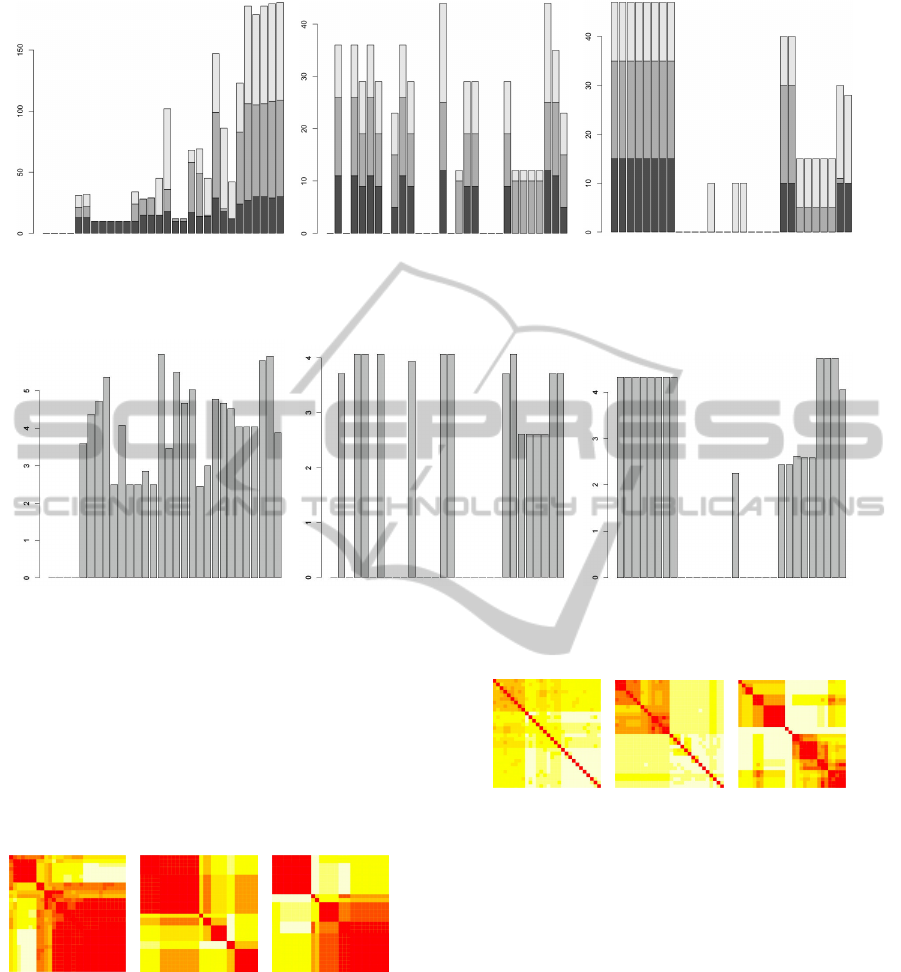
(a) (b) (c)
Figure 5: Size of worlds for top-m=30 candidate objects, for each object type. Left: worlds for user-candidate objects; Middle:
for tags; Right: for documents.
(a) (b) (c)
Figure 6: Corresponding stabilities for all worlds.
is then computed by subtracting the intersection from
the union of the two worlds and taking the cardinal-
ity from this set, which is equal to the number of ob-
jects that occur in one world but not in the other. Di-
versities between worlds derived with CrossSense are
shown in Figure 7. Diversity between baseline worlds
is shown in Figure 8.
(a) (b) (c)
Figure 7: Diversity between top worlds derived with
CrossSense. Left: user worlds, Middle: tag worlds, Right:
document worlds.
The worlds used in Figure 7 are the same as the
worlds in Figure 5 and Figure 6. The left heatmap
shows diversity of each user world compared with all
other user worlds. When diversity of a world com-
pared with itself is computed, the value is equal to
zero, since union-intersection is the empty set in this
case. Thus, on diagonal color is dark which means
(a) (b) (c)
Figure 8: Diversity between corresponding top baseline
worlds.
that value of diversity is low (bright color means that
diversity between the two worlds is high). In the
left heatmap we can observe that there are two main
blocks of dark color. This can be interpreted as there
are two main types of user worlds that are really di-
verse from each other. From tag worlds we can find
at most six worlds that differ much from each other.
From document worlds there are two big groups of
worlds and two single worlds that differ a lot from
each other. The left heatmap of Figure 8 gives the
impression that all worlds are very diverse from each
other since color is bright everywhere (except on di-
agonal). But when looking at the actual values of
diversity (also baseline user and tag worlds) it be-
comes clear that all the worlds are actually very sim-
ilar to each other (differing only slightly) and on di-
CrossSense - Sensemaking in a Folksonomy with Cross-modal Clustering over Content and User Activities
109

agonal they are identical (differing not at all). Still
the heatmap distributes the values on the entire range
from dark to bright. Note that this is not the case for
heatmaps in Figure 7! To summarize observations of
diversity - our method finds groups of worlds that are
diverse from each other while the baseline worlds are
very similar to each other. Also diversity of worlds
is dependent of object type that is chosen for the can-
didate object. For example our method derives two
diverse groups of user worlds but six diverse groups
of tag worlds.
5 RELATED WORK
Objective of CrossSense is to provide a user with an
overview of a folksonomy, not just a summary of its
contents. This corresponds to sensemaking, as the
term is used by Golder and Huberman (Golder and
Huberman, 2006), except that we do not refer to the
set of resources tagged by a user but to all resources,
as tagged by all users. This implies capturing and ex-
ploiting the relationship among users, resources (doc-
uments) and tags, as is typically done in tensor-based
analysis of social platforms (see e.g. (Symeonidis
et al., 2010).
Tensors are attracting increasing usage in data
mining applications, especially for clustering com-
plex data. (Banerjee et al., 2007) propose a principled
multi-way clustering framework for relational data,
wherein different types of entities are simultaneously
clustered based not only on their intrinsic attribute
values, but also on the multiple relations between the
entities. Abdu and Salane present a novel spectral-
based algorithm for clustering categorical data that
combines attribute relationship and dimension reduc-
tion techniques found in Principal Component Anal-
ysis and Latent Semantic Indexing (Abdu and Salane,
2009). The web clustering method of (Zhou et al.,
2009) aggregates web objects into various categories
according to underlying relationships among them;
it uses tensor decomposition to co-cluster web ob-
jects based on the analysis of user navigational tasks.
These methods successfully derive groups of asso-
ciated objects from a tensor, but do not address the
problem of presenting a small, yet representative sub-
set of these objects to the user.
Content summarization has been investigated in
the context of deriving a summary from one or
more documents and in the context of providing an
overview of an archive’s content. The second context
is relevant here and includes methods that study sum-
maries of text databases, like (Ipeirotis et al., 2005),
text clustering and cluster labeling, like (Aggarwal
and Yu, 2006), and topic modeling like Probabilis-
tic Latent Semantic Indexing (Hofmann, 2001). Such
methods can be transferred into tensor-based clus-
tering. For example, the aforementioned method of
Abdu and Salane uses data summaries that consist
of attribute occurrence and co-occurrence frequencies
to create a set of vectors, called ”candidate cluster
representatives”, each of which represents a cluster
(Abdu and Salane, 2009). Although such represen-
tatives are human-readable, they are not intended to
serve as a description of a social platform, and they
can be argued to be less intuitive than a list of repre-
sentative documents, users and tags, as delivered by
CrossSense.
The importance of comprehensible cluster labels
is stressed in (Osinski, 2006), where different matrix
factorizations are used to organize document sum-
maries into human-interpretable thematic categories.
Albeit summarization refers to summaries of single
documents (first type of context summarization men-
tioned above), the main emphasis is on what the au-
thor calls ”description-comes-first clustering” of these
summaries. The method is confined to text clusters
though and has not been designed to deal with other
types of features.
Remotely related to our work are studies on as-
sessing the semantics of tags: Heymann and Garcia-
Molina use a hierarchical clustering algorithm to
build a semantic hierarchy of tags; the algorithm
operates upon a tag similarity graph, and takes tag
centrality of this graph and co-occurrence of tags
on documents into account (Heymann and Garcia-
Molina, 2006). The concept of semantic grounding
is discussed in (Cattuto et al., 2008; Markines et al.,
2009b): it refers to finding the meaning of a tag by
consulting WordNet or similar resources. Such works
are orthogonal to ours, since their aim is to extract
and present the semantics of the tags in the platform,
rather than an overview of the platform itself.
6 CONCLUSIONS
We addressed the problem of sensemaking in a folk-
sonomy. We wanted to present the user a minimal set
of objects that describe the folksonomy from different
perspectives and helps the user to get an overview of a
particular domain she is interested in. We developed
our new algorithm CrossSense that selects themati-
cally interesting objects (that we call pivot objects)
and associates other objects of the folksonomy with
them (that we call the pivot objects world). These
pivot objects and their worlds are presented to the user
to help her in sensemaking in the folksonomy.
KDIR 2010 - International Conference on Knowledge Discovery and Information Retrieval
110

We developed an interestingness measure for pivot
objects to be able to decide which objects are more
relevant in sensemaking. In our experiments (on a
Bibsonomy dataset) we showed that, compared to a
baseline, groups of objects associated with the pivot
objects are of greater homogeneity than groups de-
rived from a baseline. Also we showed that with
decreasing interestingness, homogeneity decreases as
well. In another experiment we showed that depend-
ing on type of pivot objects (which may be user, tag
or document), structure of worlds can be completely
different. This shows that it makes a great difference
from which object type a newcomer would like to dis-
cover the folksonomy. Furthermore we could show
that worlds derived by our method differ from each
other, while baseline worlds are similar to each other.
This is desired since the newcomer expects different
worlds describing the folksonomy from different per-
spectives to be different in the objects these worlds
consist of.
REFERENCES
Abdu, E. and Salane, D. (2009). A spectral-based clustering
algorithm for categorical data using data summaries.
In KDD Workshop on Data Mining using Matrices
and Tensors.
Aggarwal, C. C. and Yu, P. S. (2006). A Framework
for Clustering Massive Text and Categorical Data
Streams. In Proceedings of the SIAM conference on
Data Mining 2006.
Banerjee, A., Basu, S., and Merugu, S. (2007). Multi-way
clustering on relation graphs. In SDM.
Begeman, G., Keller, P., and Smadja, F. (2006). Automated
tag clustering: Improving search and exploration in
the tag space. In Proceedings of the WWW’2006
Workshop on Collaborative Web Tagging.
Cattuto, C., Benz, D., Hotho, A., and Stumme, G. (2008).
Semantic grounding of tag relatedness in social book-
marking systems. In ISWC ’08: Proceedings of the
7th International Conference on The Semantic Web,
pages 615–631, Berlin, Heidelberg. Springer-Verlag.
de Gemmis, M., Lops, P., Semeraro, G., and Basile, P.
(2008). Integrating tags in a semantic content-based
recommender. In RecSys ’08: Proceedings of the
second ACM Conference on Recommender Systems,
pages 163–170, Lausanne, Switzerland. ACM.
Golder, S. and Huberman, B. (2006). Usage patterns of
collaborative tagging systems. Journal of Information
Science, 32(2):198–208.
Heymann, P. and Garcia-Molina, H. (2006). Collaborative
creation of communal hierarchical taxonomies in so-
cial tagging systems. Technical report, InfoLab, Com-
puter Science Department, Stanford University.
Hofmann, T. (2001). Unsupervised learning by proba-
bilistic latent semantic analysis. Machine Learning,
42(1):177–196.
Ipeirotis, P., Ntoulas, A., Cho, J., and Gravano, L. (2005).
Modeling and managing content changes in text
databases. In Proceedings of the IEEE Int. Conf. on
Data Engineering (ICDE’05).
Markines, B., Cattuto, C., Menczer, F., Benz, D., Hotho,
A., and Stumme, G. (2009a). Evaluating similarity
measures for emergent semantics of social tagging.
In WWW ’09: Proceedings of the 18th international
conference on World wide web, pages 641–650, New
York, NY, USA. ACM.
Markines, B., Cattuto, C., Menczer, F., Benz, D., Hotho,
A., and Stumme, G. (2009b). Evaluating similarity
measures for emergent semantics of social tagging. In
WWW’09, pages 641–650, Madrid, Spain.
Osinski, S. (2006). Improving quality of search results clus-
tering with approximate matrix factorisations. In Pro-
ceedings of the European Conf. on Information Re-
trieval (ECIR’06), LNCS 3936, pages 167–178.
Sun, J., Tao, D., and Faloutsos, C. (2006). Beyond streams
and graphs: dynamic tensor analysis. In KDD ’06:
Proceedings of the 12th ACM SIGKDD international
conference on Knowledge discovery and data mining,
pages 374–383, New York, NY, USA. ACM.
Symeonidis, P., Nanopoulos, A., and Manolopoulos, Y.
(2010). A unified framework for providing recom-
mendations in social tagging systems based on ternary
semantic analysis. IEEE Transactions on Knowledge
and Data Engineering, 22(2):179–192.
Zhou, Q., Xu, G., and Zong, Y. (2009). Web co-clustering
of usage network using tensor decomposition. In WI-
IAT ’09: Proceedings of the 2009 IEEE/WIC/ACM In-
ternational Joint Conference on Web Intelligence and
Intelligent Agent Technology, pages 311–314, Wash-
ington, DC, USA. IEEE Computer Society.
CrossSense - Sensemaking in a Folksonomy with Cross-modal Clustering over Content and User Activities
111
