
INVESTIGATION OF CHANGES IN KINETIC TREMOR
THROUGH ANALYSIS OF HAND-DRAWING MOVEMENTS
Differences between Physiological and Essential Tremors
Maria Fernanda S. Almeida, Guilherme L. Cavalheiro, Adriano O. Andrade
Biomedical Engineering Laboratory, Faculty of Electrical Engineering, Federal University of Uberlândia, Campus Santa
Mônica, Bloco 1E, Av. João Naves de Ávila, 2121, Uberlândia, Minas Gerais, 38.408-100, Brazil
Daniel A. Furtado, Adriano A. Pereira
Biomedical Engineering Laboratory, Faculty of Electrical Engineering
Federal University of Uberlândia, Uberlândia, Brazil.
Keywords: Physiological tremor, Essential tremor, Tremor detection, Tremor analysis, Archimedes' spiral.
Abstract: Tremor is the most common movement disorder characterized by repetitive and stereotyped movements.
Tremor can be classified in many ways, depending on its phenomenology, frequency and location. The data
collection conducted under kinetic conditions and while performing a voluntary movement highlights the
kinetic tremor. The analysis of hand-drawing movements is commonly used in the evaluation of patients
with tremor. In this study, a number of features extracted from tremor activity, obtained from digitized
drawings of Archimedes’ spirals, were analysed. The analyses followed the sequence bellow: 1 –
Linearization of the spiral of Archimedes; 2 – Estimate of tremor activity; 3 – Data pre-processing; and 4 –
Feature extraction from the tremor activity. The statistical analysis of the extracted features was able to
prove the differences between physiological and essential tremors collected under kinetic conditions.
1 INTRODUCTION
Tremor is an involuntary, rhythmic, oscillatory
movement of a body part that can be classified in
many ways, depending on is aetiology,
phenomenology, frequency and location. (Mansur et
al., 2007, Smaga, 2003) The movement caused by
tremor can be associated to factors such as
neurological disorders and natural processes. (De
Lima et al., 2006, Deuschl et al., 1995) The former
is called pathological tremor whereas the latter is
often referred as physiological tremor. (Almeida et
al., 2010) The physiological tremor occurs normally
in healthy individuals and, generally, it cannot be
observed by the naked eye. (Almeida et al., 2010)
An example of pathological tremor is the
essential tremor. This type of tremor is a visible
postural tremor of hands and forearms that may
include kinetic component. (Smaga, 2003) Essential
tremor is the most common movement disorder in
the world.
In both essential and physiological tremors, the
amplitude of tremor increases with stress, fatigue,
certain medications and voluntary activities. (Smaga,
2003) Although this, both types of tremor presents a
kinetic component that can be accessed through the
analysis of hand-drawing movements.
Hand-drawing patterns are commonly assessed
by means of visual rating scales. (Almeida et al.,
2010, Louis et al., 1998) However, scales provide
only crude subjective estimates of tremor amplitude.
The use of digitizing tablets is common and provides
the possibility of tremor activity detection under
kinetic conditions. (Almeida et al., 2010) Although
this, the use of this method for tremor detection is
simply, versatile, non-invasive and can provide an
electronically measure of tremor, reducing the
subjectivity and limitation of some methods based
on visual scales. (Almeida et al., 2010)
The digitizing tablet is able to inform the
coordinates (x and y) of the tip of the pen on its
surface while the subjects perform the drawing. In
393
S. Almeida M., L. Cavalheiro G., O. Andrade A., A. Furtado D. and A. Pereira A..
INVESTIGATION OF CHANGES IN KINETIC TREMOR THROUGH ANALYSIS OF HAND-DRAWING MOVEMENTS - Differences between Physiologi-
cal and Essential Tremors.
DOI: 10.5220/0003121703930398
In Proceedings of the International Conference on Bio-inspired Systems and Signal Processing (BIOSIGNALS-2011), pages 393-398
ISBN: 978-989-8425-35-5
Copyright
c
2011 SCITEPRESS (Science and Technology Publications, Lda.)

this study, a standard drawing pattern was fixed on
the surface of the device and the subjects were asked
to follow it. The selected drawing pattern is the
spiral of Archimedes, used in other studies for being
smooth and easily understood by subjects.
There are many studies concerning the
employment of digitizing tablets for the
quantification of physiological and pathological
tremors. (Elble et al., 1996, Feys et al., 2007, Liu et
al., 2005, Mergl et al., 1999) However, no study
focusing in the use of this device for investigation of
kinetic changes between physiological and essential
tremor was found in our literature survey.
In order to contribute to the understanding of
changes in kinetic tremor between physiological and
essential tremors, this study proposes to quantify
tremor by means of the analysis of digitized hand-
draw drawings of a clinically healthy individual and
an individual diagnosed with essential tremor.
2 MATERIALS AND METHODS
Two subjects participated in our experiments. The
first subject did not present clinical evidences of
suffering from any neurological disorder. The
second subject was diagnosed with essential tremor.
Prior to data collection the subjects signed a
Consent Form approved by the Ethical Committee of
the Federal University of Uberlândia, Brazil.
The subjects were asked to sit in a comfortable
chair with their feet flat on the floor and with their
back straight. The digitizing tablet, shown in Figure
1, was placed on a table properly positioned in front
of the subjects.
Figure 1: Digitizing tablet with the standard drawing
pattern fixed on its surface. In this study, the selected
drawing pattern is the spiral of Archimedes.
After verbal and written explanation about the
exam the subjects were asked to draw two samples
of a Spiral of Archimedes with their dominant hand.
The arms of the subjects were not supported during
the execution of the task. The first sample was
collected with the subject drawing the spiral from its
centre to its extremity (outgoing spiral - OS),
whereas for the second sample the subject drew the
spiral from its extremity to its centre (ingoing spiral
- IS). This procedure was repeated three times for
each subject. The subjects were asked to draw the
spiral at their natural speed. The collected spirals
were digitized at 64 Hz through a digitizing tablet
(Trust, model TB-4200) with resolution of 120
lines/mm.
2.1 Data Analysis
The analysis followed, for each data sample, the
sequence of steps below:
Linearization of the spiral;
Estimate of the tremor activity;
Data pre-processing;
Feature extraction from the tremor activity.
2.1.1 Linearization of the Spiral
The spiral of Archimedes is a geometrical shape that
has a uniform distance between its turns equal to
2πb. This kind of spiral can be represented by Eq.
(1) in polar coordinates, where r is the radius, θ the
angle, a and b are constants.
=+
(1)
The step of linearization consists in representing
the original and coordinates of the spiral in
terms of radius () and angle () as shown from Eqs.
(2) to (4).(Pullman, 1998) The linearization of a
perfect spiral results in a straight line as shown in
Eq. (5) and depicted in Figure 2, where is the
slope of the straight line.
=sin()
(2)
= cos ()
(3)
=
+
(4)
=
(5)
2.1.2 Estimate of the Tremor Activity
The estimate of the tremor activity is carried out
by Eq. (6), where
is the ideal spiral (template)
and
is the spiral drawn by the subject.
=
−
(6)
Figure 3A shows spirals obtained from the
subjects that participated on the study. In the figures
the template spiral and its linearized version (Figure
3B) are in black, whereas the actual spiral and its
BIOSIGNALS 2011 - International Conference on Bio-inspired Systems and Signal Processing
394
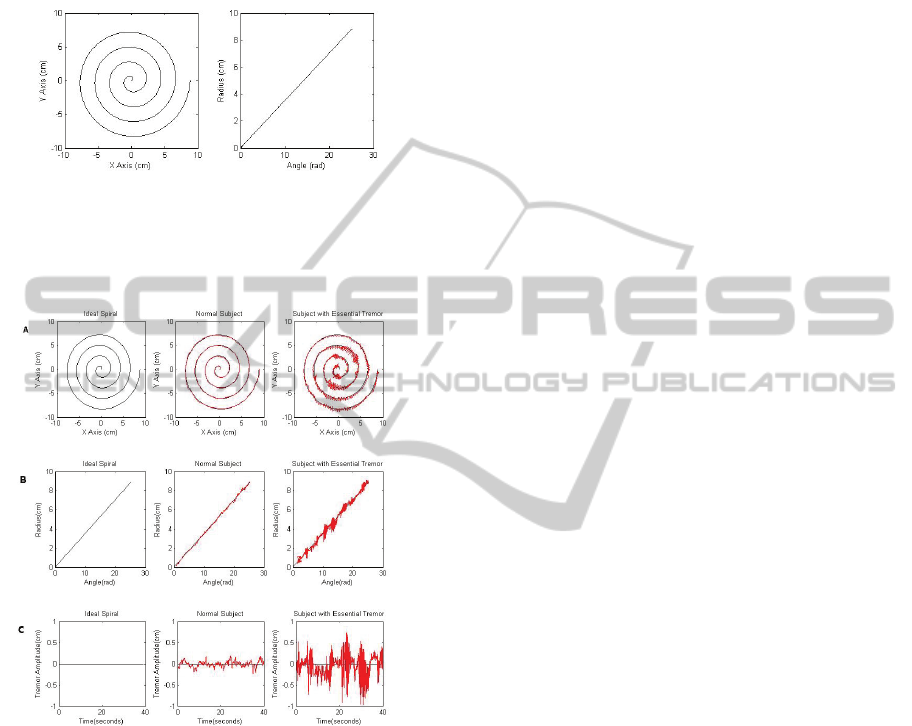
linearization are in red. The tremor activity (Figure
3C) is also presented for each case. Note that is a
random time-series and, therefore, it is possible to
employ standard techniques for time-series analysis
in order to extract information from it.
Figure 2: Illustration of the process of linearization of an
ideal spiral of Archimedes. The spiral in the left panel is
converted into a straight line in polar coordinates, which is
shown in the right panel. This transformation eases the
process of tremor estimate from hand-drawn spirals.
Figure 3: Example of the application of the process of
linearization for an ideal spiral and two typical patterns
obtained from hand-drawn spirals of normal subject and
subject diagnosed with essential tremor. In (A) the spiral
drawn by each subject is compared against the ideal spiral.
In (B) the system coordinates are converted into polar
coordinates and the results of each subject are contrasted
to the ideal straight line, which represents the spiral in
polar coordinates. In (C) the tremor activity obtained for
each subject is shown. This activity is obtained by
subtracting the ideal spiral from the hand-drawn spiral in
polar coordinates.
2.1.3 Data Pre-processing
The tremor activity may be composed of: (i) the
inherent noise of the digitizing tablet, which is a
low-frequency noise (<0.1 Hz) as suggested by the
manufacturer; (ii) voluntary movement whose
energy is mostly limited to frequencies below 1 Hz;
(Feys et al., 2007, Liu et al., 2005, Ulmanová et al.,
2007) (iii) and the specific-task physiological
tremor which is characterized by involuntary
movements and energy mostly between 4 Hz and 10
Hz or the essential tremor with energy between 4 Hz
and 12 Hz. (Elble et al., 1996, Miralles et al., 2006,
Elble et al., 1990, Pullman, 1998, Smaga, 2003,
Bhagwath, 2001)
Therefore, we applied a linear filter in order to
obtain the tremor activity signals for analysis. This
activity was filtered by using a fourth-order digital
band-pass Butterworth filter. As the frequency
response of the filter is not ideal we set its lower and
upper cutoff frequencies to 2.5 Hz and 20 Hz with
the aim of preserving the bandwidth of interest. This
bandwidth was carefully defined to capture the full
tremor component in task-specific tremor, typically
in the frequency range between 4 and 12 Hz (Elble
et al., 1996, Miralles et al., 2006, Elble et al., 1990,
Pullman, 1998, Smaga, 2003, Bhagwath, 2001), and
also to avoid major influence of voluntary
movements whose energy is normally concentrated
in frequencies below 1 Hz. (Feys et al., 2007, Liu et
al., 2005, Ulmanová et al., 2007)
Frequency analysis (energy estimate) was
performed on the filtered signal by using the
Welch’s method with a 32 data point Hanning
window. Figure 4 illustrates the signal before and
after filtering. Figures 4a and 4b show, respectively,
a signal collected from the normal subject and the
subject diagnosed with essential tremor before
filtering. Figures 4c and 4d are filtered versions of
the signals shown in Figures 4a and 4b, respectively.
The waveform depicted in Figure 4d shows an
increase in amplitude when compared to the one in
Figure 4c.
2.1.4 Feature Extraction from the Tremor
Activity
In order to assess and quantify the tremor activity a
number of traditional features were used. Each
feature is described below:
Frequency domain features: from the power
spectrum of the signal, obtained from the
Fourier Transform, the following features were
estimated: mean frequency, peak frequency,
frequency of 50% and frequency of 80%.
Detrended fluctuation analysis (DFA): is a tool
for analysis of random signals that estimates the
exponent which may characterize the nature
of time-series. (Delignieres D, 2003, Norris et
al., 2005)
INVESTIGATION OF CHANGES IN KINETIC TREMOR THROUGH ANALYSIS OF HAND-DRAWING
MOVEMENTS - Differences between Physiological and Essential Tremors
395
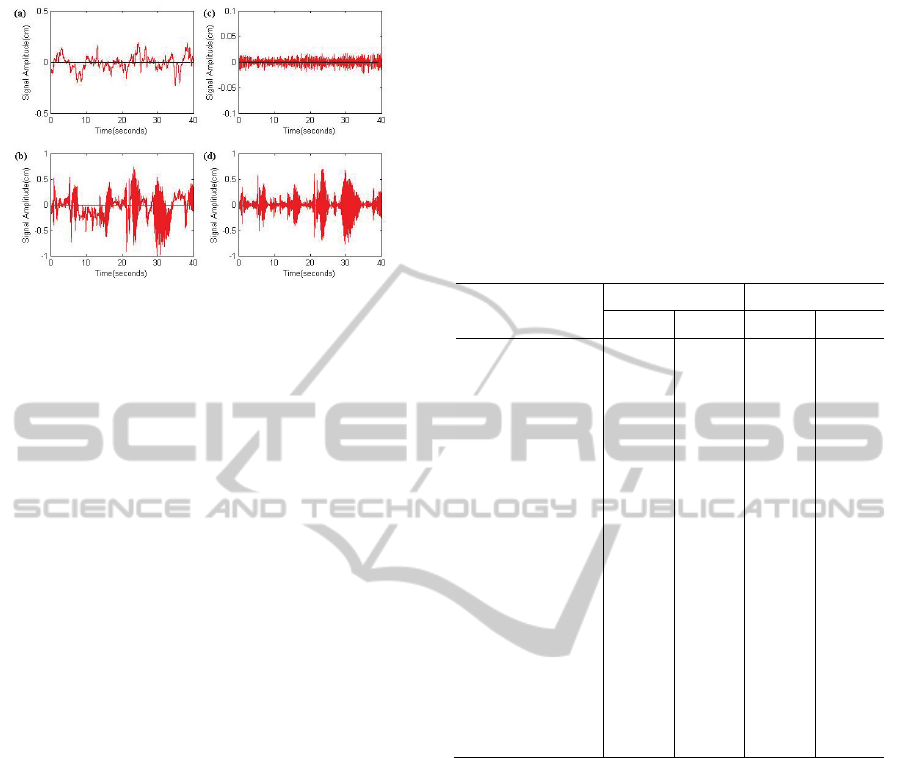
Figure 4: Illustration of the effect of filtering applied to
collected signals from normal subject (a, c) and subject
diagnosed with essential tremor (b, d). The non-filtered
signals are depicted in (a, b) whereas their filtered versions
are depicted in (c, d), respectively.
Mean speed: is the average of the instantaneous
velocity.
Total displacement: is calculated by summing
up all the distances from two consecutive
samples.
Root mean square: also known as quadratic
mean, the Root Mean Square (RMS) is a
statistical measure of the magnitude of a
varying quantity.
Approximate entropy: is a tool used to quantify
the regularity of a signal.
First order smoothness: This tool can
characterize imperfections in spirals drawn by
the subjects. The calculation of this feature is
based on the overall deviation of the spiral, in
such a way that an ideal spiral results in a value
of the first order smoothness equal to zero.
(Pullman, 1998)
Second order smoothness: the second order
smoothness can be defined as the rate of change
of first order smoothness.
Residual: this feature reflects the total distance
between the spiral after the process of
linearization and a line of best fit on the radius
vs. angle graph. The larger this value is the
more spiral changes its shape in an irregular
way. (Pullman, 1998)
Zero crossing rate: is a measure of irregularity
of the signal and shows how frequently values
cross their own value.
3 RESULTS
Table 1 shows the values of extracted features for
two data collection protocols, i.e., Ingoing spiral (IS)
and Outgoing spiral (OS). The analysis of variance
(ANOVA) was applied for each protocol and
feature. A probability value (p-value) less than 0.05
( < 0.05) was considered as a threshold for
significance analysis. A 95% confidence bound were
used on the value of the statistic. Features that
yielded significant differences between the subjects
are highlighted with an asterisk (*) in Table 1.
Table 1: Mean values obtained for each feature and
protocol (ingoing and OS).
Feature
Physiological Tremor Essential Tremor
Outgoing
Spiral
Ingoing
Spiral
Outgoing
Spiral
Ingoing
Spiral
Frequency of 50% *
4.417 4.417 5.750 5.667
Frequency of 80%
6.833 7.083 6.750 6.667
Mean Frequency *
4.818 4.883 5.711 5.660
Peak Frequency *
3.167 3.250 5.750 5.667
Total Displacement *
0.064 0.071 1.339 1.219
Standard Deviation *
0.007 0.007 0.165 0.163
Approximate Entropy *
0.351 0.329 0.282 0.286
First Order Smoothness
10.099 13.751 16.043 17.534
DFA *
1.661 1.652 2.024 2.030
Mean
-4.9x10
-6
-4.1x10
-5
1.2x10
-4
5.9x10
-5
Residual *
0.069 0.066 0.236 0.257
RMS Mean *
0.007 0.007 0.165 0.163
Second Order Smoothness
27.398 38.438 37.647 40.271
Variance *
4.5x10
-5
5.4x10
-5
0.027 0.027
Mean Speed *
0.175 0.195 4.077 4.055
Zero Crossing Rate
488.667 450.667 587.333 462.667
4 DISCUSSION
The linearization of the espiral of Arquimedes was
performed as the first step in the data analysis.
Although the linearization step does not offer any
new information, it is extremely useful in the
analysis of the spiral, as it is responsible for
replacing the coordinates and by new ones,
giving rise to a linear relationship between them.
(Pullman, 1998)
Through this transformation, the mathematical
computational operations become easier and faster,
making it possible to analyze crucial aspects of the
drawing of the spiral. When comparing the straight
line obtained by means of the radius-angular
transformation of the ideal spiral with that generated
from an actual spiral, drawn by a subject, it is
possible to detect irregularities. (Pullman, 1998)
BIOSIGNALS 2011 - International Conference on Bio-inspired Systems and Signal Processing
396

After the linearization step, a linear filter was
applied in order to obtain the tremor activity signals
for analysis. The definition of the linear filter’s
bandwidth (2.5 Hz and 20 Hz) was an important step
to preserve the bandwidth of interest and to avoid
major influence of voluntary movements, whose
energy is normally concentrated in frequencies
below 1 Hz. (Feys et al., 2007, Liu et al., 2005,
Ulmanová et al., 2007)
According to Elble et al.,(Elble et al., 1996) the
acts of writing and drawing constrict the range of
tremor frequencies. Furthermore, the frequency of
physiological tremor quoted in several studies (8-12
Hz) refers to tremor signals collected by
accelerometry. (Timmer et al., 1998, Raethjen et al.,
2000, Morrison et al., 2006) Moreover, the
frequency of essential tremor may suffer a
constriction either, since most studies face this type
of tremor as essentially postural. In both cases, the
data collection made under a postural tremor
protocol will present differences in frequency when
compared to kinetic paradigm.
From the analysis of Table 1 is possible to
conclude that the features that provided a significant
difference between the two individuals in analysis,
for the Outgoing Spiral (OS) and Ingoing Spiral (IS)
protocols, are: frequency of 50%, mean frequency,
peak frequency, total displacement, standard
deviation, DFA, approximate entropy, residual,
RMS mean, variance and mean speed.
The values of RMS, variance and standard
deviation show that the essential tremor activity had
larger displacement amplitude compared to the
physiological tremor activity. As in probability
theory the variance of a random variable is a
measure of statistical dispersion and the results show
that the essential tremor activity presented a larger
value of variance, it is possible to conclude that the
distribution of the essential tremor activity is more
spread out than that of the physiological tremor
activity.
The mean speed values were smaller for the
physiological tremor signals and, consequently, the
total displacement of the tremor activity was larger
in the essential tremor activity. Additionally,
through the analysis of the DFA and Approximate
Entropy, we can observe a change in the randomness
of the signal, i.e., the essential tremor activity has
higher predictability than that obtained for the
physiological tremor activity as suggested by the
increase of the DFA coefficients and the reduction
of the Entropy values.
The analysis of the features First Order
Smoothness and Second Order Smoothness in Table
1 allow us to conclude that in general subjects
presented more difficulty to draw the spiral towards
its centre. This is based on the fact that these
features can characterize imperfections in the traces
made by subjects, i.e., the larger their amplitudes the
more imperfect the trace is. The results depicted in
Table 1 support this assumption by showing an
increase in the feature amplitudes.
The main limitation of the obtained results is
with regard to the number of studied subjects.
However, the results show that is possible to
discriminate physiological and essential tremors
through the analysis of hand-draw movements, i.e.,
under kinetic conditions. Despite this limitation, this
research introduced a way of analyzing kinetic
tremor activity for the characterization of
physiological and essential tremors.
5 CONCLUSIONS
In this study, different from other researches, we
addressed the issues of quantifying physiological
and essential tremors under kinetic conditions. For
this, we investigated the tremor activity obtained
from a normal subject and a subject diagnosed with
essential tremor.
The study showed that digitizing tablets can be
used to make the evaluation of hand-drawing
movements. Moreover, the analysis of these
drawings makes possible the differentiation between
healthy subjects and that diagnosed with a type of
pathological tremor.
The analysis of physiological and essential
kinetic tremors of individuals may be an important
tool for the characterization of tremors. The results
obtained through this technique may be evaluated in
the context of the patient’s history and correlated
with neurological exams.
The early diagnosis of a pathological tremor can
lead to appropriate treatment, which can provide a
better condition of life for individuals.
The use of this method and paradigm may be an
important tool for the characterization of different
types of tremors.
ACKNOWLEDGEMENTS
The authors would like to thank the Brazilian
government for supporting this study (Project
PPSUS/FAPEMIG 2006 Nr. 3300/06).
INVESTIGATION OF CHANGES IN KINETIC TREMOR THROUGH ANALYSIS OF HAND-DRAWING
MOVEMENTS - Differences between Physiological and Essential Tremors
397

REFERENCES
Almeida, M. F. S., Cavalheiro, G. L., Pereira, A. A. &
Andrade, A. O. 2010. Investigation of Age-Related
Changes in Physiological Kinetic Tremor. Annals of
Biomedical Engineering, 38, 3423-3439.
Bhagwath, G. 2001. Tremors in elderly persons: clinical
features and management. Hospital Physician, 49, 31-
49.
De Lima, E., Andrade, A. O., Pons, J., Kyberd, P. &
Nasuto, S. 2006. Empirical mode decomposition: a
novel technique for the study of tremor time series.
Medical and Biological Engineering and Computing,
44, 569-582.
Delignieres D, D. T., Legros A, Caillou N 2003. A
methodological note on nonlinear time series analysis:
Is the open- and closed-loop model of Collins and De
Luca (1993) a statistical artifact? Journal of Motor
Behavior, 35, 86-96.
Deuschl, G., Lauk, M. & Timmer, J. 1995. Tremor
classification and tremor time series analysis. Chaos,
5, 48-51.
Elble, R. J., Brilliant, M., Leffler, K. & Higgins, C. 1996.
Quantification of essential tremor in writing and
drawing. Movement Disorders, 11, 70-78.
Elble, R. J., Sinha, R. & Higgins, C. 1990. Quantification
of tremor with a digitizing tablet. Journal of
Neuroscience Methods, 32, 193-198.
Feys, P., Helsen, W., Prinsmel, A., Ilsbroukx, S., Wang, S.
& Liu, X. 2007. Digitised spirography as an evaluation
tool for intention tremor in multiple sclerosis. Journal
of Neuroscience Methods, 160, 309-316.
Liu, X., CarrolL, C. B., Wang, S.-Y., Zajicek, J. & Bain,
P. G. 2005. Quantifying drug-induced dyskinesias in
the arms using digitised spiral-drawing tasks. Journal
of Neuroscience Methods, 144, 47-52.
Louis, E. D., Wendt, K. J., Pullman, S. L. & Ford, B.
1998. Is essential tremor symmetric?: observational
data from a community-based study of essential
tremor. Archives of Neurology, 55, 1553-1559.
Mansur, P. H. G., Cury, L. K. P., Andrade, A. O., Pereira,
A. A., Miotto, G. A. A., Soares, A. B. & Naves, E. L.
M. 2007. A review on techniques for tremor recording
and quantification. Critical Reviews in Biomedical
Engineering, 35, 343-362.
Mergl, R., Tigges, P., Schröter, A., Möller, H.-J. &
Hegerl, U. 1999. Digitized analysis of handwriting and
drawing movements in healthy subjects: methods,
results and perspectives. Journal of Neuroscience
Methods, 90,
157-169.
Miralles, F., Tarongí, S. & Espino, A. 2006.
Quantification of the drawing of an Archimedes spiral
through the analysis of its digitized picture. Journal of
Neuroscience Methods, 152, 18-31.
Morrison, S., Mills, P. & Barrett, R. 2006. Differences in
multiple segment tremor dynamics between young and
elderly persons. The Journals of Gerontology Series
A: Biological Sciences and Medical Sciences, 61, 982-
990.
Norris, J. A., Marsh, A. P., Smith, I. J., Kohut, R. I. &
Miller, M. E. 2005. Ability of static and statistical
mechanics posturographic measures to distinguish
between age and fall risk. Journal of Biomechanics,
38, 1263-1272.
Pullman, S. L. 1998. Spiral analysis: a new technique for
measuring tremor with a digitizing tablet. Movement
Disorders, 13, 85-89.
Raethjen, J., Pawlas, F., Lindemann, M., Wenzelburger, R.
& Deuschl, G. 2000. Determinants of physiologic
tremor in a large normal population. Clinical
Neurophysiology, 111, 1825-1837.
Smaga, S. 2003. Tremor. American Family Physician, 68,
1545-1553.
Timmer, J., Lauk, M., Pfleger, W. & Deuschl, G. 1998.
Cross-spectral analysis of physiological tremor and
muscle activity. Biological Cybernetics, 78, 359-368.
Ulmanová, O., Homann, C. N., Ulman, R., Jech, R.,
Capek, V., Klempír, J. & Ruzicka, E. 2007. Tremor
magnitude: a single index to assess writing and
drawing in essential tremor. Parkinsonism & Related
Disorders, 13, 250-253.
BIOSIGNALS 2011 - International Conference on Bio-inspired Systems and Signal Processing
398
