
DOUBLE HEADED PROBE FOR LOCAL PULSE WAVE
VELOCITY ESTIMATION
A New Device for Hemodynamic Parameters Assessment
H. C. Pereira, J. B. Simoes, J. L. Malaquias
ISA – Intelligent Sensing Anywhere, Rua D. Manuel I, Coimbra, Portugal
Instrumentation Centre, Physics Department, University of Coimbra, R. Larga, Coimbra, Portugal
T. Pereira, V. Almeida, E. Borges, E. Figueiras, J. Cardoso, C. Correia
Instrumentation Centre, Physics Department, University of Coimbra, R. Larga, Coimbra, Portugal
Keywords: Local Pulse Wave Velocity, Double Headed Probe, Piezoelectric Sensor, Test Bench, Impulse Response.
Abstract: The present work proposes a new device for local pulse wave velocity (PWV), by using an innovative
configuration of a double piezoelectric (PZ) sensor probe. PWV is assessed in one single location and
involves the determination of time delay, between the signals acquired simultaneously by two PZs, 23 mm
apart. The double probe (DP) is characterized in a dedicated test bench system, where two main studies
were carried out. In the first one, the impulse response (IR) for each PZ sensor is determined and evaluated
through the deconvolution method. In the second one, DP time resolution is estimated from a set of time
delay algorithms and compared with the reference values, obtained through the signals of two pressure
sensors. Results demonstrate the effectiveness of the inferred IRs in deconvolution purposes and the
possibility of measure higher PWV values (≈ 19m/s), through the DP, with an error less than 10%.
1 INTRODUCTION
The velocity of propagation of the pulse pressure
wave is recognized as the simplest and most
reproducible process of assessing non-invasively
arterial stiffness, pointed out as an important key
factor of cardiovascular risk (Laurent et al, 2006).
The use of electromechanical technology remains
the golden standard for pulse wave velocity (PWV)
measurement, as a result of its signal robustness,
large bandwidth, low-price and ease of use. The
methodology used in PWV assessment, requires the
acquisition of pressure waves at two positions,
separated from a distance, d, and the determination
of time delay between the waves, defined as the
pulse transit time, ∆t. The main problems of this
technique are related with the determination of time
delay that strongly depends on the method that is
used, and with the complexity in accurately
estimating the distance between the recording sites
(Segers et al, 2009).
An alternative approach that is presented in this
work is to decrease the distance between the two
measurement sites, as a solution for more accurate d
estimations, thus providing information on local
hemodynamics. Local PWV is an accurate marker of
the degree of atherosclerosis and it is generally
measured over carotid artery. The existing devices
are essentially based on ultrasound methods and
echotracking techniques but they have not been yet
generalized to the clinical practice, due to poor PWV
precision, in phantom studies or in-vivo experiments
(Meinders et al, 2001). The most recent studies on
this matter, investigated the precision of different
signal processing methods for local PWV
assessment, over short segments, by means of a M-
line ultrasound system. The discrepancy between the
results in phantom and in-vivo was considerably
high, resulting in an unsuitable technique for clinical
practice (Hermeling et al, 2008).
In the present work, an alternative device based
on a double headed configuration of piezoelectric
(PZ) sensors for local PWV assessment, is proposed.
444
Pereira H., Simoes J., Malaquias J., Pereira T., Almeida V., Borges E., Cardoso J. and Correia C..
DOUBLE HEADED PROBE FOR LOCAL PULSE WAVE VELOCITY ESTIMATION - A New Device for Hemodynamic Parameters Assessment.
DOI: 10.5220/0003293704440447
In Proceedings of the International Conference on Biomedical Electronics and Devices (BIODEVICES-2011), pages 444-447
ISBN: 978-989-8425-37-9
Copyright
c
2011 SCITEPRESS (Science and Technology Publications, Lda.)
The probe is widely characterized on a test bench
system, capable of reproducing important features of
the cardiovascular system (Pereira et al, 2010).
2 MATERIALS
2.1 The Double Headed Probe
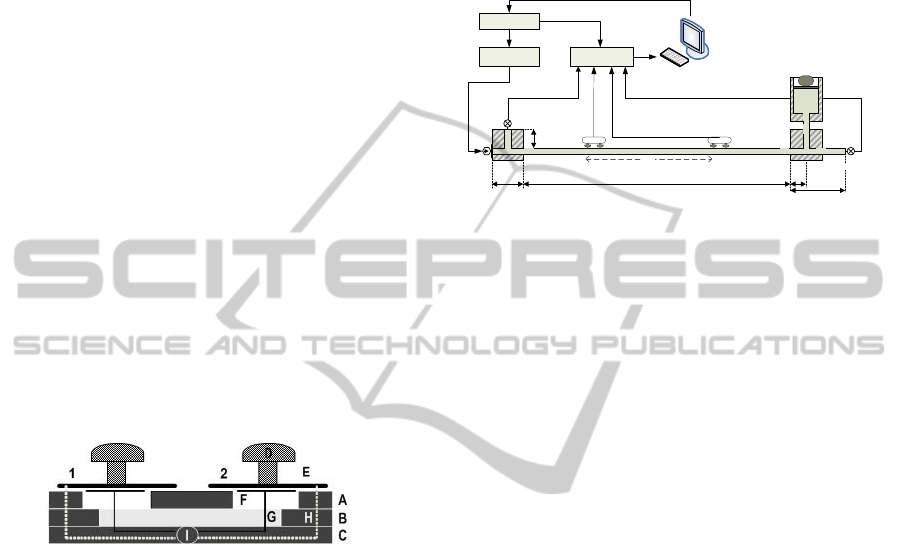
The configuration of the developed double headed
probe (DP) is shown, in figure 1. The DP consists of
two circular-shaped PZ sensors (MURATA® 7BB-
12-9 Sounder, 12mm diameter), placed 23 mm apart
and mounted on a triple double layer printed circuit
board (PCB). The first and second PCB layers
support the PZ discs, assuring the PZs oscillations
due to their perforation and the third one
incorporates the local signal conditioning electronics
which is based on a voltage follower amplifier, set to
a gain of ≈ 2, for each PZ. The probe’s mechanical
interface consists of two mushroom-shaped PVC
pieces (15 mm diameter in top), located in the centre
of the PZ discs. These elements are responsible for
transmitting the distension imparted to tissues by the
pressure waveform, to each PZ sensor.
Figure 1: Cross section scheme of the double headed PZ
probe. A, B - support layers; C- signal conditioning layer;
D- ‘mushroom’ PVC interface E - PZ metal disk; F- PZ
material G – PZ signal conductor H – ground conductor I
– coaxial cable 1- PZ
1
;
2- PZ
2
.
2.2 The Test Bench System
For testing the probe, it was developed a dedicated
test bench, diagrammatically shown in figure 2.
A pressure wave is generated by a piston
mechanism coupled to a 0.7 mm stroke actuator,
ACT, driven by a high voltage linear amplifier, HV,
(Physik Instrumente GmbH P-287 and E-508,
respectively) and launched into an 8mm internal
diameter, 0.5 mm wall thickness silicone rubber
tube, filled with water. The wave is then captured by
the DP placed along the tube and by two pressure
sensors PS1 and PS2 (Honeywell, 40PC015G1A),
placed at the tube’s extremities. The acquired signals
are sampled at 12.5 ksps, through NI DAQ USB-
6210, and stored for offline analysis using Matlab®.
The input waveforms are programmed into an
Agilent 33220A arbitrary waveform generator, WG
and the DC level is controlled by a piston–mass
combination, P-m, placed at the extremity of the
tube, on the opposite side of the ACT ((Pereira et al,
2009).
∆x
WG
NI USB6210HV
P
m
PS2
PS1
ACT
Workstation
200 cm4.5 cm
1.5 cm
3.6 cm
3.7 cm
DP1 DP2
PZa
PZb
Figure 2: Schematic drawing of the test bench system.
3 METHODS
3.1 Double Probe Characterization
3.1.1 Impulse Response Determination
The electrical equivalent of a PZ sensor is more
complex than a simple RC circuit, mainly if the
sensor is attached to another mechanical structure.
The first experiment carried out for DP
characterization, consisted in determining the
impulse response (IR) for each one of its sensing
elements (i.e., mushroom probe plus PZ sensor
electronics). To achieve this purpose, a technique
based on a chirp signal that sweeps linearly a wide
frequencies range (from 500 mHz to 1 kHz) was
used. This sweep was generated by the WG and fed
to the ACT, with direct actuation on the probe’s
interface. The spectra of the PZ output and of the
sweep input signal were computed, and the
correspondent transfer function was inferred.
Through the inverse fast Fourier transform (IFFT), it
was possible to determine the referred IR.
Test bench acquisitions were accomplished in
order to apply the deconvolution principle to the DP
output, and thus determine the effectiveness of the
determined IRs.
3.1.2 Time Resolution Assessment
The main potential of the DP is focused on the
ability to locally measure the PWV, with enough
accuracy to be considered a valid device for clinical
use. In order to assess DP time resolution
performance, two main studies were carried out. The
DOUBLE HEADED PROBE FOR LOCAL PULSE WAVE VELOCITY ESTIMATION - A New Device for
Hemodynamic Parameters Assessment
445
first one aimed at studying the PWV progress of two
uncoupled PZs, regarding their separating distance,
Δx. Two DPs, initially separated by 50 cm, were
used: one of the probes (DP1) was static, while the
other one (DP2) approached successively at intervals
of 2 cm (figure 2). For each position, a Gaussian
pressure wave (150 ms width) was delivered to the
system. The second experiment intended to
determine the precision of PWV measurements
obtained with the DP, in 25 different tube’s positions
as well as the accuracy concerning the reference
PWV values, estimated with pressure sensors. For
each position, a burst of 10 Gaussian pressure waves
(400 ms width) was reproduced by the ACT.
3.1.3 Algorithms for Time Delay Estimation
Time delay was estimated for two different settings:
between the signals of both pressure sensors
(considered as a reference time for PWV estimation)
and between the signals of the DP PZ sensors. Three
different algorithms were considered:
(a) Cross-Correlation - The ACT driving signal
is used as a reference and time delay is calculated as
the difference between the two maxima values,
obtained from the cross-correlation between the
ACT signal and the pressure/PZ signals amplitude;
(b) Zero-crossing - Due to the differentiator
nature of the PZ sensors, zero-crossing point is used
as a time reference for time delay estimation and it is
determined through a linear fit on the zero crossing
vicinity; and,
(c) Maximum amplitude - This algorithm uses a
6th degree polynomial fit in the maximum region to
guarantee an accurate identification of the peaks.
4 RESULTS
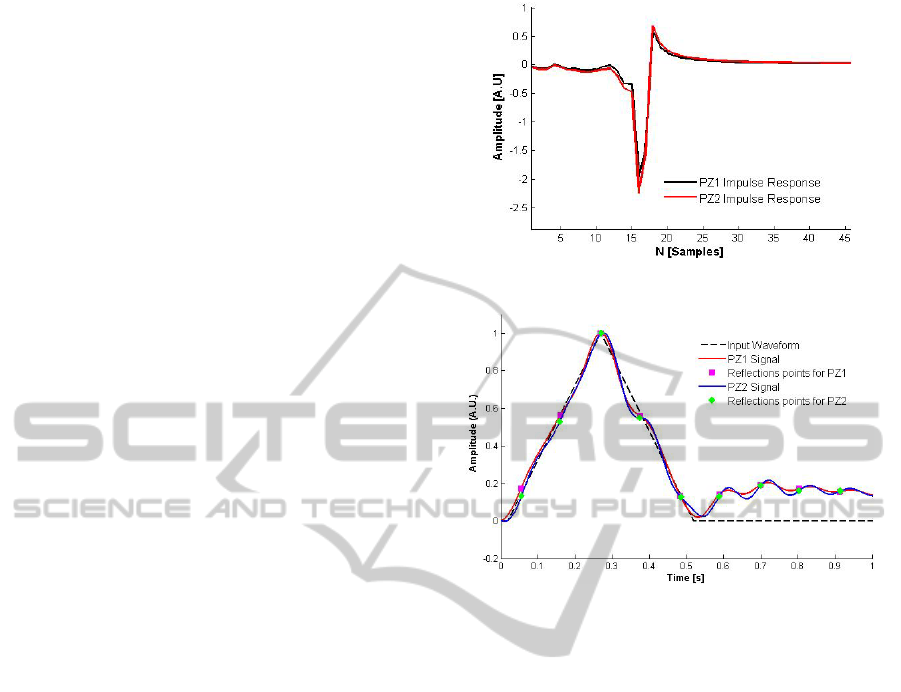
4.1 Impulse Response Determination
The IRs obtained for each one of the PZ sensors are
presented, in figure 3. The profiles obtained for each
sensing element are equivalent, both in shape and in
amplitude, and are very close to those expected for a
simple differentiator circuit.
In figure 4, the effectiveness of the referred IRs
is evaluated, through deconvolution method.
From the DP output and its IRs, it was possible
to recover a programmed triangular pressure
waveform of 500 ms width, sensed at the end of the
tube. It is visible the striking similarity between the
deconvolved pressure waves, determined for each
PZ, as also the high correlation with the input
Figure 3: DP impulse responses.
Figure 4: Deconvolved signals obtained from DP output
and DP IRs.
waveform. The presence of inflection points
correspond to the influence of reflected waves,
generated by the two reflection sites at the
extremities of the tube. Although deconvolution was
used in the present study, as an auxiliary technique
in DP characterization, the encouraging results
obtained above, suggest that it can be used as an
alternative method that allows the precise recovery
of the original pressure waveform. Future work will
be pursued up in order to determine the application
of this IRs to other systems (e.g.: human carotid).
4.2 Time Resolution Assessment
In figure 5, the PWV obtained for two uncoupled PZ
sensors, in successively smaller separation distances
is illustrated.
In general, the relative error in PWV increases as
the distance between the two PZ decreases. For Δx
longer than 12 cm, the PZs PWV values are close to
the reference values. For Δx smaller than 12 cm, the
PZs PWV values diverge from the pressure sensors
values and an increase of the error is visible, mainly
in the maximum amplitude algorithm.
Figure 6 compares the PWV values obtained
BIODEVICES 2011 - International Conference on Biomedical Electronics and Devices
446

Figure 5: PWV values of unclouped PZs and pressure
sensors, yielded by the three algorithms.
through DP, along 25 different consecutive positions
with the reference PWV values. Only the cross-
correlation algorithm was implemented for time
delay estimation, due to the previous best results.
Figure 6: Dispersion of PWV values obtained through DP
and pressure sensors, along 25 consecutive locations.
Both PWV distributions are correlated however
the dispersion of them is still quite different.
Actually, the referred PWV distributions present a
mean value and a standard deviation of 19.26 ± 0.04
m/s (pressure sensors set) and 19.55 ± 2.02 m/s (DP
set), matching up a coefficient of variation of 0.21%
and 10.32%, respectively. In addition, the relative
error between the two sets is about 8.11%.
Since this higher DP dispersion may have its
basis in lower statistics or mechanical drawbacks
(e.g. geometry of mushroom interfaces, effective
distance between the PZ sensors, etc.), future work
will be pursued up at this stage.
5 CONCLUSIONS
A novel device for PWV assessment, based on a
double configuration of PZ sensors is presented and
successfully characterized on a dedicated test bench
system.
Local PWV was measured with enough accuracy
(relative error < 10%) in test bench experiments,
through DP. Although studies to validate the clinical
use of DP are still required, this device seems to be a
valid alternative to local PWV stand alone devices.
ACKNOWLEDGEMENTS
We acknowledge support of Fundação para a
Ciência e Tecnologia, as well as of company ISA-
Intelligent Sensing Anywhere.
REFERENCES
Hermeling E, Reesink K, Reneman R and Hoeks A 2008
Confluence of incident and reflected waves interferes
with systolic foot detection of the carotid artery
distension waveform J Hypertens. 26 2374-80
Laurent S., Cockcroft J., Van Bortel L., Boutouyrie P.,
Giannattasio C, Hayoz D, et al. 2006 Expert consensus
document on arterial stiffness: methodological issues
and clinical applications Eur Heart J. 27 2588-2605
Meinders J., Kornet L., Brands P. and Hoeks A. 2001
Assessment of local pulse wave velocity in arteries
using 2D distension waveforms Ultrason. Imaging 23
199-215
Pereira H. C., Cardoso J. M., Almeida V. G., Pereira T.,
Borges E., Figueiras E., Ferreira L.R., Simões J.,
Correia C. 2009 Programmable testbench for
hemodynamic studies IFMBE Proceedings 25/IV
1460ff
Pereira, H. C., Lopes, T., Almeida, V., Borges, E.,
Figueiras, E., Basílio J. B., Cardoso, J., and Correia
C., 2010 Characterization of a double probe for local
pulse wave velocity assessment Physiol Meas. 31
697-714
Segers P., Kips J., Trachet B., Swillens A., Vermeersch S.,
Mahieu D., Rietzchel E., Buyzere M. and Bortel L.
2009 Limitations and pitfalls of non-invasive
measurement of arterial pressure wave reflections and
pulse wave velocity Artery Research 3 79-88
DOUBLE HEADED PROBE FOR LOCAL PULSE WAVE VELOCITY ESTIMATION - A New Device for
Hemodynamic Parameters Assessment
447
