
PREDICTION OF SIGNIFICANT CRUCIFORM STRUCTURES
FROM SEQUENCE IN TOPOLOGICALLY CONSTRAINED DNA
A Probabilistic Modelling Approach
Matej Lexa
1
, Lucie Navr´atilov´a
2
, Karel Nejedl´y
2
and Marie Br´azdov´a
2
1
Dept Information Technology, Masaryk University, Botanick´a 68a, 60200 Brno, Czech Republic
2
Institute of Biophysics, Czech Academy of Sciences v.v.i., Kr´alovopolsk´a 135, 61265 Brno, Czech Republic
Keywords:
Cruciforms, Simulation, Model, Stability, DNA, Superhelicity.
Abstract:
Sequence-dependent secondary DNA structures, such as cruciform or triplex DNA, are implicated in regula-
tion of gene transcription and other important biological processes at the molecular level. Sequences capable
of forming these structures can readily be identified in entire genomes by appropriate searching techniques.
However, not every DNA segment containing the proper sequence has equal probability of forming an alter-
native structure. Calculating the free energy of the potential structures provides an estimate of their stability in
vivo, but there are other structural factors, both local and non-local, not taken into account by such simplistic
approach. In is paper we present the procedure we currently use to identify potential cruciform structures in
DNA sequences. The procedure relies on identification of palindromes (or inverted repeats) and their evalua-
tion by a nucleic acid folding program (UNAFold). We further extended the procedure by adding a modelling
step to filter the predicted cruciforms. The model takes into account superhelical density of the analyzed seg-
ments of DNA and calculates the probability of cruciforms forming at several locations of the analyzed DNA,
based on the sequences in the stem and loop areas of the structures and competition among them.
1 INTRODUCTION
Textbook descriptions of DNA structure and func-
tion often focus on the canonical B-DNA structure
and the gene-coding properties of DNA molecules.
The famous helical structure can exist for virtually
all possible sequences of nucleotides, some of which
code for biologically active RNA molecules or pro-
teins. However, many other sequences of nucleotides
found in real DNA molecules are non-coding. Cer-
tain nucleotide sequences have the potential to ex-
ist in non-canonical structural conformations, having
their own biological function attributable directly to
the DNA-molecule and its shape, rather than to its in-
formation content. The non-canonical structures and
their functions are of great interest to molecular biol-
ogists. They can be divided into duplex, triplex and
quadruplex structures, depending on the number of
DNA strands interacting together to form a higher-
order structure (Sinden, 1994).
The best known duplex structure, cruciform DNA,
exists in locations with inverted repeats (or palin-
dromes). Thanks to the presence of a palindromic
sequence, each strand can form a duplex of its own,
resulting in the formation of two stem-loop structures
opposite to each other (Brazda et al., 2011). In DNA
molecules with similar palindromes in tandem, a vari-
ation of this structure, called slipped DNA, can form.
Here each strand forms its duplex in a different part
of the tandemly repeated set of palindromes. Triplex
structures are similar to cruciforms or slipped DNA,
but one of the two duplexes melts and contributes one
strand to the other duplex, attaching to it via Hoog-
steen base-pairing. Quadruplex DNA seems to be a
structure specific for chromosome telomeres, partic-
ipating in maintaining the stability of chromosome
ends throughout cell cycles (Neidle, 2002).
An interesting feature of all non-canonical struc-
tures is their sequence-dependency. In current
decades, molecular biologists have gained access to
sequences of entire genomes of various organisms.
The newly sequenced genomes get annotated, mostly
by identifying coding sequences and the function of
their gene products. To fully understand all the func-
tions residing in the genomes, we need to be able
to understand the functions of non-coding sequences
as well. Recent research has shown, that many non-
coding regions of human DNA contain ultraconserved
124
Lexa M., Navrátilová L., Nejedlý K. and Brázdová M..
PREDICTION OF SIGNIFICANT CRUCIFORM STRUCTURES FROM SEQUENCE IN TOPOLOGICALLY CONSTRAINED DNA - A Probabilistic
Modelling Approach.
DOI: 10.5220/0003705701240130
In Proceedings of the International Conference on Bioinformatics Models, Methods and Algorithms (BIOINFORMATICS-2012), pages 124-130
ISBN: 978-989-8425-90-4
Copyright
c
2012 SCITEPRESS (Science and Technology Publications, Lda.)

sequences, likely to be very important components of
human cells. It is speculated, that the function of these
ultraconserved sequences may be regulatory (Pennac-
chio et al., 2006). In our laboratories, we combine ex-
perimental approachesof searching for non-canonical
DNA (especially in the context of p53 gene regu-
lation) with in-silico methods of identifying palin-
dromes of certain type and evaluating their capacity
for cruciform and triplex formation.
The process of searching entire genome sequences
for cruciform- and triplex-forming segments can be
done in several stages (see also (Lexa, 2011)). As
a first step, we identify all approximate palindromes
over a predetermined quality threshold in the se-
quence. This is done using an implementation of
a modified Landau-Vishkin algorithm with suffix ar-
rays, possibly using FPGA hardware to accelerate the
search (Martinek and Lexa, 2008). Subsequently, the
candidate palindromes are evaluated for their capacity
for alternative structure formation. We use UNAFold
(Markham and Zuker, 2008), a program that can find
optimal pairing of nucleotides in nucleic acid strands
and calculate the free energy of the resulting struc-
tures. We expected the structures with the lowest free
energy to be present in vivo, but as will be explain in
the proposed model, this may not always be the case.
In search for a beter explanation of cruciform
formation, we realized, that the existence of cruci-
form DNA may not only be determined localy, by
the sequence of nucleotides present at the site in
question, but also non-locally, by the state of neigh-
bouring DNA segements. This would be especially
true in topologicaly constrained DNA, such as cir-
cular plasmids or genomic DNA anchored to other
cell structures. In such situations, DNA exists in
a defined topological state that can be characterized
by superhelical density. Superhelical density defines
how close the DNA is to a relaxed state in which the
two strands in the helix make a full turn around each
other about every 10.5 nucleotides (Sinden, 1994).
DNA with negative superhelical density posseses free
energy that can drive reactions requiring melting of
the two strands. Experiments have shown that cruci-
form DNA forms preferentially at negative superheli-
cal densities below -0.05 (Singleton and Wells, 1982).
However, the formation of cruciform DNA immedi-
ately changes the superhelical density of the residual
segments in the given topological domain, making it
less likely for other cruciform structures to form. It is
this problemwe decided to treat mathematicaly, creat-
ing a probabilistic model that can be used to calculate
the likelihood of a given DNA segment to exist in the
canonical or non-canonical structure. At the moment
we do not have enough data to calibrate the model for
general use. The main focus of the paper will be on
the inner workings of the model, using a simple nu-
clease experiment with plasmid DNA as an example
illustrating possible use of the model.
2 MATERIALS AND METHODS
2.1 The Model
The topological state of a given DNA molecule is best
described by the number of superhelical twists (W) it
adopts to accomodate any helical twists (T) that differ
from the most favored state defined by linking number
of relaxed DNA (L
0
)
L
0
= N/10.5 (1)
where N is the number of nucleotides in the given
molecule. As long as the ends of the DNA molecule
are fixed (either by circularization or attachment to
matrix), the linking number (L) can not change and
the three values remain dependent on each other ac-
cording to the following equation
L = T + W (2)
The superhelical density of such molecule is then de-
fined as the number of superhelical twists per helical
twist of the molecule
σ = 10.5W/N (3)
which for most purposes is equivalent to
σ = (L− L
0
)/L
0
(4)
Historically, the first form was used to calculate su-
perhelical density from experimentally determined
number of superhelical twists, while the second form
is more suitable when linking number, rather than
measurement is available (Sinden, 1994).
The importance of superhelical density for our
model comes from the observation that secondary
stuctures in DNA form only under favorable values
of superhelical density. One of the original measure-
ments placed the threshold value between -0.005 and
-0.006 (Singleton and Wells, 1982). We can view
the superhelical density of a molecule as a store of
free energy that can drive reactions that require partial
melting of DNA stands. The free energy of supercoil-
ing has been estimated as
∆G = (1100RT/N)(L− L
0
)
2
(5)
where R is the gas constant and T is the temperature
(Sinden, 1994). Since cruciform formation belongs
PREDICTION OF SIGNIFICANT CRUCIFORM STRUCTURES FROM SEQUENCE IN TOPOLOGICALLY
CONSTRAINED DNA - A Probabilistic Modelling Approach
125

to the category of reactions that require strand sep-
aration, we will model cruciform formation depen-
dent on the number of superhelical twists that exist or
could exist in the molecule at a given moment. When
linear DNA is converted into cruciform DNA, T de-
creases by one for every 10.5 bp participating in cru-
ciform formation (Sinden, 1994). Here we assume
that the part of the molecule that forms the new sec-
ondary structure continues to exist in a superhelicaly
relaxed state. At the same time we assume, that the
rest of the DNA molecule remains at previous super-
helical density corrected for the difference caused by
the newly formed cruciform. If the superhelical den-
sity before the formation of the cruciform was σ
old
, it
will become divided by a four-way junction into two
domains: i) the cruciform of length l with intrastrand
basepairs and ii) the rest of the molecule. Based on
Eqs. 1 and 3, the superhelical density of the rest of
the molecule will now be
σ
new
=
σ
old
∗ N + l
N − l
(6)
Using Eq. 6 for a hypothetical 1000bp plasmid with
superhelical density of -0.065 harboring a 20bp palin-
drome, after cruciform formation we obtain superhe-
lical density for the rest of the molecule
−0.065 ∗ 1000+ 20
1000− 20
=
−45
980
= −0.046 (7)
This clearly indicates that at the given length and su-
perhelical density, the plasmid in this example has the
potential to form only one secondary structure (cru-
ciform). Let us now suppose the plasmid contains
several palindromes capable of forming a cruciform
structure. Which of them will actually form in vivo
will most likely depend on chance. Once a cruci-
form is formed, it is very difficult for it to return to
the linear form. However, if we have a population of
plasmids, as is usually the case in populations of bac-
teria or isolated molecules used in experiments, each
of them may be in a different state in terms of which
of the existing palindromes actually formed a cruci-
form. This clearly shows the need for a probabilistic
model of cruciform formation, which will not only
take into account stability of cruciform structures that
can be formed (each palindrome is a potential cruci-
form), but also the presence of other cruciforms in the
same topological domain (which will affect the resid-
ual superhelical density calculated from Eq. 6) and
the melting/folding path by which cruciforms form in
linear DNA.
The path by which a linear segment of B-DNA be-
comes cruciform DNA has been discussed intensively
in literature. C-type formation has been described in
low salt solutions and S-type formation at physiolog-
ical salt levels (Lilley, 1989). Since our model aspires
to describe conditions in vivo, we will uniformly as-
sume S-type formation in our model. Under this sce-
nario, the segment containing the palindrome has to
partially melt in a region of about 10bp in the area
of the future loop. Upon this partial melting, the free
strands can return to original configuration, or form
a four-way junction initiating cruciform extrusion at
the given location. Once the cruciform is formed, ex-
tra energy is required for its transformation back to
linear B-DNA.
In our model, we divide the sequence of the palin-
drome into three zones: i) the melting zone is in the
loop area, it extends to the first two bases that will
form a pair in the stem of the cruciform as predicted
by UNAFold, however, it is forced to be at least 9bp
long; ii) the cruciform stem zone formed by the bulk
of the paired bases and iii) the nucleation zone formed
by two paired bases at the boundary of the stem and
the loop.
Based on the available knowledge on cruciform
formation, we can now formulate a stochastic math-
ematical model of cruciform formation in a topolog-
ically isolated segment of DNA. A schematic draw-
ing of the model is given in Figure 1. We start by
identifying a set of palindromes in the DNA sequence
by computational methods. Let us designate them
p1, p2,..., p
k
. Each palindrome will exist in one of
three states: L (linear B-DNA), M (melted loop zone)
or C (cruciform). The transitions will be modelled
based on calculated free energies or melting temper-
atures of the appropriate duplex state. The lower the
energy (or higher the melting temperature), the less
likely the molecule will be to leave that state. The
best way to calculate the relative probabilities of tran-
sition for each palindrome remains to be determined.
Currently, we use a formula that takes into account
the exponential relationship between free energy or
melting temperature on one side and rate constants of
the underlying reactions on the other. An exponen-
tial function of free energy or temperature difference
from melting temperature is calculated for each palin-
drome and the resulting values are then normalized to
a sum of 100% to obtained the relative probabilities of
transition (refer to MATLAB (see Url 1) code for the
exact formula). The whole system can now be simu-
lated by iterating through a predefined number of cy-
cles (event time). In each of the cycles the state of a
given molecule will be changed based on the calcu-
lated transition probability distribution. If calculated
on a population of molecules (or cells), we obtain per-
centages of palindromes present as linear B-DNA or
cruciform for each of the palindromes.
BIOINFORMATICS 2012 - International Conference on Bioinformatics Models, Methods and Algorithms
126

Figure 1: Model schema. Each palindrome can exist in three states (L - linear B-DNA, M - melted strands, C - cruciform).
Full arrow represent transitions between states. Dashed arrows represent dependency between variables of the model. State
M is a transition state and is not directly represented in the current version of the model.
2.2 DNA Analysis
An experimental protocol using S1 nuclease was used
to detect the presence of cruciform structures in plas-
mid DNA in vivo. S1 nuclease digestion only digests
DNA in locations with unpaired bases, such as the
loop of a cruciform structure. The plasmids used in
the experiments were additionally digested with ScaI
restriction endonuclease. A single ScaI restriction site
is present in the plasmid pBluescript SKQ II- (pBSK,
Stratagene) and its derivatives used in our experiment.
The ScaI restriction site is located at position 2510 in
the pBluescript plasmid. If no cruciforms are present,
this treatment yields a linearized plasmid. In the pres-
ence of cruciforms, it yields two fragments of DNA.
Their size is indicative of the position at which the
cruciform has formed.
Supercoiled plasmids pBluescript SK II-, pPGMI
(pBSK- containing a cloned p53 consensus site AGA-
CATGCCTAGACATGCCT (Palecek et al., 1997) and
pPGM2 (pBSK- containing a cloned p53 consen-
sus site AGACATGCCTAGACATGCCT) (Palecek et
al., 2004) were isolated from bacterial strain TOP10
(Stratagene) as described in the Qiagen protocol (Qi-
agen, Germany). SmaI restriction enzyme (Takara,
Japan) was used for linearization of pBSK, pPGMI
and pPGM2. Supercoiled plasmid DNA (2µg) was
dissolved in binding buffer (5 mM Tris-HCl pH 7.6,
0.01% Triton X-100, 1mM MgCl
2
and 50mM KCl)
and pre-incubated at 37
◦
C for 20 min. Plasmid DNA
was digested by S1 nuclease (4 U/µg DNA, Promega)
for 20 min at 37
◦
C in the nuclease S1 buffer (30mM
sodium acetate pH 4.6, 280mM NaCl, 1mM ZnSO4,
Promega buffer). After the cleavage, samples were
precipitated by ethanol, dissolved in the water and di-
gested by the restriction endonuclease ScaI for 90
min. The resulting DNA was visualized by elec-
trophoresis on an agarose gel.
3 RESULTS
3.1 DNA Analysis
Three plasmids used routinely in our laboratory were
submitted to S1 nuclease digestion treatment to re-
veal any unpaired DNA bases indicative of cruciform
structure. An agarose gel of plasmids pBSK-, pPGMI
and pPGM2 upon S1 nuclease and ScaI digestion is
shown in Figure 2. With no structures present, the
plasmids are only digested by ScaI. The resulting
linearized plasmids show as a single band at about
3000bp. As seen in lanes 3, 5 and 7, a significant
percentage of plasmids were also disgested by S1 nu-
clease. The pBSK- plasmid shows a prominent pair of
bands at about 700 and 2200bp (any two bands due to
S1 nuclease treatment should add up to the total size
of the original plasmid, which is 2961 for pBSK-).
Another band at 1500bp is most likely a mixture of
two products of roughly equal size. The pPGMI plas-
mid displays a similar pattern, except for a very weak
pair of bands at 1000 and 2000bp. pPGM2 yields a
pair at 1100 and 1800bp, which corresponds to a cru-
ciform in the cloning site. Surprisingly, the other pairs
of bands found in both pBSK- and pPGMI are ab-
sent and most of the plasmid is found in its linearized
form.
3.2 Example of Model Use
To demonstrate the use of the model, we analyzed
the sequences of three plasmids, pBSK-, pPGMI and
PREDICTION OF SIGNIFICANT CRUCIFORM STRUCTURES FROM SEQUENCE IN TOPOLOGICALLY
CONSTRAINED DNA - A Probabilistic Modelling Approach
127
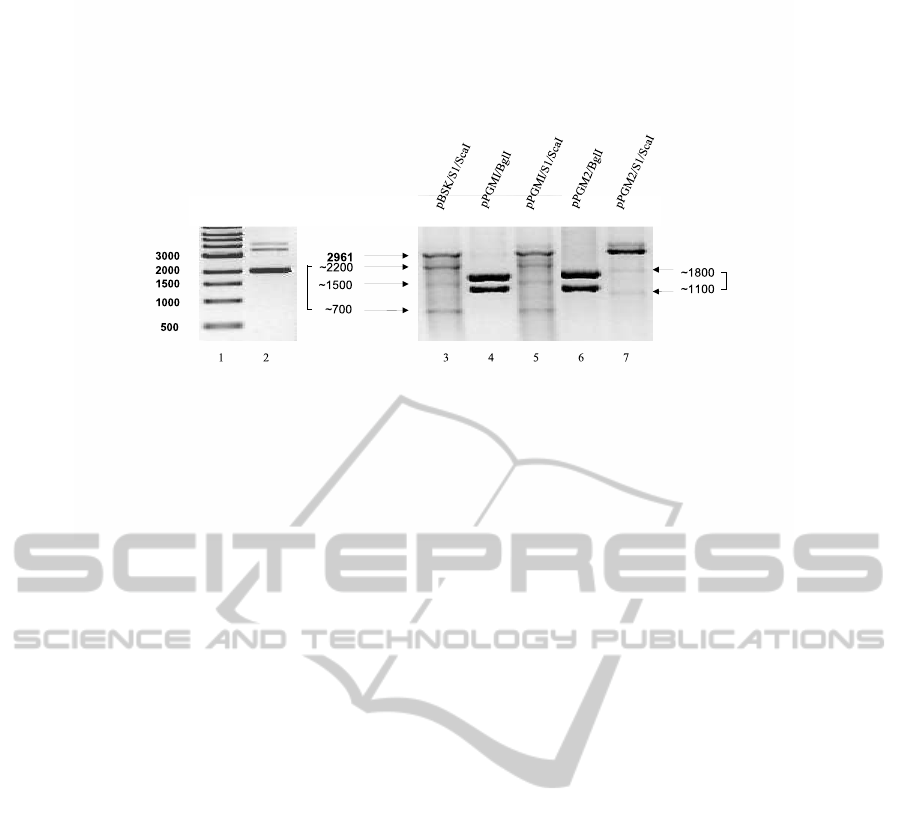
Figure 2: S1 nuclease treatment. Plasmids pBSK, pPGMI and pPGM2 show the presence of distinct bands indicative of
S1-sensitive sites. Substracting 450 from the size of the band gives the location of the digested position in the plasmid.
pPGM2 for approximate palindromes by scanning it
with our implementation of the Landau-Vishkin algo-
rithm (Martinek and Lexa, 2008). The most promi-
nent palindromes are listed in Table 1. The optimal
basepairing in these sequences was calculated with
UNAFold. Free energy for each structure is reported
in the fourth column of the table. At this moment we
could simply choose the locations with the lowest free
energy and assume this will be the palindrome to form
a cruciform. In reality, a subset of these locations will
have cruciforms present. We deployed the model to
see if it can choose a subset that correlates with the
results of the experiment.
An implementationof the model in MATLAB (see
Url 1) was initialized using the data in Table 1, the
size of the DNA segment to be analyzed and its su-
perhelical density. During the simulation, palindrome
sequences change states according to the calculated
transition probability functions. Results of a simula-
tion with 1000 molecules of DNA for the three plas-
mids for a range of critical parameter settings are
shown in Table 2. We also visualized the values in
respect to experimental results and the free energies
in Figure 3.
4 DISCUSSION
We designed an event-based stochastic mathemati-
cal model of cruciform formation. Several simplify-
ing assumptions had to be made. Most importantly,
the effect of residual superhelical density in the cur-
rent model is all or none, represented by a thresh-
old value of -0.05 above which no cruciform forma-
tion is possible in the simulated molecules. The real
effect is likely to be less abrupt. However, we be-
lieve we can nevertheless observe the expected ef-
fects in a qualitative manner. Looking at the results
of simulations in Table 2 we can notice interesting
behavior of the model that reflects its ability to re-
solve some of the problems posed by the experimen-
tal data. The preferential prediction of cruciforms at
p3 and p7 is in full agreement with S1 nuclease treat-
ment results for pBSK- and pPGMI. The results for
pPGM2 are both, difficult to understand, and difficult
to explain by the model. There are less than a dozen
nucleotide differences between pPGMI ands pPGM2,
still it seems the cloned palindrome totally overshad-
owed the pBSK-inherent capacity for cruciform for-
mation. For now, we have no explanation for this
phenomenon. Regarding our model, changing ini-
tial superhelical density from -0.065 to a higher value
causes a shift from longer to shorter palindromes. In
special cases, this mechanism could cause imperfect
palindromes to contribute to cruciform formation. We
also changed the ability of the modelled cruciforms to
form reversibly. Less stable cruciforms were allowed
to disintegrate at a rate proportional to the stability
of the structure. In a hybrid version of the model,
this behavior was only allowed at higher values of
residual superhelical density. We observed accumu-
lation of cruciforms that kept the superhelical den-
sity above the disintegration threshold. Whether such
mechanism plays any role in real molecules is not
known. In summary, our model predicts cruciform
formation that is in partial agreement with the few
experiments we have at hand at the moment. Future
improvements should include better theoretical treat-
ment of transition probability calculation, less abrupt
thresholds for DNA behavior dependent on superhe-
lical density and most of all thorough validation and
calibration of the model on experimental data. The
model could prove useful for annotating approximate
palindromes in whole genomes, considering their im-
portance in biological processes based on the likeli-
hood of cruciform formation at different superhelical
densities of the given segment of DNA.
ACKNOWLEDGEMENTS
We wish to thank O. Lexa for invaluable help with
BIOINFORMATICS 2012 - International Conference on Bioinformatics Models, Methods and Algorithms
128
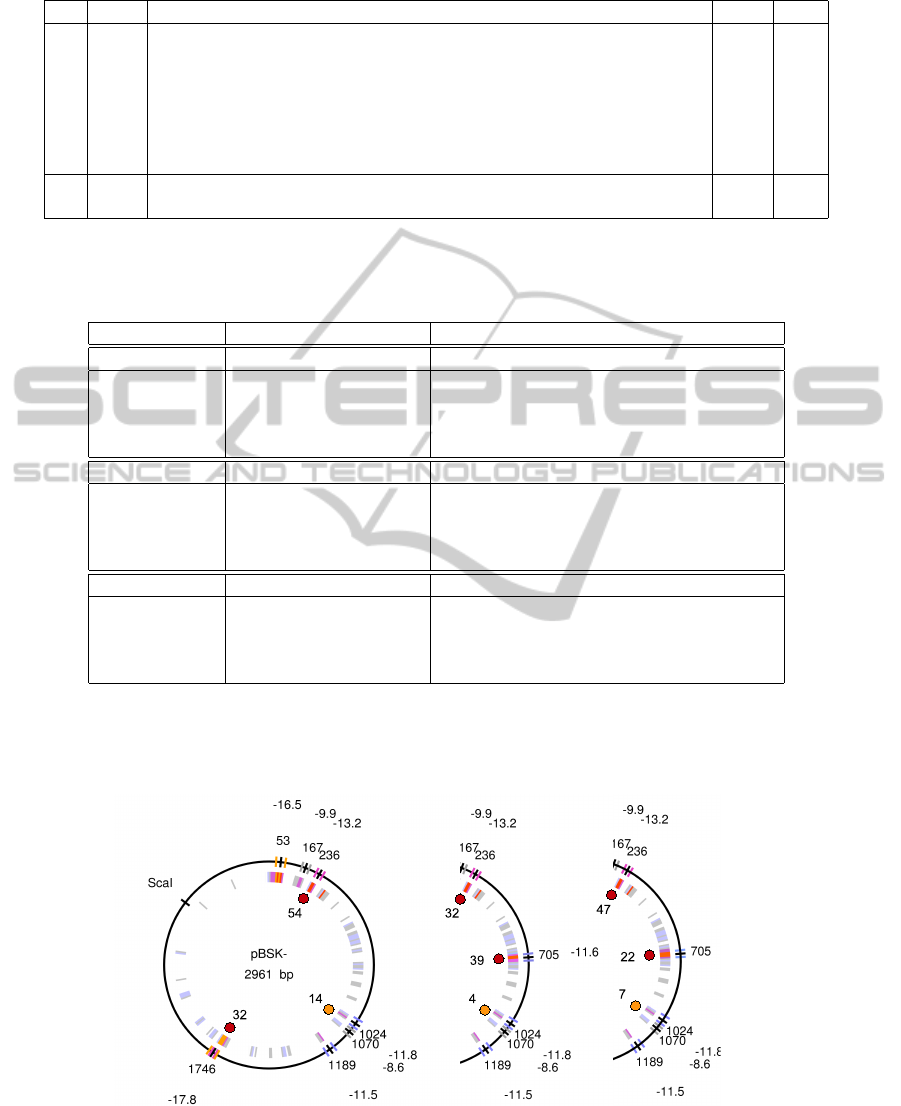
Table 1: Palindromes.
ID POS SEQUENCE dG T
m
p1 53 GGCGGGTGTGGTGGTTACGCGCAGCGTGACCGCTACACTTGCC -16.5 38.0
p2 167 CTAAATCGGGGGCTCCCTTTAGGGTTCCGATTTAGT -9.9 78.0
p3 236 AGGGTGATGGTTCACGTAGTGGGCCATCGCCCT -13.2 28.0
p4 1025 GCGGGGAGAGGCGGTTTGCGTATTGGGCGCTCTTCCGCTTCCTCGC -11.8 84.0
p5 1070 CTCGCTGCGCTCGGTCGTTCGGCTGCGGCGAG -8.6 70.0
p6 1189 GCCAGCAAAAGGCCAGGAACCGTAAAAAGGCCGCGTTGCTGGC -11.5 54.0
p7 1746 GCAAACAAACCACCGCTGGTAGCGGTGGTTTTTTTGTTTGC -17.8 30.0
p8 705 AAGCTTAAGGCATGTCTAGGCATGTCTAAGCTT -11.6 30.0
p9 705 AAGCTTAAGACATGCTCAGGCATGTCTGGGCTT -11.8 32.0
The most prominent approximate palindromes in the sequence of pBSK- and its derivatives pPGMI and pPGM2. Palindromes p8 and p9 are
from sequences that were cloned into pBSK- to form the two other plasmids.
Table 2: The results.
σ formation only p1 p2 p3 p4 p5 p6 p7 p8/p9
pBSK-(EXP) 0 0 20 0 5 0 20 -
pBSK-(SIM1) -0.065 no 7 0 6 0 0 0 84 -
pBSK-(SIM2) -0.060 no 0 2 75 0 1 0 0 -
pBSK-(SIM3) -0.063 yes 0 4 23 0 2 0 71 -
pBSK-(SIM4) -0.063 hybrid 0 0 54 0 14 0 32 -
pPGMI(EXP) 5 0 20 0 5 0 20 0
pPGMI(SIM1) -0.065 no 4 0 7 0 0 0 83 6
pPGMI(SIM2) -0.060 no 0 1 57 0 1 0 0 27
pPGMI(SIM3) -0.063 yes 0 2 32 0 3 0 45 18
pPGMI(SIM4) -0.063 hybrid 0 0 32 0 4 0 25 39
pPGM2(EXP) 0 0 0 0 0 0 0 10
pPGM2(SIM1) -0.065 no 8 0 6 0 0 0 82 2
pPGM2(SIM2) -0.060 no 0 1 62 0 0 0 0 18
pPGM2(SIM3) -0.063 yes 0 3 17 0 3 0 64 13
pPGM2(SIM4) -0.063 hybrid 0 0 47 0 7 0 24 22
The results of simulations (SIM1-SIM4) are compared with results of S1 nuclease digestions (EXP). Experimental values (%) were
estimated by visual inspection of Figure 2. Hybrid cruciform treatment allowed cruciform disintegration only at residual superhelical
densities above -0.052. Note: p3 and p7 cannot be distinguished from each other in the experiment, so we assigned them equal values of
20%.
Figure 3: Sequence analysis and model predictions. Diagrams of the three plasmids used in the study. Inner colored
circle shows locations containing interesting approximate palindromes. Outer colored signs and labels represent the nine
palindromes selected with UNAFold, together with their positions and free energies. The dots inside the circle show the
results of our simulations (SIM4 in Table 2). The predicted cruciforms are not necessarily those with the lowest energy,
however they correspond better to the experimental results.
PREDICTION OF SIGNIFICANT CRUCIFORM STRUCTURES FROM SEQUENCE IN TOPOLOGICALLY
CONSTRAINED DNA - A Probabilistic Modelling Approach
129

MATLAB simulations. This work was supported
by the Czech Science Foundation grant 204/08/1560
and 301/10/2370 and by Institutional Research Plans
AV0Z50040507, IAA500040701, AV0Z50040702
and 1QS500040581.
REFERENCES
Brazda V., Laister R.C., et al. (2011). Cruciform structures
are a common dna feature important for regulating bi-
ological processes. BMC Molecular Biology, 12:33.
Lexa M., Martinek T., et al. (2011). A dynamic program-
ming algorithm for identification of triplex-forming
sequences. Bioinformatics, 27:2510–2517.
Lilley, D. (1989). Structural isomerization in dna: The
formation of cruciform structures in supercoiled dna
molecules. Chemical Society Reviews, 18:53–83.
Markham, N. and Zuker, M. (2008). Unafold: software for
nucleic acid folding and hybridization. Methods in
Molecular Biology, 453:3–31.
Martinek, T. and Lexa, M. (2008). Hardware accelera-
tion of approximate palindrome searching. In The In-
ternational Conference on Field-Programmable Tech-
nolog., pages 65–72.
Neidle, S. (2002). Nucleic acid structure and recognition.
Oxford University Press.
Palecek E., Vlk D., et al. (1997). Tumor supressor protein
p53 binds preferentially to supercoiled dna. Onco-
gene, 15:2201–2209.
Palecek E., Brazda V., et al. (2004). Enhancement of p53
sequence-specific binding by dna supercoiling. Onco-
gene, 23:2119–2127.
Pennacchio L.A., Ahituv N., et al. (2006). In vivo enhancer
analysis of human conserved non-coding sequences.
Nature, 444:499–502.
Sinden, R. (1994). DNA structure and function. Academic
Press.
Singleton, C. and Wells, R. (1982). Relationship between
superhelical density and cruciform formation in plas-
mid pvh51. The Journal of Biological Chemistry,
257:6292–6295.
Url 1: http://www.fi.muni.cz/˜lexa/cruciform/index.html
Visited Oct 2011.
BIOINFORMATICS 2012 - International Conference on Bioinformatics Models, Methods and Algorithms
130
