
A GENERALIZED HIDDEN MARKOV MODEL FOR
PREDICTION OF CIS-REGULATORY MODULES
IN EUKARYOTE GENOMES AND DESCRIPTION
OF THEIR INTERNAL STRUCTURE
Anna A. Nilulova
1,2
, Alexander V. Favorov
3,4
, Vsevolod Yu. Makeev
4
and Andrey A. Mironov
1,2
1
Department of Bioengineering and Bioinformatics, Moscow State University, Leninskie Gory, Moscow, Russia
2
Institute for Information Transmission Problems, Russian Academy of Sciences, Bolshoi Karetnyi per., Moscow, Russia
3
Department of Oncology, School of Medicine, Johns Hopkins University, N. Broadway, Baltimore, MD, U.S.A.
4
Engelhardt Institute of Molecular Biology, Russian Academy of Sciences, Vavilova str., Moscow, Russia
Keywords: Generalized hidden markov models, Regulation of transcription, Cis-regulatory modules, Binding sites,
Regulatory structure, Eukaryotes.
Abstract: Eukaryotic regulatory regions have been studied extensively due to their importance for gene regulation in
higher eukaryotes. However, the understanding of their organization is clearly incomplete. In particular, we
lack accurate in silico methods for their prediction. Here we present a new HMM-based method for the
prediction of regulatory regions in eukaryotic genomes using position weight matrices of the relevant
transcription factors. The method reveals and then utilizes the regulatory region structure (preferred binding
site arrangements) to increase the quality of the prediction, as well as to provide a new knowledge of the
regulatory region organization. We show that our method can be successfully used for the identification of
regulatory regions in eukaryotic genomes with a quality higher than that of other methods. We also
demonstrate the ability of our algorithm to reveal structural features of the regulatory regions, which could
be helpful for the deciphering of the transcriptional regulation mechanisms in higher eukaryotes.
1 INTRODUCTION
Transcription of genes is regulated mostly by special
proteins – transcription factors (TFs) – which bind
the DNA at specific binding sites (TFBSs) and thus
influence the transcription. In eukaryotes, stage- and
tissue-specific transcription of genes is achieved
through the interaction of different TFs with each
other and their co-factors, as well as through other
mechanisms, such as the chromatine remodelling.
Eukaryotic TFBSs are too short and degenerate to
detect them accurately in silico. On the other hand
eukaryotic TFBSs are often organized in groups, cis-
regulatory modules (CRMs). These modules seem to
coordinate protein-protein interactions for proper
regulation of gene expression. But despite a great
interest in the regulatory modules, their organization
is still not completely understood. Most researches
pay attention to the close situation of TFBSs and
their types. However, the structure of modules (the
order of sites and the distances between them) were
shown to be important in many cases (Makeev,
2003); (Hallikas, 2006); (Papatsenko, 2009).
One could suppose that if the structure of
regulatory modules was really crucial for the
transcriptional regulation, it would be conserved
during the evolution. In this case, despite a
considerable sequence divergence, regulatory
regions of orthologous genes should possess a
similar structure.
On the other hand, regulatory regions of co-
regulated genes also seem to be similar. Thus, the
analysis of the regulatory regions of orthologous
and/or co-regulated genes could reveal some rules or
preferences of site arrangements, which are common
for most of genes, and which therefore could be
important for a proper transciption regulation.
Here, we present a method called CORECLUST,
which uses a HMM-based technique to predict
regulatory modules for a set of known position
weight matrices (PWMs) for system-specific TFs.
The algorithm constructs a model of the regulatory
34
A. Nilulova A., V. Favorov A., Yu. Makeev V. and A. Mironov A..
A GENERALIZED HIDDEN MARKOV MODEL FOR PREDICTION OF CIS-REGULATORY MODULES IN EUKARYOTE GENOMES AND DESCRIP-
TION OF THEIR INTERNAL STRUCTURE.
DOI: 10.5220/0003735800340041
In Proceedings of the International Conference on Bioinformatics Models, Methods and Algorithms (BIOINFORMATICS-2012), pages 34-41
ISBN: 978-989-8425-90-4
Copyright
c
2012 SCITEPRESS (Science and Technology Publications, Lda.)
regions that describes preferences of site
arrangements; the preferences can be revealed from
given regulatory sequences of co-regulated and/or
orthologous genes. The model then can be used for
searching for similar regulatory regions in the
sequences of interest or genome-wide.
2 ALGORITHM
The main idea of the algorithm is to scan genomic a
sequence and to search for segments that are much
more likely to be generated by a probabilistic
process that uses the model than by a random
background process. The model (hidden Markov
model) describes regulatory regions, the clusters of
binding sites, which can prefer some specific
relative arrangements (regulatory structure). We
describe the structure as a set of characteristics, such
as sites frequencies, sites order, and distance
distributions between adjacent sites. The preferences
of site arrangements, if any, can be obtained from
given regulatory sequences by training of the model
parameters.
2.1 The Hidden Markov Model
The hidden Markov model (HMM) presented here
describes the probabilistic process that is assumed to
generate a sequence with inclusions of cis-regulatory
module(s). The generated sequence consists of
segments (or subsequences) of three types:
background sequence;
TFBSs;
inter-site regions (spacers), that is the regions
between two adjacent sites in one module.
Each CRM begins and ends with a site; CRMs are
surrounded by a background sequence.
Our HMM is of a generalized type (Rabiner,
1989), which means that each generative state emits
a string of nucleotides, rather than a single symbol.
This allows us to set any desirable distribution for
the length of strings generated from every emitting
state of the model.
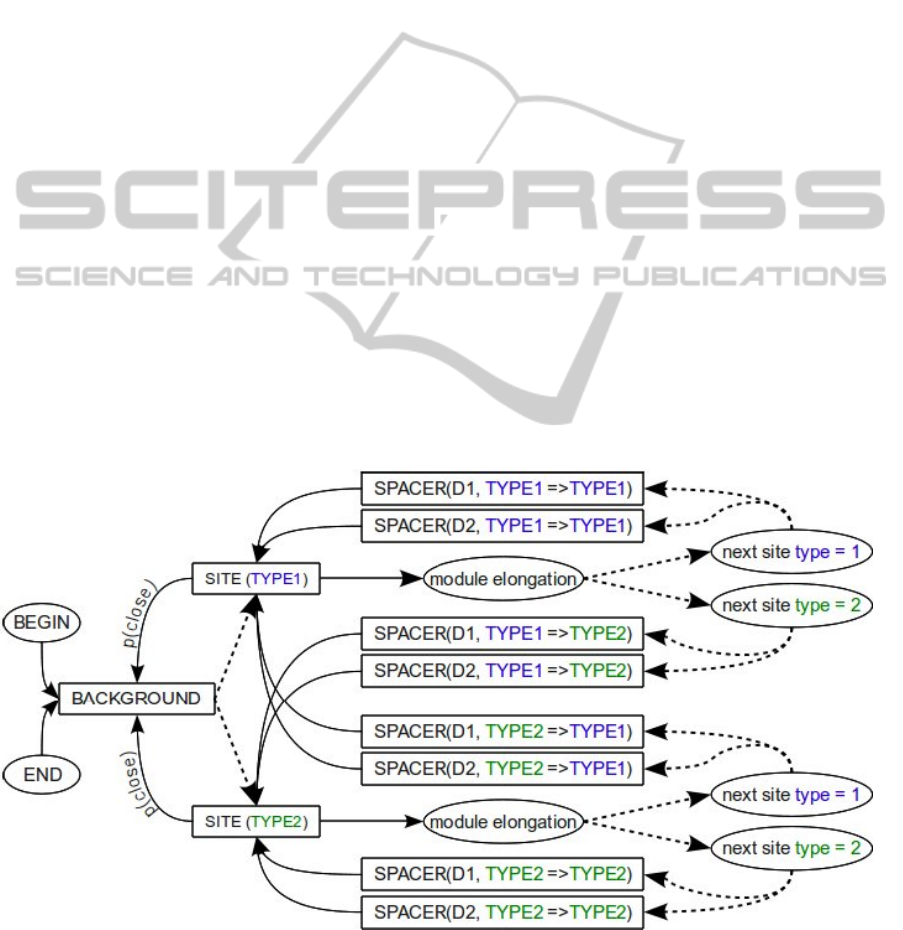
The HMM contains three main types of
generative states, which correspond to the types of
the sequence segments: inter-module background
sequence, sites and spacers (Figure 1). The
background sequence is generated according to the
first order local Markov model. The length of the
sequences emitted in the BACKGROUND state is
geometrically distributed with a mean 1/ p
open
. (p
open
is a probability to start a CRM).
Each SITE state emits a sequence according to
the corresponding position weigh matrix (PWM) in
one of the two orientations. In all SPACER states
nucleotides are generated according to the same
local Markov model as we use for the
Figure 1: The HMM scheme for two types of sites (TYPE1 and TYPE2) and two types of SPACER states, which vary in
their length distributions (D1 and D2). The emitting states are represented by rectangular boxes and the silent states are
shown by oval shapes. Arrows represent allowed transitions between states. Probabilities of the transitions marked by
dashed lines are updated during the Baum-Welch training.
A GENERALIZED HIDDEN MARKOV MODEL FOR PREDICTION OF CIS-REGULATORY MODULES IN
EUKARYOTE GENOMES AND DESCRIPTION OF THEIR INTERNAL STRUCTURE
35
BACKGROUND state. The length distribution
varies between the SPACER states of different
types, which will be described later.
The architecture of the model allows us to take
into account preferences in site arrangement
(regulatory structure), which include: 1) correlations
between binding sites of certain types and 2)
preferred distribution of the distance between
adjacent TFBSs of certain types (i.e. the length of
the spacer region). The correlation of TFBSs of
certain types could mean that the corresponding TFs
work together and their interaction is required for
the CRM activity. And if two TFs interact with each
other, the relative arrangement of their binding sites
should be non-random, with some preferences in
distance between the sites.
The structure of regulatory regions is taken into
account by introducing the set of SPACER states
with different length distribution and the set of silent
states that determine the choice of the next site type
and the type of the spacer state. In this work, we use
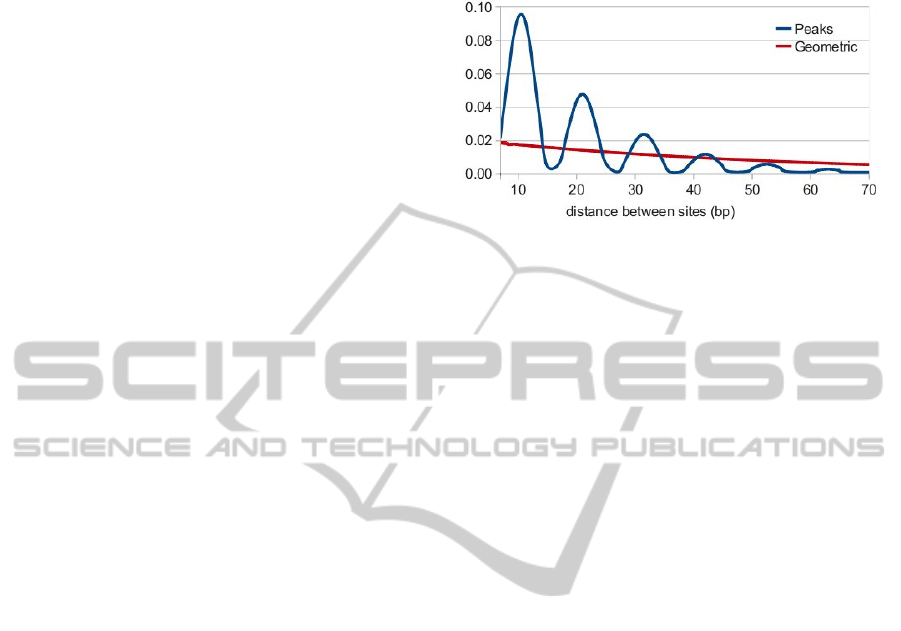
two types of SPACER state with length distributed
according to either the geometric distribution, which
reflects sites clustering without any distance
specificity or the exponentially damped sinusoid
with a period of 10.5 bp, which corresponds to the
situation when interacting proteins are bound on the
same side of the DNA strand (Figure 2).
To reveal the regulatory structure from a given
set of sequences, we train the parameters that
determine the module structure (transitions marked
with dashed lines in Figure 1) by using the Baum–
Welch algorithm (Baum, 1972).
2.2 Search For Regulatory Modules
To find regulatory modules in a given sequence we
apply the trained model to the sequence and search
for the best way to segment it in the background and
CRM states (the latter are combinations of sites and
spacer regions). It corresponds to a path in the HMM
graph, which fits best our model. To find this path
we use the posterior Viterbi decoding algorithm,
described in (Fariselli, 2005), which was shown to
have a better performance than the standard Viterbi
or posterior decoding algorithms.
The algorithm identifies some CRMs in a
sequence, if any. To weight a module, we use the
log-likelihood ratio, which reflects how likely it is
that this sub-sequence was generated by the
regulatory region model, as compared to being
generated by the background model. It equals the
log-ratio of the probabilities of two sub-paths in the
HMM graph that emit the module and the
background sequence, respectively; both sub-paths
span from the beginning to the end of the module.
Figure 2: Distributions of distance between adjacent sites
in a module that are used in the model.
3 TESTING
3.1 Testing On The Vertebrate Muscle
Dataset
The muscle dataset, which initially was compiled by
Wasserman and Fickett (Wasserman, 1998), now is
widely used to assess the quality of the CRM
prediction programs. We used this dataset to test the
ability of CORECLUST to identify CRMs in a set of
upstream regions of co-regulated and orthologous
genes. The dataset consists of sequences with an
average length of 850 bp, which contain known
regulatory regions for 19 muscle genes from human,
mouse, cow and chicken. The set of PWMs includes
5 TFs, reported to be important in muscle regulation:
Mef2, Myf, Sp1, Srf and Tef. The dataset as well as
the assessment procedure were taken from (Klepper,
2008). These authors developed a benchmarking
framework for assessing programs' performance and
used it to evaluate the performance of eight
published module-discovery tools. We assessed the
performance of CORECLUST and compared the
results with other eight programs describer in the
paper (CMA (Kel, 2006), CisModule (Zhou, 2004),
ModuleSearcher (Aerts, 2003), Stubb (Sinha, 2003),
MSCAN (Johansson, 2003), MCAST (Bailey,
2003), Cister (Frith, 2001) and Cluster-Buster (Frith,
2003)).
To measure the prediction accuracy of the
method with respect to module location, we used six
measures described in (Klepper, 2008):
correlation coefficient (CC);
sensitivity (Sn);
specificity (Sp);
positive predictive value (PPV);
BIOINFORMATICS 2012 - International Conference on Bioinformatics Models, Methods and Algorithms
36

performance coefficient (PC, phi-score);
average site performance (ASP).
The sensitivity gives the fraction of nucleotides
known to be in a CRM that are correctly identified
as such. The specificity measures the proportion of
background nucleotides, which are correctly
identified. The positive predictive value gives the
fraction of nucleotides predicted to be in a CRM that
are known to be in one. The correlation coefficient,
performance coefficient and average site
performance are statistics that in some sense average
these quantities.
The results of the programs' performance
assessment (
Table 1) show that CORECLUST scored
better than other programs for almost all measures.
Losing a little in the sensitivity, the program scores
highest of all for the CC measure, which captures
the sensitivity and specificity values into a single
score.
3.2 Testing on the Drosophila Early
Developmental System
Genes of the Drosophila anterior-posterior axis
specification process (AP) have rather long
regulatory regions situated about 10-15 Kbp from
the respective transcription start sites (TSS).
Moreover there are twelve annotated genomes of the
Drosophila genus available in public databases. All
this allows us to use the upstream regions of genes
from only one orthologous group as a training set
without overfitting.
We assessed the performance of CORECLUST
using 17 AP genes from the D.melanogaster
genome, shown to possess experimentally verified
regulatory regions, bound by all or some of seven
TFs: Bcd, Hb, Cad, Kr, Kni, Tll and Gt. The model
training and CRM search were done for every gene
separately with the use of all available orthologous
sequences. As CRM predicting programs, used for
the prediction comparison, search for CRMs in the
same sequences they train the model on, we used the
same strategy for CORECLUST testing. The
predictions were made for 40Kb region ([-20Kb,
+20Kb] relative to TSS) of each gene. The modules
predicted in D. melanogester sequences were
compared with the known ones from the REDFly
database (Halfon, 2008).
As a performance measure we applied the
correlation coefficient (CC) as it combines all
aspects of the predictions quality. The results of the
performance analysis were compared with three
other publicly available programs: Stubb (Sinha,
2003), MOPAT (Hu, 2008) and Cluster-Buster
(Cbust) (Frith, 2003). The comparison shows (Table
2) that predictions made by CORECLUST have a
higher value of CC than Stubb (p-value = 0.05,
Wilcoxon signed-rank test), MOPAT (p-value =
0.00067, Wilcoxon signed-rank test) and Cluster-
Buster (p-value = 0.02, Wilcoxon signed-rank test).
The testing of the program on two distinct
systems shows that it is applicable to different
regulatory systems and eukaryotic clades and can be
successfully used for solving the standard problem
of identification cis-regulatory modules for a set of
system-specific TFs.
Table 1: Comparison of the programs' performance. The two maximum values in each column is set in bold. The maximum
value is marked by gray background. CC - correlation coefficient, Sn - sensitivity, Sp - specificity, PPV - positive predictive
value, PC - performance coefficient, ASP - average site performance.
Methods CC Sn Sp PPV PC ASP
CORECLUST 0.56 0.66 0.93 0.58 0.45 0.62
MSCAN 0.50 0.63 0.91 0.51 0.39 0.57
ModuleSearcher 0.46 0.48
0.95 0.57 0.35 0.53
CMA 0.46 0.56 0.92 0.51 0.36 0.53
Cluster-Buster 0.41 0.74 0.80 0.35 0.31 0.55
Cister 0.36 0.92 0.61 0.25 0.25 0.59
MCAST 0.30
0.96 0.48 0.21 0.21 0.58
CisModule 0.29 0.72 0.70 0.25 0.23 0.49
Stubb 0.24 0.65 0.70 0.24 0.21 0.44
A GENERALIZED HIDDEN MARKOV MODEL FOR PREDICTION OF CIS-REGULATORY MODULES IN
EUKARYOTE GENOMES AND DESCRIPTION OF THEIR INTERNAL STRUCTURE
37

Table 2: Comparison of the programs' performance. The
maximum value in each line is set in bold.
Gene CORECLUST MOPAT
bowl 0.20 0.10 -0.01 0.17
0.45 0.27 0.31 0.47
cad -0.03 0.17 -0.02 -0.04
ems -0.02 0.15 -0.01 -0.02
eve 0.73 0.56 0.54 0.58
0.31 0.28 0.27 -0.02
0.31 0.36 0.32 0.27
gt 0.41 0.48 0.27 0.40
h 0.69 0.17 0.26 0.49
0.32 0.33 0.17 0.22
0.43 0.22 0.27 0.45
Kr 0.45 0.24 0.29 0.64
0.26 0.14 0.13 0.17
run 0.08 0.17 0.07 0.11
0.23 0.07 -0.01 0.17
slp1 0.35 0.34 0.44 0.35
0.26 0.15 0.09 0.17
TOTAL 0.32 0.20 0.20 0.29
median 0.31 0.22 0.26 0.22
0.21 0.13 0.17 0.21
P-value 0.049 0.00067 0.0197
Stubb Cbust
btd
fkh
ftz
hb
kni
prd
salm
tll
st.dev.
4 THE INTERNAL STRUCTURE
OF THE PREDICTED
REGULATORY MODULES
CORECLUST predicts regulatory modules that are
characterized by similar structure, which allows to
reveal and analyze the rules of site arrangement. The
structure of regulatory regions from training
sequences can be taken from the HMM parameters.
But it is even more interesting to study preferred site
arrangements in the predicted modules. As the
model describes preferences, but not strict rules, of
site arrangements, the regulatory regions that are
found in real genomic sequences can possess some
structural features not included in the model in
advance.
To reveal pairs of sites that are situated next to
each other more frequently than it is expected by
chance (in the case of site independence), we use the
Pearson correlation coefficient:
)1()1(
),(
,
jjii
jiji
pppp
ppp
jiCorr
,
where p
i
is the frequency of an occurrence of a site
of type i next to any other site, p
j
is the frequency of
an occurrence of a site of type j next to any other site
and p
i,j
is the frequency of an occurrence of a site of
type i next to a site of type j (the order and directions
of sites are taken into account).
4.1 Structural Analysis of CRMs
Found in the Drosophila Genomes
The method is applicable for genome-wide search.
That is, after training the model on regulatory
regions of some gene (“starting” gene) and its
orthologs it can be used for searching for similar
regulatory regions genome-wide.
We used each of the 17 Drosophila
developmental genes as a “starting” gene and then
searched all Drosophila genomes for regulatory
regions with the similar structure. After this we
revealed the overrepresented site pairs for every run
(every “starting” gene).
Noticeably, some of the observed
overrepresented site pairs were documented before.
For instance, the interaction of Bcd proteins was
shown to be important for transcriptional regulation
of genes hb and kni (Lebrecht, 2005). This is
consistent with our observations that Bcd-Bcd site
pair is overrepresented in the regulatory regions
found by the hb- and kni-trained models. Also, the
Hb-Hb and Cad-Cad correlations have been recently
shown in (Papatsenko, 2009), which also fits well to
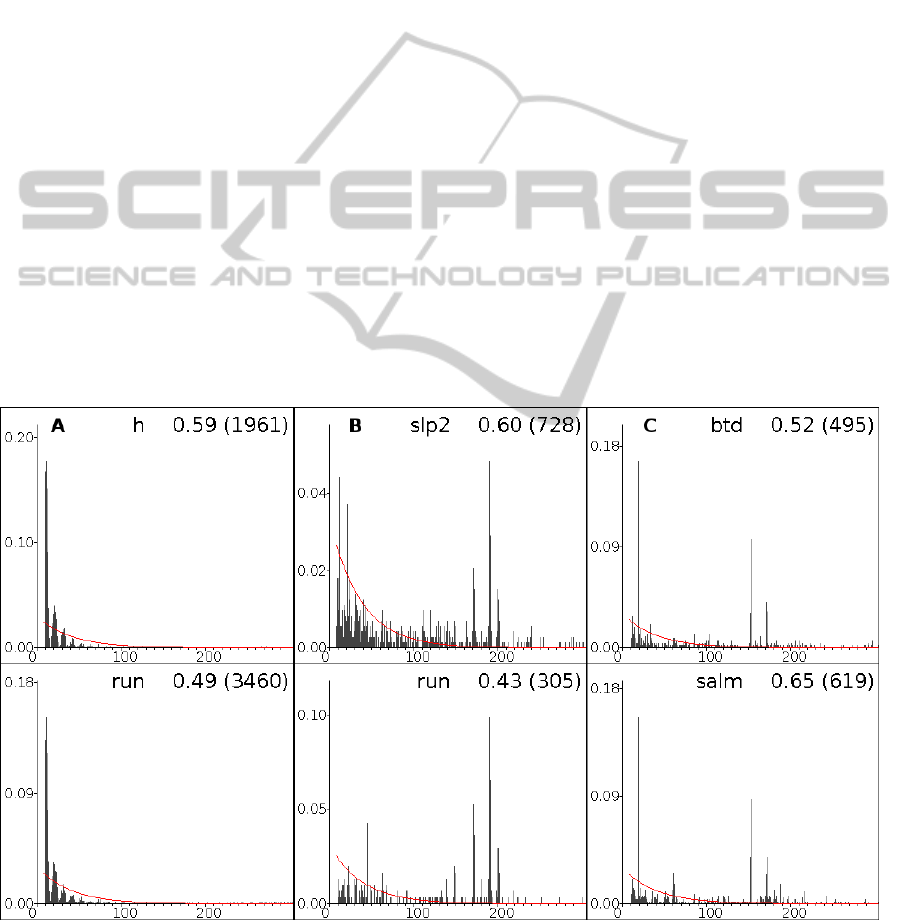
our predictions. Moreover, according to our
predictions, the site-to-site distances in the Hb-Hb
site pair have a periodic helical distribution (Figure
3A), which also has been observed in (Papatsenko,
2009).
Interestingly, although for different “starting”
genes we observe different sets of overrepresented
site pairs, some of the pairs are typical for several
genes simultaneously. This phenomenon may be
interpreted as a characteristic of the whole
regulatory system. For example, the site pair
Hb<Hb< (two Hb binding sites, the direction of an
“arrow” ('<' or '>') shows the direction of the site
relative to the gene direction) is significantly
overrepresented for 10 starting genes and in all cases
the distance between the sites is distributed
according to the damped sinusoid (Figure 3A).
An example of a distance distribution, which is
not included in the model, but still is observed in the
predicted regulatory regions, is provided by the
distribution for the pair Bcd>Bcd> (two Bcd binding
sites, both situated on the positive DNA strand
relative to the gene direction). This site pair is
overrepresented for six “starting” genes and in all
cases the site-to-site distance distribution has an
unusual high peak at distance 190-191 bp, as well as
at distances 200-202 bp and 171-172 bp (Figure 3B).
BIOINFORMATICS 2012 - International Conference on Bioinformatics Models, Methods and Algorithms
38
Such long distances between sites are rather
uncommon and perhaps could indicate that the
corresponding TFs interact with DNA wound around
a histone protein core.
Similarly interesting are the site-to-site distance
distributions for the pair Tll<Tll<. This pair is
overrepresented only for three starting genes but for
all of them most Tll<Tll< site pairs have
characteristic distances: 19 bp, 152-153 bp, and 171-
172 bp (Figure 3C).
One more observation on the site relative
arrangements is that the relative orientation of the
sites in a pair seems to be important. For most TF
pairs we found an overrepresentation for only some
orientation arrangements. For instance, for the
predictions made by the h-trained model, only two
types of the Kni site pairs were overrepresented:
Kni>Kni> and Kni<Kni<, which are pairs of sites on
the same DNA strand. The orientation relative to the
regulated gene also could be of importance: only site
pair Hb<Hb< is significantly overrepresented for the
starting gene h and several other genes.
These observations demonstrate that TFs
function cooperatively: if two TFs interact with each
other when binding the DNA, the orientation of their
binding sites should be crucial for successful
regulation.
4.2 Structural Analysis of CRMs In
Vertebrate Genomes
For the regulatory regions predicted by the model
trained on the muscle genes we also observe
overrepresented site pairs, most of which are
supported by the experimental data. For example,
binding sites of TFs Myf and Mef2, as well as Sp1
and Myf, occur next to each other unexpectedly
often in the predicted modules; the validity of this is
confirmed by the data from the database of
composite elements TransCompel (Matys, 2006).
Predicted interaction of the TFs Tef and Mef2 is
confirmed by (Maeda, 2002).
For this regulatory system, we also observe the
importance of specific sites relative orientation.
Thus, for Sp1 TF only S1>Sp1> and Sp1<Sp1<
site pairs are overrepresented, while the pair
Sp1>Sp1< is underrepresented.
The results presented in this section argue that in
many cases the regulatory structure is important and
could be used as an additional information for the
prediction of functional CRMs and understanding of
the transcriptional regulation mechanisms in
eukaryotes.
Figure 3: Examples of distributions of distances between adjacent sites for pairs Hb<Hb< (A), Bcd>Bcd> (B) и Tll>Tll>
(C) in the regulatory modules, predicted for models trained on different starting genes. The starting (training) gene, the
correlation coefficient and the number of observed pairs (in brackets) are given at each plot. The random distance
distribution is shown by the red line.
A GENERALIZED HIDDEN MARKOV MODEL FOR PREDICTION OF CIS-REGULATORY MODULES IN
EUKARYOTE GENOMES AND DESCRIPTION OF THEIR INTERNAL STRUCTURE
39

5 CONCLUSIONS
We have developed a new algorithm
CORECLUST based on generalized hidden
Markov models, which is able to successfully
predict regulatory modules in eukaryotic genomes
for a set of PWMs starting from a set of co-
regulated and/or orthologous genes. CORECLUST
utilizes the cross-species conservation without
relying on multiple alignment, which can be useful
for analysis of poorly alignable intergenic regions.
The main disadvantage of the algorithm is the
limitation of number of used PWMs, as it causes
the increase of the HMM parameters, which can
result in model overfitting. The future work aims
to overcome this limitation by reducing the number
of training parameters to only significant ones.
Nevertheless, CORECLUST demonstrates better
performance than other methods. The main
biological advantage of the method is that it
reveals regulatory regions structure, which could
help in better understanding of the transcriptional
regulation process.
ACKNOWLEDGEMENTS
We are grateful to Mikhail Gelfand and Dmitri
Pervouchine for useful discussions and
encouragement, and to Dmitry Vinogradov for
technical assistance.
REFERENCES
Moore, R., Lopes, J., 1999. Paper templates. In
TEMPLATE’06, 1st International Conference on
Template Production. SciTePress.
Smith, J., 1998. The book, The publishing company.
London, 2
nd
edition.
Aerts, S., Van Loo, P., Thijs, G., Moreau, Y., De Moor,
B., 2003. Computational detection of cis -regulatory
modules. In Bioinformatics, 19 Suppl 2.
Bailey, T. L., Noble, W. S., 2003. Searching for
statistically significant regulatory modules. In
Bioinformatics, 19 Suppl 2.
Baum L., 1972. An equality and associated
maximization technique in statistical estimation for
probabilistic functions of Markov processes. In
Inequalities, 3.
Fariselli, P., Martelli, P. L., Casadio, R., 2005. A new
decoding algorithm for hidden Markov models
improves the prediction of the topology of all-beta
membrane proteins. In BMC Bioinformatics.
Frith, M. C., Hansen, U., Weng, Z., 2001. Detection of
cis-element clusters in higher eukaryotic DNA. In
Bioinformatics, 6 Suppl 4.
Frith, M. C., Hansen, U., Weng, Z., 2001. Detection of
cis-element clusters in higher eukaryotic DNA. In
Bioinformatics,17, no. 10.
Frith, M. C., Li, M. C., Weng, Z., 2003. Cluster-Buster:
finding dense clusters of motifs in DNA sequences.
In Nucleic Acids Research, 31, no. 13.
Halfon, M. S., Gallo, S. M., Bergman, C. M., 2008.
REDfly 2.0: an integrated database of cis-regulatory
modules and transcription factor binding sites in
Drosophila. In Nucleic Acids Research, 36.
Hallikas, O., Palin, K., Sinjushina, N., Rautiainen, R.,
Partanen, J., Ukkonen, E., Taipale, J., 2006.
Genome-wide Prediction of Mammalian Enhancers
Based on Analysis of Transcription-Factor Binding
Affinity. In Cell, 124(1).
Hu, J., Hu, H., Li, X., 2008. MOPAT: a graph-based
method to predict recurrent cis-regulatory modules
from known motifs. In Nucleic Acids Research,
36(13).
Johansson, O., Alkema, W., Wasserman, W. W.,
Lagergren, J., 2003. Identification of functional
clusters of transcription factor binding motifs in
genome sequences: the MSCAN algorithm. In
Bioinformatics, 19 Suppl 1.
Kel, A., Konovalova, T., Waleev, T., Cheremushkin, E.,
Kel-Margoulis, O., Wingender, E., 2006. Composite
Module Analyst: a fitness-based tool for
identification of transcription factor binding site
combinations. In Bioinformatics, 22(10).
Klepper, K., Sandve, G. K., Abul, O., Johansen, J.,
Drablos, F., 2008. Assessment of composite motif
discovery methods. In BMC Bioinformatics, 9.
Lebrecht, D., Foehr, M., Smith, E., Lopes, F. J. P.,
Vanario-Alonso, C. E., Reinitz, J., Burz, D. S., et al.,
2005. Bicoid cooperative DNA binding is critical for
embryonic patterning in Drosophila. In
Proceedings
of the National Academy of Sciences of the United
States of America, 102(37).
Maeda, T., Gupta, M. P., Stewart, A. F. R., 2002. TEF-1
and MEF2 transcription factors interact to regulate
muscle-specific promoters. In Biochemical and
Biophysical Research Communications, 294(4).
Makeev, V. J., Lifanov, A. P., Nazina, A. G.,
Papatsenko, D. A., 2003. Distance preferences in the
arrangement of binding motifs and hierarchical
levels in organization of transcription regulatory
information. In Nucleic Acids Research, 31(20).
Matys, V., Kel-Margoulis, O. V., Fricke, E., Liebich, I.,
Land, S., Barre-Dirrie, A., Reuter, I., et al., 2006.
TRANSFAC and its module TRANSCompel:
transcriptional gene regulation in eukaryotes. In
Nucleic Acids Research, 34.
Papatsenko, D., Goltsev, Y., Levine, M., 2009.
Organization of developmental enhancers in the
Drosophila embryo. In Nucleic Acids Research, 37,
no. 17.
Rabiner, L. R., 1989. A tutorial on hidden markov
models and selected applications in speech
BIOINFORMATICS 2012 - International Conference on Bioinformatics Models, Methods and Algorithms
40

recognition. In PROCEEDINGS OF THE IEEE, 77.
Sinha, S., van Nimwegen, E., Siggia, E. D., 2003. A
probabilistic method to detect regulatory modules. In
Bioinformatics, 19 Suppl 1.
Wasserman, W. W., Fickett, J. W., 1998. Identification
of regulatory regions which confer muscle-specific
gene expression. In Journal of Molecular Biology,
278(1).
Zhou, Q., Wong, W. H., 2004. CisModule: De novo
discovery of cis-regulatory modules by hierarchical
mixture modeling. In Proceedings of the National
Academy of Sciences of the United States of
America, 101(33).
A GENERALIZED HIDDEN MARKOV MODEL FOR PREDICTION OF CIS-REGULATORY MODULES IN
EUKARYOTE GENOMES AND DESCRIPTION OF THEIR INTERNAL STRUCTURE
41
