
FUSION OF OPTICAL AND THERMAL IMAGERY AND LIDAR
DATA FOR APPLICATION TO 3-D URBAN ENVIRONMENT
Pattern Recognition Applications in Remotely
Sensed Hyperspectral Image Analysis
Anna Brook
1
, Marijke Vandewal
1
, Rudolf Richter
2
and Eyal Ben-Dor
3
1
Royal Military Academy, Department CISS, Brussels, Belgium
2
German Aerospace Center DLR, Remote Sensing Data Center, Wessling, Germany
3
Tel-Aviv University, Department of Geography and Human Environment,
Remote Sensing Laboratory, Ramat Aviv, Tel-Aviv, Israel
Keywords: LiDAR, Airborne and ground hyperspectral remote sensing, Airborne and ground thermal remote sensing,
Fuzzy logic, eCognition, Data fusion, 3-D urban environment, 5-D database.
Abstract: Investigation of urban environment includes a wide range of applications that require 3-D information. New
approaches are needed for near-real-time analysis of the urban environment with natural 3-D visualization
of extensive coverage. The remote sensing technology is a promising and powerful tool to assess
quantitative information of urban materials and structures. This technique provides ability for easy, rapid
and accurate in situ assessment of corrosion, deformations and ageing processes in the spatial (2-D) and the
spectral domain within near-real-time and with high temporal resolution. LiDAR technology offers precise
information about the geometrical properties of the surfaces and can reflect the different shapes and
formations in the complex urban environment. Generating a monitoring system that is based on integrative
fusion of hyperspectral, thermal and LiDAR data may enlarge the application envelope of each individual
technology and contribute valuable information on the built urban environment. A fusion process defined by
a data-registration algorithm and including spectral/thermal/spatial and 3-D information has been
developed. The proposed practical 3-D urban environment application may provide urban planners, civil
engineers and decision-makers with tools to consider temporal, quantitative and thermal spectral
information in the 3-D urban space.
1 INTRODUCTION
The most common approach to characterizing urban
environments from remote sensing imagery is land-
use classification. In contrast, mapping the urban
environment in terms of its physical components
preserves the heterogeneity of urban land cover
better than traditional land-use classification
methods (Jensen and Cowen, 1999), characterizes
urban land cover independent of analyst-imposed
definitions and captures more accurately changes
with time.
The spectral (reflective and thermal) properties
of the urban surfaces are known to be rather
complex as they are composed of many materials.
Thematic categories are determined by the principles
of urban mapping, which primarily distinguishes
main types of urban land uses (Roessner et al.,
2001).
The ultimate aim in photogrammetry in
generating an urban landscape model is to show the
objects in an urban area in 3-D (Juan et al., 2007).
As the most permanent features in the urban
environment, an accurate extraction of buildings and
roads is significant for urban planning and
cartographic mapping. Traditionally, the extraction
of buildings relies mainly on manual interpretation,
which remains an expensive and time-consuming
process (Ameri, 2000).
Given the high degree of spatial and spectral
heterogeneity within various artificial and natural
land cover categories, the application of remote
sensing technology to mapping built urban
environments requires specific attention to both 3-D
and spectral domains (Segl et al., 2003). Segl
confirms that profiling hyperspectral TIR can
394
Brook A., Vandewal M., Richter R. and Ben-Dor E..
FUSION OF OPTICAL AND THERMAL IMAGERY AND LIDAR DATA FOR APPLICATION TO 3-D URBAN ENVIRONMENT - Pattern Recognition
Applications in Remotely Sensed Hyperspectral Image Analysis.
DOI: 10.5220/0003845003940405
In Proceedings of the 1st International Conference on Pattern Recognition Applications and Methods (PRARSHIA-2012), pages 394-405
ISBN: 978-989-8425-98-0
Copyright
c
2012 SCITEPRESS (Science and Technology Publications, Lda.)

successfully identify and discriminate a variety of
silicates and carbonates, as well as variations in the
chemistry of some silicates. The integration of
VNIR-SWIR and TIR results can provide useful
information to remove possible ambiguous
interpretations in unmixed sub-pixel surfaces and
materials.
Hyperspectral thermal infrared (TIR) remote
sensing has rapidly advanced with the development
of airborne systems and follows years of laboratory
studies (Hunt and Vincent, 1968; Conel, 1969,
Salisbury et al., 1987). The radiance emitted from a
surface in thermal infrared (4-13μm) is a function of
its temperature and emissivity. Emittance and
reflectance are complex processes that depend not
only on the absorption coefficient of materials but
also on their reflective index, physical state and
temperature. Most urban built environment studies
are taking into account both temperature and
emissivity variations, since these relate to the targets
identification, mapping and monitoring and provide
a mean for practical applications.
The hyperspectral thermal imagery provides the
ability for mapping and monitoring temperatures
related to the man-made materials. The urban heat
island (UHI) has been one of the most studied and
best-known phenomena of urban climate
investigated by thermal imagery (Carlson et al.,
1981; Vukovich, 1983; Kidder and Wu, 1987; Roth
et al., 1989; Nichol, 1996). The preliminary studies
have reported similarities between spatial patterns of
air temperature and remotely sensed surface
temperature (Nichol, 1994), whereas progress
studies suggest significant differences, including the
time of day and season of maximum UHI
development and the relationship between land use
and UHI intensity (Roth et al., 1989). The recent
high-resolution airborne systems determine the
thermal performance of the building that can be used
to identify heating and cooling loss due to poor
construction, missing or inadequate insulation and
moisture intrusion.
Over the last few years, LiDAR (LIght Detection
And Ranging) has been widely applied in the field of
photogrammetry and urban 3-D analysis (Tao, 2001,
Zhou, 2004). Airborne LiDAR techniques provide
geo-referenced 3-D dense points (“cloud”) measured
roughly perpendicular to the direction of flight over
a reflective surface on the ground. This system
integrates three basic data-collection tools: a laser
scanner, a global positioning system (GPS) and an
inertial measuring unit (IMU). The position and
altitude of the system being determined by
GPS/INS, the raw data are collected in the GPS
reference system WGS 84.
The main objectives of many studies are linked
to, and rely on a historical set of remotely sensed
imagery for quantitative assessment and spatial
evolution of an urban environment (Jensen and
Cowen, 1999, Donnay et al., 2001, Herold et al.,
2003, 2005).
This paper presents a 3-D urban environment
application. The ability to include an accurate and
realistic 3-D position, quantitative spectral
information, thermal properties and temporal
changes is provided by a near-real-time monitoring
system for photogrammetric and urban planning
purposes. The task for a fully controlled and realistic
monitoring system led us first to combine the image-
processing and map-matching procedures, and then
to incorporate remote sensing and GIS tools into an
integrative method for data fusion.
2 MATERIALS AND METHODS
2.1 Study Area
Two separate datasets were utilized in this study.
The first dataset was acquired over the suburban
area of Ma'alot Tarshiha (33°00'52''N/35°17'E), an
urban settlement in the north of Israel, on 10 Oct
2006 at 03h37 UTC and at 11h20 UTC. This area
combines natural and engineered terrains (average
elevation of 560m above sea level), a hill in the
north of the studied polygon area and a valley in the
center. The entire scene consists of rows of terraced
houses located at the center of the image. The
neighborhood consists of cottage houses (two and
three floors) with tile roofs, flat white-colored
concrete roofs and balconies, asphalt roads and
parking lots, planted and natural vegetation, gravel
paths and bare brown forest soil. The height of large
buildings ranges from 8 to 16 m. A group of tall pine
trees with various heights and shapes are located on
the streets and the Mediterranean forest can be found
in the corner of the scene.
The second dataset was acquired over the area of
Qalansawe (32°01'40''N/35°30'E), an urban
settlement in the center of Israel, on 15 Aug 2007 at
02h54 UTC and at 12h30 UTC. This area combines
natural, agriculture and engineered terrains (average
elevation of 30m above sea level). The urban
settlement consists of houses (two and three floors)
and public buildings (schools and municipalities
buildings) with flat concrete, asphalt or whitewash
roofing, asphalt roads and parking lots, planted and
natural vegetation, gravel paths, bare brown reddish
FUSION OF OPTICAL AND THERMAL IMAGERY AND LIDAR DATA FOR APPLICATION TO 3-D URBAN
ENVIRONMENT - Pattern Recognition Applications in Remotely Sensed Hyperspectral Image Analysis
395

Mediterranean and agriculture soils, greenhouses
and whitewash henhouse roofing. The height of
large buildings ranges from 3 to 21 m.
2.2 Data-acquisition Systems
The research combines airborne and ground data
collected from different platforms and different
operated systems. The collected imagery data were
validated and compared to the ground truth in situ
measurements collected during the campaigns.
The first airborne platform combines two
hyperspectral systems: AISA-Dual and TIR system.
The airborne imaging spectrometer AISA-Dual
(Specim Ltd.) is a dual hyperspectral pushbroom
system, which combines the Aisa EAGLE (VNIR -
Visible and Near Infrared region) and Aisa HAWK
(SWIR - Short Wave Infrared region) sensors. For
the selected campaigns, the sensor simultaneously
acquired images in 198 contiguous spectral bands,
covering the 0.4 to 2.5 µm spectral region with
bandwidths of ~10 nm for Aisa EAGLE and ~5 nm
for Aisa HAWK. The sensor altitude was 10,000 ft,
providing a 1.6 m spatial resolution for 286 pixels in
the cross-track direction. A standard AISA-Dual
dataset is a 3-D data cube in a non-earth coordinate
system (raw matrix geometry).
The airborne hyperspectral TIR system, installed
next to the AISA-Dual sensor on the same platform,
is a line-scanner with 28 spectral bands in the
thermal ranges 3-5 μm and 8-13 μm. It has 328
pixels in the cross-track direction and hundreds of
pixels in the along-track direction with a spatial
resolution of 1.4m.
The second airborne platform carries the LiDAR
system. This system operates at 1500 nm
wavelength with a 165 kHz laser repetition rate and
100 Hz scanning rate and provides a spatial/footprint
resolution of 0.5 m and an accuracy of 0.1 m. The
scanner has a multi-pulse system that could record
up to five different returns, but in this study, only the
first return was recorded and analyzed.
The ground spectral camera HS (Specim Ltd.) is
a pushbroom scan camera that integrates ImSpector
imaging spectrograph and an area monochrome
camera. The camera's sensitive high speed interlaced
CCD (Charge-Coupled Device) detector
simultaneously acquires images in 850 contiguous
spectral bands and covers the 0.4 to 1 µm spectral
region with bandwidths of 2.8 nm. The spatial
resolution is 1600 pixels in the cross-track direction,
and the frame rate is 33 fps with adjustable spectral
sampling.
The ground truth reflectance data were measured
for the calibration/validation targets by the ASD
"FieldSpec Pro" (ASD.Inc, Boulder, CO) VNIR-
SWIR spectrometer. Internally averaged scans were
100 ms each. The wavelength-dependent signal-to-
noise ratio (S/N) is estimated by taking repeat
measurements of a Spectralon white-reference panel
over a 10-min interval and analyzing the spectral
variation across this period. For each sample, three
spectral replicates were acquired and the average
was used as the representative spectrum. The ground
truth thermal data were collected by a thermometer
and thermocouples installed within
calibration/validation targets (water bodies) and a
FLIR thermal infrared camera (FLIR Systems, Inc.).
2.3 Data Processing
This research integrates multi-sensor (airborne
sensor, ground camera and field devices) and multi-
temporal information into a fully operational
monitoring application. The aim of this sub-
paragraph is to present several techniques for
imagery and LiDAR data processing.
2.3.1 Hyperspectral Imagery
Accurate spectral reflectance information is a key
factor in retrieving correct thematic results. The
AISA-Dual images were subjected to the full-chain
SVC (Supervised Vicarious Calibration) calibration
method (Brook and Ben-Dor, 2011a) via
deshadowing algorithm using the shadow map
provided by the boresight ratio band (Brook and
Ben-Dor, 2011b). Operation of the full procedural
sequence extracts recalibration factors from the
master SVC site image and then later applied to the
study areas (imagery acquired during the same
airborne campaign). As for the HS ground camera
the nets were stretched on transportable
Figure 1: Flow chart scheme of the classification approach
for the hyperspectral airborne and ground data.
AISA-Dual Images
Initial Classification
Pure Pixels Map
Unclassified Pixels Map
Sequential Forward Selection
Spectral Unmixing
SVM Probabilistic Map
Spectral Reduction
HS ImagesInput:
Preprocessing:
Boresight shadow map
Radiometric correction, de-striping, saturation masking
Processing: Stage 1
Atmospheric correction SVC method SVC site Image AOI site Image
F1 F2
F3 F4
Stage 2
Stage 3
Nonnegative Matrix Factorization
Spectral Classification Product
Image segmentation combined with a Markov
random field model under a Bayesian framework
Stage 4
Thematic Map
ICPRAM 2012 - International Conference on Pattern Recognition Applications and Methods
396

whitewashed wood board, which has been scanned
simultaneously with the study area (building facade).
The proposed classification method (Brook et al.,
2011) is in four steps (Figure 1): SVM's (Support
Vector Machine) probabilistic map; data reduction;
unmixing; classification.
In a first step a general (coarse) classification is
performed. Each “pure” pixel is assigned to a class
according to a predefined threshold of a probabilistic
output of a support vector machine (SVM)
algorithm, or is labeled as unclassified (Villa et al.,
2011). The unclassified pixels might be associated
with mixed spectra pixels, thus their classification is
addressed to unmixing methods in order to obtain
the abundance fraction of each endmember class.
Prior to this step, a second step is applied, where the
spectral data is reduced by several selected
algorithms. This step is proven to enhance overall
performance of the forthcoming spectral models.
Finally, in the fourth stage the spectral model for
quantitative mapping is applied on the unclassified
pixels of airborne hyperspectral imagery by
considering the preliminary results.
In the first stage, a simple scheme one-class
SVM “weighted centroid” (Schölkopf, 2001) was
applied. For a supervised learning system, each data
instance in the training set consists of a class and
several features. The goal of SVM is to produce a
model that can predict the target value. The
classification procedure is carried out by SVM’s
supervised learning algorithms (Vapnik, 1998).
Given a set of training vectors SVM learns a linear
decision boundary to discriminate between classes.
The results are using SVM’s probability values as a
classification procedure (Villa et al., 2011).
According to this method pixels with a probability
higher than a predefined threshold are related to a
single class. However, pixels with lower probability
are considered to represent mixed pixels, which are
temporary unclassified. We suggest using a kernel in
conjunction with an SVM, as well. The input spectra
are mapped into a high-dimensional vector space
where the coordinates are given by spectral features.
The SVM produces a linear decision boundary in
this high-dimensional feature space, and test
sequences are classified based on whether they map
to the positive or negative side of the boundary.
This approach combines SVM with spectral
Kernel supported and supervised by general prior
knowledge of the endmembers and the ground site.
The method enables direct computation of Kernel
values without calculating feature vectors, which
saves and minimizes computation time. The features
used by Kernel are assumed to be the set of all
possible pure endmembers of a fixed k-length. In the
linearly separable case, the hard margin SVM
determines the hyper-plane that separates the data
and maximizes the distance to the nearest training
points. In the real-world case, training sets are
usually not linearly separable, and we must modify
the SVM optimization process. We suppose that the
training set could be formulated as a sequential
vector space called feature space. The output of the
SVM is a set of weights that solve the dual
optimization problem. It is not a trivial task to
determine the threshold for classification decision of
pure or mixed pixels. The test set classification is
done by moving a k-length sliding window across
input vectors, searching for the current k-length in
the look-up table, and increasing the classifier
threshold by the associated coefficient.
The input variables in terms of absorption
features were reduced through a sequential forward
selection (SFS) algorithm (Whitney, 1971) in the
second stage of the suggested classification method.
This SFS starts with the inclusion of feature sets one
by one to minimize the prediction error of a linear
regression model. This stage focuses on conditional
exclusion based on feature significance (Pudil et al.,
1994). The tuning of decision thresholds is very
difficult during the processing and verification
stages. This type of uncertainty is a well-known fact
in the domain. Therefore, an additional orthogonal
forward selection algorithm incorporates the Gram–
Schmidt transform (Chen et al., 1989) is proposed.
The orthogonal Gram–Schmidt transform space
can be associated with the same number of input
variables of the measurement space (Chen et al.,
1989). The first step of this algorithm considers all
wavelengths as variables and calculates the
Mahalanobis distance. The variable that yields
maximum class separation is added to the feature
subset. The next step is to continue classifying all
remaining variables by calculating the Mahalanobis
distance and adding the maximum separated classes
to the feature subset. Thus, the algorithm reduces
redundancy. The main drawback of SFS is that
feature selection is permanent and it might lead to
redundant features. The main disadvantage of
Gram–Schmidt transform is the demand for more
computations due to the orthogonal decomposition.
Nevertheless, in the present study, the joined subset
selection algorithm reduced the original data from
198 to 7-24 significant features (wavelength).
The nonnegative matrix factorization (NMF) was
applied on the data provided by the SFS feature-
selection model as an unmixing method suggested in
the third stage (Lee and Seung, 2001). This
FUSION OF OPTICAL AND THERMAL IMAGERY AND LIDAR DATA FOR APPLICATION TO 3-D URBAN
ENVIRONMENT - Pattern Recognition Applications in Remotely Sensed Hyperspectral Image Analysis
397

algorithm search for the pure endmembers and the
unmixing by factorizing a matrix subject to positive
constraints based on gradient optimization and
Euclidean norm designation (Robila and Maciak,
2006).
In the present study, the algorithm was generated
to start with a random linear transform on the
nonnegative data. The algorithm is continuously
computing scalar factors that are chosen to produce
the “best” intermediate pure endmembers and the
unmixing. At each step of the algorithm the pure
endmembers and the unmixing remains positive. In
the proposed scheme the scalar factors were
computed by the derivative of the objective function
on the nonnegative source. The main drawbacks of
this method are computational complexity and
significant computation times; it is because each
iteration needs a new nonnegative source and a new
linear transform. Overall, to compute the new
updated nonnegative source, the algorithm requires a
number of scalar factors that are inspected for the
current iteration. The computation of linear
transform considered in the same manner. The
complexity factors are averaged by numbers of
internal iterations. Lin (Lin, 2007) suggests
computing scalar factors independent of each other
at each iteration, which should be based on the
values obtained in the previous iteration. Rabila and
Lukasz (Rabila and Maciak, 2009) show that the
initial choices of factors (0.0001, 0.001, 0.01, 0.1, 1)
and average number of iterations does not have a
significant impact on the running times and does not
affect the convergence.
The final stage is a method for image
segmentation/classification combined with a Markov
random field (MRF) model under Bayesian
framework. The most common way of incorporating
spatial correlations into a classification process is to
use MRF (Yang & Jiang, 2003) as a priori models.
The MRF is a conditional probability model, where
the probability of a voxel depends on its
neighbourhood. Generally, MRF is a stochastic
process that specifies the local characteristics of an
image and is combined with the given data to
reconstruct the true image. Moreover, MRF is
usually used to obtain the prior distribution for the
Bayesian estimation and formulate the labelling
problem. The prior contextual information of MRF
is a powerful method for classifying spatial
continuity as well as specific patterns and features
providing useful and unique information for the final
thematic map.
The here presented MRF is based on 8-
neighbourhood isotropic model, which does not
favour a particular orientation with equal potential
function for cliques 1-4 and 5-8. The final solution is
obtained by minimizing an energy function, where
deterministic relaxation (Chou and Brown, 1990) is
used.
The potential function for a clique is the
weighted sum of the candidate functions: Gaussian
model and Huber model (Bouman and Sauer, 1993).
This function stabilizes the solution of the problem
by suggesting an efficient optimization method. The
functions are compared by training the parameters of
each model separately on the data.
Since different simultaneously propagating
regions are considered, an extension of the level-set
global to local approach is suggested, while allowing
the propagation speed to depend on the respective
region label. Thus, the performance strongly
depends on the description of the label content. For
that purpose, a statistical approach, where the
number of labels is assumed to be known, is
adopted. Pattern analysis techniques for the
identification of the corresponding models are
further used.
The global map of labels is obtained using
statistical tests. These tests classify points with high
confidence. The probability of classification error is
set to a small value. At first, all pixels are classified
according to their distance from the different labels.
The distribution of the data in a window centered at
each site is approximated. Then the Euclidian
distances from this distribution to the features of
each label are computed and assigned to the local
region.
The validation of the thematic maps is performed
by comparing ground truth and image reflectance
data of the selected targets. The ten well-known
targets (areas of approximately 30-40 pixels) were
spectrally measured (using ASD SpecPro) and
documented. The overall accuracy for the Ma'alot
Tarshiha images (Figure 2) is 96.8 and for the
Qalansawe images (Figure 3) is 97.4.
The suggested pattern analysis is based on the
Graph-theoretic algorithm, which integrates the
thematic information to the reconstructed patterns of
buildings and roads. At first, the constrained
Delaunay triangulation (CDT) is performed. The
CDT is refined by two objects, which are connected
by edges of the triangles; the proximity relationship
between buildings and between buildings and roads
are explicitly modelled by this structure. Based on
the proximity relationship between buildings, an
initial graph is generated from which the pattern
recognition based on Minimum Spanning Tree
(MST) is automatically derived (Steele, 2002). Here
ICPRAM 2012 - International Conference on Pattern Recognition Applications and Methods
398
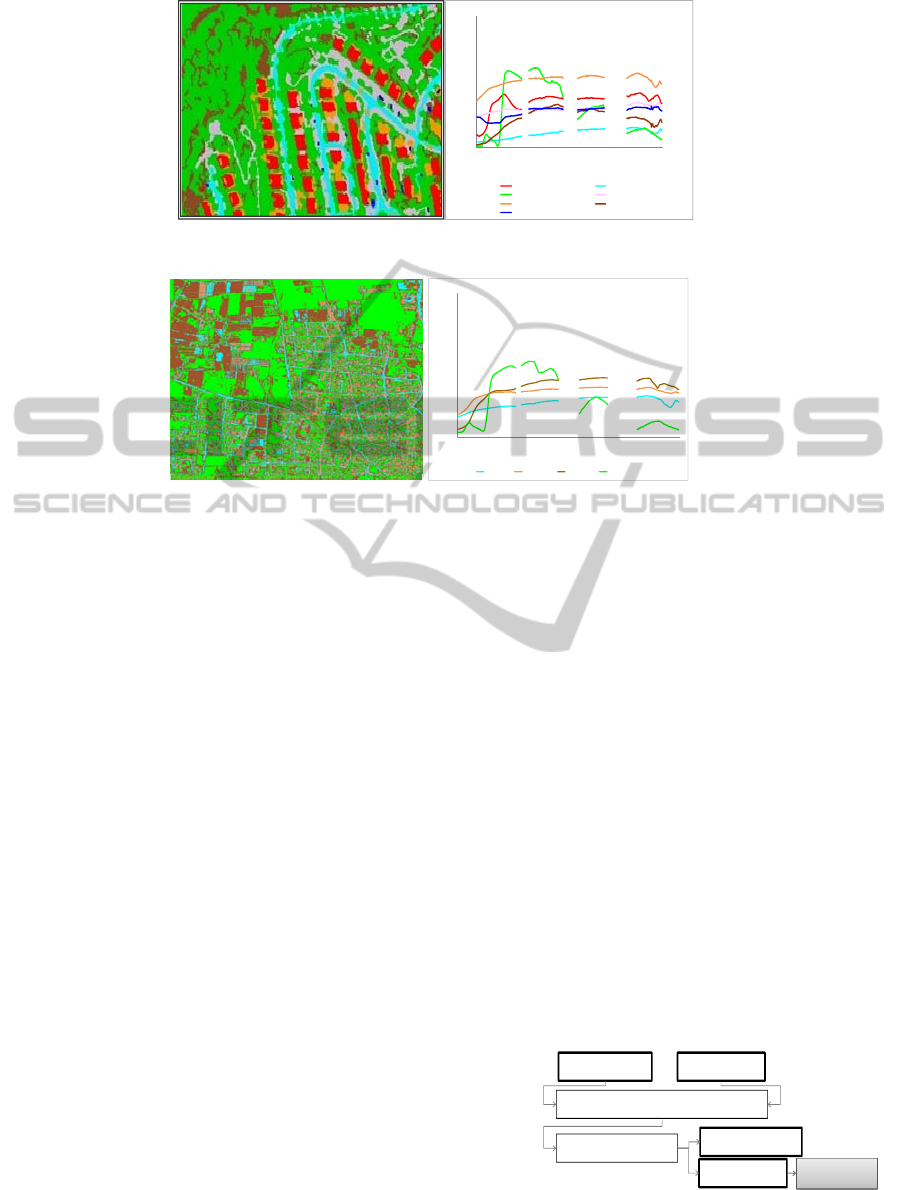
Figure 2: (a) Thematic map (b) Spectral library of Ma’alot Tarshiha endmembers.
Figure 3: (a) Thematic map (b) Spectral library of Qalansawe endmembers.
all the edges are actually weighted based on the
proximity between building outlines. This means
that the weights stored in the edges are calculated by
the nearest distances between building outlines.
Next, the wall statistical weighting method
(Duchesne and Bernatchez, 2002) to compute
building orientation is implemented. Second, the
normal direction of a portion of a road is computed
based on the average of all the segments weighted
by lengths. The last calculation is for the shape
index (Duchesne and Bernatchez, 2002).
In the Graph-theoretic algorithm, a spanning tree
of an undirected graph is a tree that contains all
vertices. The weight of a tree is defined as the sum
of the weights of all its constituent shapes (building
features). A MST tree is then a spanning tree whose
weight is the minimum among all spanning trees.
Since a graph may not be connected it has a union of
minimum spanning trees for its connected
components. In this work, Prim’s algorithm is
implemented to derive MST from initial graph.
The basic idea of the detection is align-along-
road patterns that are traced on a path from the
pruned MST and the buildings, yet the path should
be close enough to a nearby road. Aligned road is
firstly checked using the information stored as a
result of constructing refined CDT. If buildings are
connected by the same road, then the tracing
proceeds. The characterization of align-along-road
building patterns is executed by applying MST to
spectral class, spacing, size, shape, and distance to
the aligned road.
2.3.2 Thermal Imagery
Atmospheric correction is a key processing step for
extracting information from thermal infrared
imagery. The ground-leaving radiance combined
with the temperature emissivity separation (TES)
algorithm are generated and supplied to in-scene
atmospheric compensation ISAC (Young et al.,
2002). The temperature of three prior selected
ground truth targets (water, sand and soil) was
continuously measured by installed thermocouples.
The generated atmospheric data cube is used as an
input to a temperature emissivity separation
algorithm (normalized emissivity method). The pre-
processing methodology is presented in Figure 4.
The proposed thermal classification method
follows the same four stages of data processing
(SVM's probabilistic map; data reduction; umnixing;
classification). The validation of the thematic maps
(Figure 5A and 6A) is performed by comparing
Figure 4: Flow chart scheme of the thermal data pre-
processing.
0
0.2
0.4
0.6
0.8
1
0.45 0.95 1.45 1.95
Reflectance
Wavel en gth (µm)
Ma'alot Tarshiha Endmembers
Red Tile Roof Asphalt
Vegetation Conc rete Floo ring
Whitewashed Co c nrete Roof Bare Soil
Metal
0
0.2
0.4
0.6
0.8
1
0.45 0.95 1.45 1.95
Reflectance
Wav elength (µ m)
Qalansawe Endmembers
Asphalt Concrete Bare Soil Vegetation
Airborne Thermal Ground ThermalInput Images:
Preprocessing:
Radiometric correction by system operator
Atmospheric correction
Temperature Image
Emissivity Image
Data Processing
in four stages
FUSION OF OPTICAL AND THERMAL IMAGERY AND LIDAR DATA FOR APPLICATION TO 3-D URBAN
ENVIRONMENT - Pattern Recognition Applications in Remotely Sensed Hyperspectral Image Analysis
399
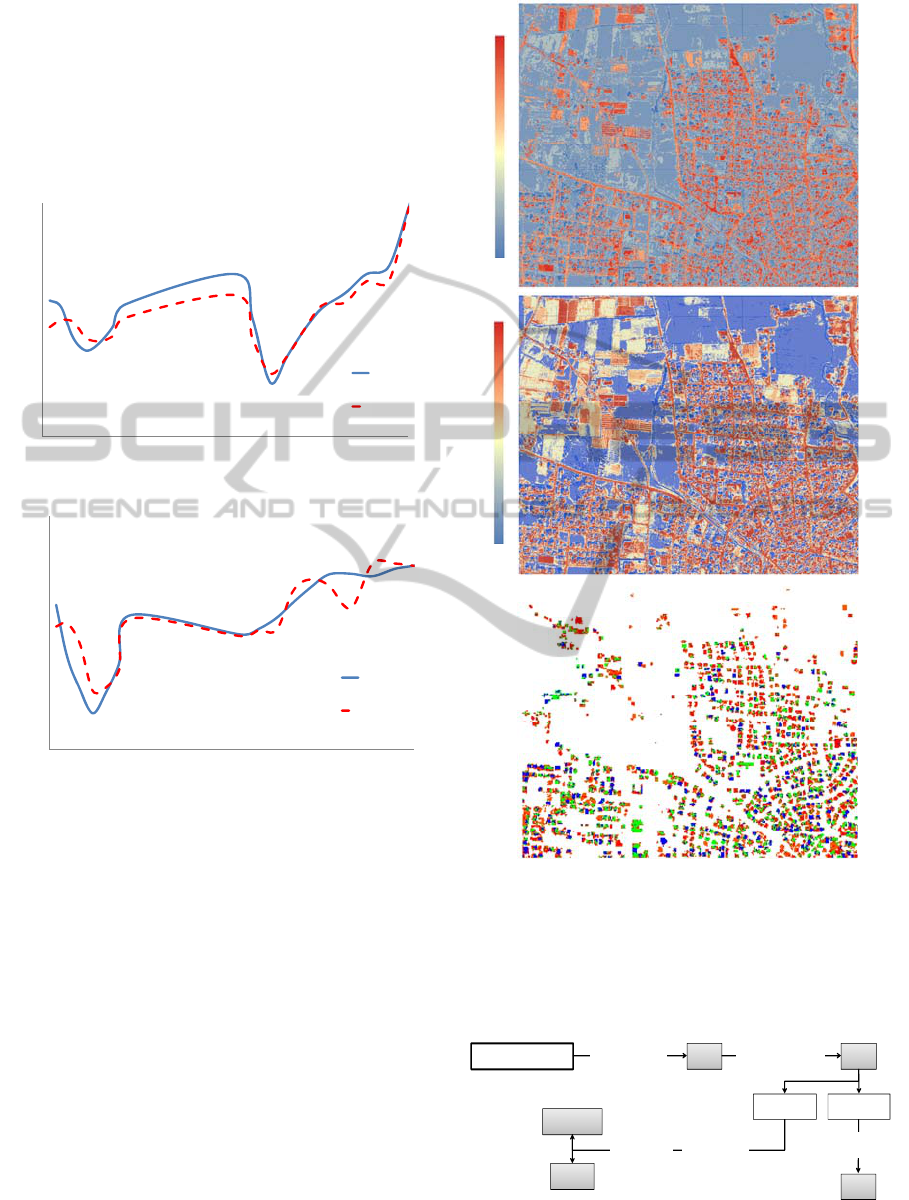
ground truth and image emissivity data. The four
targets (concrete, bare soil, bitumen and tile roof)
were measured and documented. The resulting
emissivity signatures are in good agreement with
ground-truth data (two examples in Figure 5). The
results presented here confirm the robustness and
stability of the suggested method.
Figure 5: Emissivity calculated from the thermal radiance.
A is a tile roof signature in Ma'alot Tarshicha campaign
and B is a bitumen (asphalt road) in Qalansawe campaign.
Figure 6 shows three images for Qalansawe
campaign: a. is the airborne radiance image (3.8µm),
b. is the emissivity image and c. is the thematic map
of concrete.
2.3.3 LiDAR Data
LiDAR data provide precise information about the
geometrical properties of the surfaces and can reflect
the different shapes and formations in the complex
urban environment. The point cloud (irregularly
spaced points) was interpolated into the digital
surface model (DSM) by applying the Kriging
technique (Sacks et al., 1989).
The surface analysis (Figure 7) is first
represented as a DEM (digital elevation model) of
Figure 6: Qalansawe campaign: A. is the airborne radiance
image, B. is the emissivity image and C. is the thematic
map of concrete (4 detected classes).
the scanned scene, where data are separated into on-
terrain and off-terrain points (Masaharu and
Ohtsubo, 2002).
Figure 7: Flow chart scheme of the LiDAR data
processing.
0.9
0.92
0.94
0.96
0.98
1
35791113
Emissivity
Wavelength (µm)
Tile Roof
הרדיס1
הרדיס2
Image
Ground
Truth
0.84
0.86
0.88
0.9
0.92
0.94
0.96
0.98
1
3579111
3
Emissivity
Wavelen
g
th
(µ
m
)
Bitumen
הרדיס
1
הרדיס
2
Image
Ground
Truth
A
B
Low
High
Low
High
A
B
C
LiDAR point cloud DSM DEM
on-terrainoff-terrain
DTM
Buildings
Roads
interpolation spatial analysis
filters
feature
extraction
geometric
algorithms
ICPRAM 2012 - International Conference on Pattern Recognition Applications and Methods
400
The DTM (digital terrain model) was created by
a morphological scale-opening filter; using square
structural elements (Rottensteiner et al., 2003) for
the on-terrain data. At this stage the roads and
buildings were extracted from the off-terrain data
(Brook et al., 2011).
In relatively flat urban areas, the roads, which
have the same elevation (height) as a bare surface,
can be extracted by arrangement examination. The
simple geometric and topological relations between
streets might be used to improve the consistency of
road extraction. First, the DEM data are used to
obtain candidate roads, sidewalks and parking lots.
Then the road model is established, based on the
continuous network of points which are used to
extract information such as centerline, edge and
width of the road.
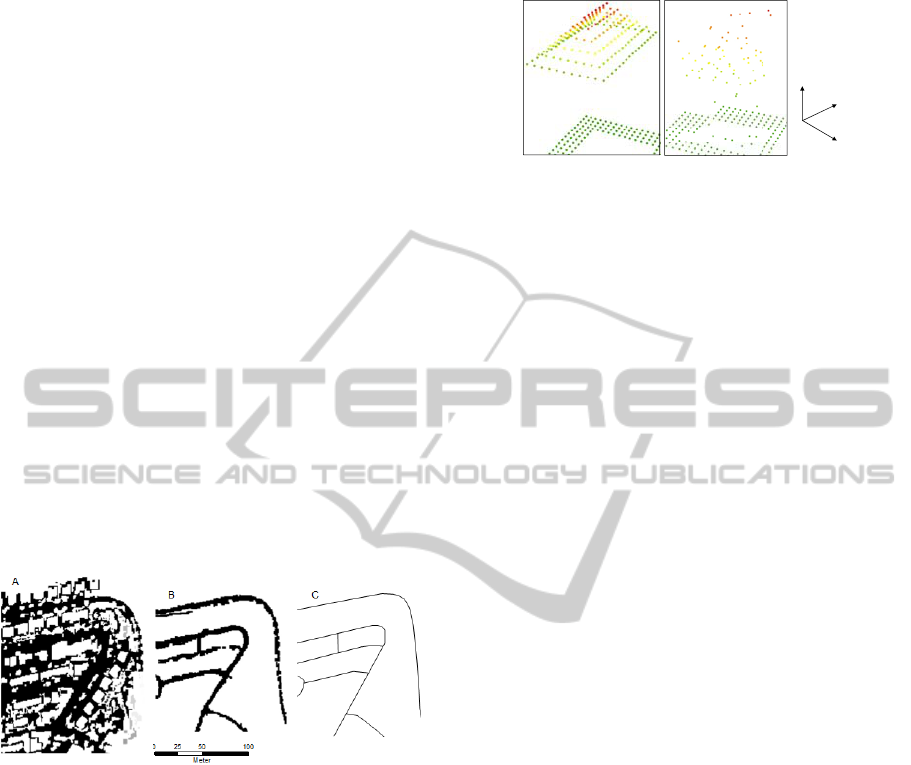
The accuracy and correctness of the road
extraction can be evaluated by the completeness of
the detected road network (Cloude et al., 2004). The
comparison between ground truth and detected road
network models is categorized as follows: true
positive (TP), false negative (FN) and false positive
(FP). The accuracy of the extracted road network in
Ma’alot Tarshiha (Figure 8) is 96.2, when TP is 100
(320 m), FN is 0(0 m), and FP is 4 (12.8 m).
Figure 8: The extracted road network in Ma’alot Tarshiha:
A is the LiDAR segmentation, B is the LiDAR
classification, C is the ground truth map.
The building boundary is determined by a
modified convex hull algorithm (Jarvis, 1973) which
classifies the cluster data into boundary
(contour/edge) and non-boundary (inter-shape)
points (Jarvis, 1977). This algorithm can quickly
provide a rough idea of the shape or extent of a point
data set with relatively low computing cost (Wang
and Shan, 2009). Separating points located on
buildings from those on trees and bushes, is a
difficult task (Wang and Shan, 2009). The common
assumption is that the building outlines are separated
from the trees in terms of size and shape. Since laser
beams penetrate the canopy, the data include mixed
information of the surface and under the trees. The
dimensionality learning method, proposed by Wang
and Shan (2009), is estimated by measuring the
slope of the extracted planar surfaces (Figure 9).
Figure 9: The DEM examples: A is a building, B is a tree.
The extracted features are simplified and formed
as a basic framework of the polygon. Yet, the
determined framework is not regular. For that
purpose, the regularization clustering and adjustment
algorithm is executed. This algorithm produces
optimized outlines of convex polygons. At the end
of this procedure two datasets are extracted and
stored: the original feature shapes and the simplified
and regulated feature shapes.
2.3.4 Data Registration - Automatic
Approach
A fully controlled, near-real-time, natural and
realistic monitoring system for an urban
environment is the main objective of this research.
The suggested registration algorithm to achieve this,
is an adapted version of the AIRTop (Figure 10)
algorithm (Brook and Ben-Dor, 2011c).
First, the significant regulated features are
extracted from all input data sets and converted to a
vector format. Since the studied scene has a large
area, regions of interest (ROI) with relatively large
variations are selected. The idea of addressing the
registration problem by applying a global-to-local
level strategy (the whole image is now divided into
regions of interest which are treated as an image)
proves to be an elegant way of speeding up the
whole process, while enhancing the accuracy of the
registration procedure (Chantous et al., 2009). Thus,
we expect this method to greatly reduce false alarms
in the subsequent feature extraction and CP
identification steps (Brook et al., 2011). To select
the distinct areas in the vector data sets, a map of
extracted features is divided into adjacent small
blocks (10% × 10% of original image pixels with no
overlap between blocks). Then, the significant CPs
extraction has been performed by applying the
SURF algorithm (Brown & Lowe, 2002).
First the fast-Hessian corners Detector
(Lindeberg, 2004), which is based on an integral
image, was performed. The Hessian matrix is
responsible for primary image rotation using
principal points, whichare identified as
Z
X
Y
A
B
FUSION OF OPTICAL AND THERMAL IMAGERY AND LIDAR DATA FOR APPLICATION TO 3-D URBAN
ENVIRONMENT - Pattern Recognition Applications in Remotely Sensed Hyperspectral Image Analysis
401
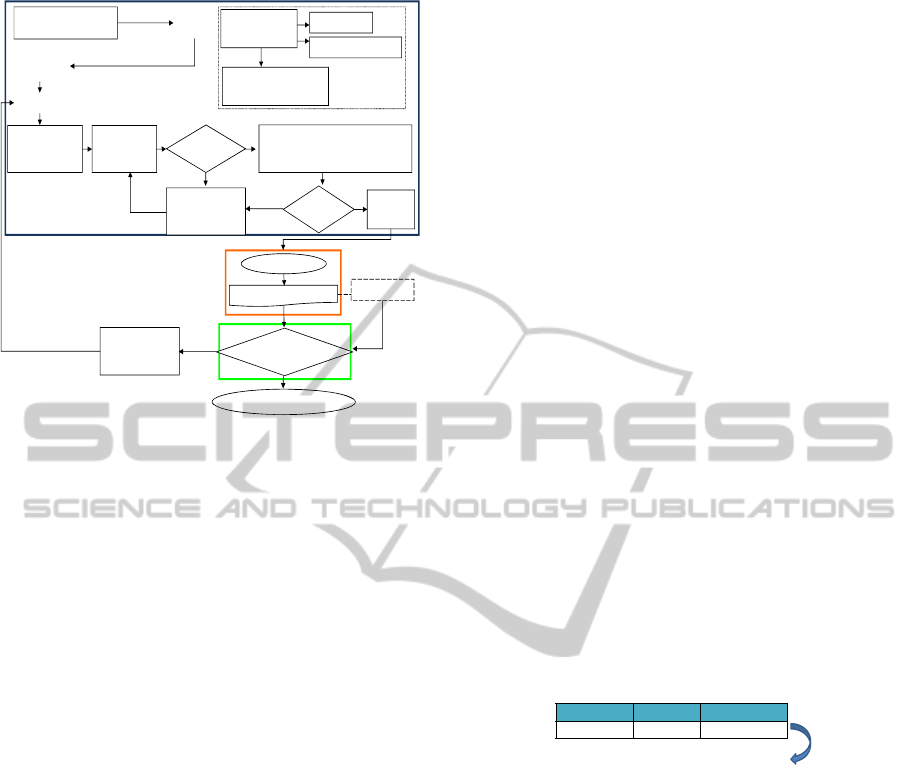
Figure 10: Flow chart of the AIRTop registration
algorithm.
"interesting" potential CPs in the block. The local
feature representing vector is made by a combination
of Haar wavelet coefficients. The values of
dominant directions are defined in relation to the
principal point. As the number of interesting points
tracked within the block is more than the predefined
threshold, the block is selected and considered a
suitable candidate for CPs detection.
The significant features are extracted from all
input data sets. The spatial distribution and
relationship of these features are expressed by
topology rules (one-to-one) and they are converted
to potential CPs by determining a transformation
model between sensed and reference data sets. The
defined rules for a weight-based topological map-
matching (tMM) algorithm manage (Velaga et al.,
2009), transform and resample features of the sensed
georeferenced LiDAR data according to a non-
georeferenced imagery in order to reserve original
raw geometry, dimensionality and imagery matrices
(imagery pixels size and location).
3 URBAN ENVIRONMENT
MODEL
The data fusion application must provide fully
integrated information, both of the classification
products and the context within the scene. In the
proposed model, a complete classification and
identification task consists of subtasks, which have
to operate on material and object characteristic shape
levels provided by an accurately registered database.
Moreover, the final fused and integrated application
should be operated on objects of different sizes and
scales, such as a single building detected within an
urban area or a selected region on a building facade.
The multi-scale and multi-sensor data fusion is
possible with the eCognition procedure (user guide
eCognition, 2003), when the substructures are
archived by a hierarchical network. Thus, each
object is not only identified by its spectral, thermal,
textural, morphological, topological and shape
properties, but also by its unique information linkage
with its actual neighbours (Graph-theoretic
algorithm and topology).
The data are fused by mutual dependencies
within and between objects that create a semantic
network of the scene. To assure high level accuracy
and operational efficiency the input products are
inspected by the basic topological rule, which
obligates that object borders overlay borders of
objects on the next layer. Therefore, the multi-scale
information, which is represented concurrently, can
be related to each other.
One of the most important aspects of
understanding fused data is information about
context, which describes the relationships between
multi-source layers. In human perception, processing
of context information is consciously or sub-
consciously executed. The conceptual information is
integrated into the suggested expert system.
Figure 11: Hierarchical rule-based structure in eCognition.
The expert system is applied on the semantic
network of fuzzy logic (Benz et al., 2004) to
quantify uncertainties and variations of the input
data. This logic establishes the membership function
that defines the relationship between object and its
characteristics (Figure11).
In order to receive meaningful information, the
semantic context has to be determined. For example,
the classification task to identify a roof can be
Fast-Harris
Corner detection
Integral Image
Hassian Approximation
Haar Wavelet Response
Region orientation
SURF
Algorithm
Collect CPs
Initialization:
-Insert features
-Topology building
Matching:
-Linear network
-Transfer match
Unpacking (Topology match checking):
-Feature composition relationship
-Matching pairs
Loop:
Calculation of each
element in pairs
Weigh ts
Hierarchy
RMS
Threshold
Yes
No
Yes
No
Determine
CP Pair
Test Point Error
(TPE) Threshold
Complete Algorithm
Execute Map-Matching
Trans form
Loop:
Calculation of
lower weight pair
Yes
No
Preliminary
Detection
Automatic Registration -
Control Point Detection
Primary
Detection
Weight-based Topological Map-matching
ObjectLevelOperation
RoofLevel 1Segmentation
Hierarchical rule-base structure in eCognition:
Roof
• Shape 3-D
• Shape
• Proportions
• Volume 3-D
• Area 2-D
• Diameter 2-D
• Delta H (ground surface - top)
• Material
• VNIR-SWIR thematic class
• Tile
• Bitumen
• Concrete
• Thermal micro – silicates class
• Tile
• Bitumen
• Concrete
ICPRAM 2012 - International Conference on Pattern Recognition Applications and Methods
402

solved by the following approach: A roof is always a
shaped polygon, above the ground level, and with
certain properties (volume, area and diameter). The
different materials and scales distinguish cadastral
categories of a building.
4 3-D URBAN APPLICATION
The interface of the 3-D urban application is based
on a realistic illustration that can be regularly
updated with attribute details and sensor-based
information. The spatial data model is a hierarchical
structure, consisting of elements, which make up
geometries, which in turn compose layers. A
fundamental demand in non-traditional, multi-
sensors and multi-type applications is spatial
indexing. A spatial index, which is a logical index,
provides a mechanism to limit searches based on
spatial criteria (R-tree index).
CityGML is an application based on OGC’s
(open geospatial consortium) GML 3.1. This
application not only represents the graphical
appearance but in particular, it takes care of the
semantic properties (Kolbe et al., 2005), such as the
spectral/thematic properties, and model evaluations.
The 3-D urban application is based on an
integrated data set: spectral models, ground camera
and airborne images, and LiDAR data. This
application offers an advanced methodology by
integrating information into a 5-D data set. The
ability to include an accurate and realistic 3-D
position, quantitative information, thermal properties
and temporal changes is provided by a near-real-
time monitoring system for photogrammetric and
urban planning purposes.
The system requirements are defined to include
geo-spatial planning information and one-to-one
topology. As the requirements consist of
visualization and interactivity with maps and 3-D
scenes, the interface includes 3-D interaction, 2-D
vertical and horizontal interactions and browsers that
contain spectral-temporal information.
The application provides services such as
thematic mapping, and a complete quantitative
review of the building and it's surrounding with
respect to temporal monitoring. The design of the
application shows the possibilities of delivering
integrated information and thus holistic views of
complete urban environments in freeze-frame view
of the spatio-temporal domain.
The self-sufficient levels contribute information
to this integrated application. The first level mainly
supplies integrated airborne data, termed “City 3-D”.
This level introduces the ability for 3-D and 2-D
thematic mapping and spatial quantitative analysis
of urban surface materials. Users are able to analyze
temporal changes in the selected freeze-frame views,
which are equivalent to number of airborne
campaigns and number of available images uploaded
to the database. To reach the next level, the user
must zoom in and focus on the building level.
The second level adjusts on a single building and
is termed “Building Model”. This level contributes
integrated ground and airborne data. The selected
building is isolated from the global building model
replicated by LiDAR and displayed in relative 3-D
scale (matching this particular building). The level
provides two main products: thematic maps and
quantitative evaluation implemented by spectral
models. Both of these products are 3-D freeze-frame
views, which supply an extensive database for
temporal analysis.
The most specific and localized level is the third
level termed “Spectral Model”. To reach this level,
the user is required to select the area of interest
which is a particular position (a patch) such as an
area on a wall. The spatial investigation at this level
is a continuation of the previous level; however, the
data source is a set of spectral models that are
evaluated for spectral in-situ measurements. This
level does not provide any integrated information,
but georeferences the results of spectral models on a
realistic 3-D scale.
5 DISCUSSION
The 3-D urban application satisfies a fundamental
demand for non-traditional, multi-sensor and multi-
type data. The frequent updating and extension
requirement is replaced by integrating the variation
in data formats and types for developing an urban
environment. The main benefit of 3-D modeling and
simulation over traditional 2-D mapping and
analysis is a realistic illustration that can be
regularly updated with attribute details and sensor-
based quantitative information and models.
The proposed application offers a novel
advanced methodology by integrating both imagery
and LiDAR information into a 5-D data set. The
ability to include an accurate and realistic 3-D
position, quantitative spectral information and
temporal changes provides a near-real-time
monitoring system for photogrammetric and urban
planning purposes.
The proposed algorithm for data fusion proved to
be able to integrate several different types of multi-
sensor data, which are additionally dissimilar in
FUSION OF OPTICAL AND THERMAL IMAGERY AND LIDAR DATA FOR APPLICATION TO 3-D URBAN
ENVIRONMENT - Pattern Recognition Applications in Remotely Sensed Hyperspectral Image Analysis
403

rotation, translation, and possible scaling.
The multi-dimensionality (5-D) of the developed
urban environment application provides services
such as thematic mapping, and a complete
quantitative review of the building and its
surroundings. These services are completed by
providing the ability for accurate temporal
monitoring and dynamic changes (changed
detection) observations.
6 CONCLUSIONS
In conclusion, the suggested application may
provide the urban planners, civil engineers and
decision makers with tools to consider quantitative
spectral information and temporal investigation in
the 3-D urban space. It is seamlessly integrating the
multi-sensor, multi-dimensional, multi-scaling and
multi-temporal data into a 5-D operated system. The
application provides a general overview of thematic
maps, and the complete quantitative assessment for
any building and its surroundings in the 3-D natural
environment, as well as, the holistic view of the
urban environment.
REFERENCES
Ameri, B., 2000. Automatic recognition and 3-D
reconstruction of buildings from digital imagery.
Thesis (PhD), University of Stuttgart.
Benz, U. C., Hofmann, P., Willhauck, G., Lingenfelder, I.,
Heynen, M., 2004. Multi-resolution, object-oriented
fuzzy analysis of remote sensing data for GIS-ready
information. ISPRS Journal of Photogrammetry &
Remote Sensing, 58, 239– 258
Bouman, C. and Sauer K., 1993. A generalized Gaussian
image model for edge-preserving map estimation.
IEEE Trans. Image Processing, 2(3), 296-310.
Brown, H., and Lowe, D., 2002. Invariant features from
interest point groups, in BMVC.
Brook, A. and Ben-Dor, E., 2011
a
. Advantages of
boresight effect in the hyperspectral data analysis.
Remote Sensing, 3 (3), 484-502.
Brook, A. and Ben-Dor, E., 2011
b
. Supervised vicarious
calibration of hyperspectral remote sensing data.
Remote Sensing of Environment, 115, 1543-1555.
Brook, A. and Ben-Dor, E., 2011
c
. Automatic registration
of airborne and space-borne images by topology map-
matching with SURF. Remote Sensing, 3, 65-82.
Brook, A., Ben-Dor, E., Richter, R., 2011. Modeling and
monitoring urban built environment via multi-source
integrated and fused remote sensing data. Internatio-
nal Journal of Image and Data Fusion, in press, 1-31.
Carlson, T. N., Dodd, J. K., Benjamin, S. G., and Cooper,
J. N., 1981. Satellite estimation of the surface energy
balance, moisture availability and thermal inertia.
Journal of Applied Meteorology, 20, 67–87.
Chantous, M., Ghosh, S., and Bayoumi, M. A., 2009.
Multi-modal automatic image registration technique
based on complex wavelets. In: Proceedings of the
16th IEEE International Conference on Image Pro-
cessing, Cairo, Egypt, 173-176.
Chen, S., and Billings, S. A., 1989. Recursive prediction
error estimator for nonlinear models. International
Journal of Control, 49, 569-594.
Chou, P., and Brown, C., 1990. The theory and practice of
Bayesian image labeling, Internat. J. Comput., 4, 185–
210.
Cloude, S. P., Kootsookos, P. J., and Rottensteiner, F.,
2004. The automatic extraction of roads from LIDAR
data. In: ISPRS 2004, Istanbul, Turkey.
Conel, J. E., 1969. Infrared Emissivities of Silicates:
Experimental Results and a Cloudy Atmosphere Mo-
del of Spectral Emission from Condensed Particulate
Mediums. Journal of Geophysical Research, 74 (6),
1614-1634.
Donnay, J. P., Barnsley, M. J., and Longley, P. A., 2001.
Remote sensing and urban analysis. In: J. P. Donnay,
M. J. Barnsley and P. A. Longley, eds. Remote
sensing and urban analysis. London and New York:
Taylor and Francis, 3-18.
Duchesne, P., and Bernatchez, L., 2002. AFLPOP: a
computer program for simulated and real population
allocation, based on AFLP data, Mol Ecol Notes, 2,
380–383.
Herold, M., Goldstein, N. C., and Clarke, K. C., 2003. The
spatiotemporal form of urban growth: measurement,
analysis and modeling. Remote Sensing of Envi-
ronment, 86, 286-302.
Herold, M., Couclelis, H., and Clarke, K. C., 2005. The
role of spatial metrics in the analysis and modeling of
land use change. Computers, Environment and Urban
Systems, 29(4), 369-399.
Hunt, G. R. and Vincent, R. K., 1968. The Behaviour of
Spectral Features in the Infrared Emission from
Particulate Surfaces of Various Grain Sizes. Journal of
Geophysical Research, 73(18), 6039-6046.
Jarvis, R. A., 1973. On the identification of the convex
hull of a finite set of points in the plane. Information
Processing Letters, 2, 18-21.
Jarvis, R.
A., 1977. Computing the shape hull of points in
the plane. In: Proceedings of the IEEE Computer
Society Conference Pattern
Recognition and
Image
Processing, 231-241.
Jensen, J. R. and Cowen, D. C., 1999. Remote sensing of
urban/suburban infrastructure and socio-economic
attributes. Photogrammetric Engineering and Remote
Sensing, 65, 611-622.
Juan, G., Martinez, M. and Velasco, R., 2007.
Hyperspectral remote sensing application for semi-
urban areas monitorring. Urban Remote Sensing Joint
Event, 11 (13), 1-5.
Kidder, S. Q. and Wu, H-T., 1987. A multispectral study
of the St. Louis area under snow-covered conditions
using NOAA-7 AVHRR data. Remote Sensing of
ICPRAM 2012 - International Conference on Pattern Recognition Applications and Methods
404

Environment, 22, 159–172.
Kolbe, T. H., Gerhard, G. and Plümer, L., 2005.
CityGML—Interoperable access to 3D city models.
In: International Symposium on Geoinformation for
Disaster Management GI4DM 2005, Delft,
Netherlands, Lecture Notes in Computer Science,
March, 2005.
Lee, D. D., and Seung. H. S., 2001. Algorithms for
nonnegative matrix factorization. In T. G. Dietterich
and V. Tresp, editors, Advances in Neural Information
Processing Systems, volume 13. Proceedings of the
2000 Conference: 556562, The MIT Press.
Lin, C. J., 2007. Projected gradient methods for non-
negative matrix factorization. Neural Computation,
19, 2756-2779.
Lindeberg, T., 2004. Feature detection with automatic
scale selection. International Journal of Computer
Vision, 30, 79-116.
Masaharu, H. and Ohtsubo, K., 2002. A filtering method
of airborne laser scanner data for complex terrain. The
International Archives of Photogrammetry, Remote
Sensing, and Spatial Information Sciences, 15 (3B),
165-169.
Nichol, J. E., 1994. A GIS-based approach to
microclimate monitoring in Singapore’s high-rise
housing estates. Photogrammetric Engineering and
Remote Sensing, 60, 1225–1232.
Nichol, J. E., 1996. High-resolution surface temperature
patterns related to urban morphology in a tropical city:
a satellite-based study. Journal of Applied
Meteorology, 35, 135–146.
Pudil P., Novovicova J., Kittler J., 1994. Floating search
methods in feature selection. Pattern Recognition
Letters, 15, 1119-1125.
Robila, S. A., and Maciak, L. G., 2006. A parallel
unmixing algorithm for hyperspectral images.
Technical report, Center for Imaging and Optics,
Montclair State University.
Roessner, S., Segl, K., Heiden, U. and Kaufmann, H.,
2001. Automated differentiation of urban surfaces
based on airborne hyperspectral imagery. IEEE
Transactions on Geoscience and Remote Sensing, 39
(7), 1525-1532.
Roth, M., Oke, T. R., and Emery, W. J., 1989. Satellite-
derived urban heat islands from three coastal cities and
the utilization of such data in urban climatology. Inter-
national Journal of Remote Sensing, 10, 1699–1720.
Rottensteiner, F., Trinder, J., Clode, S., Kubic, K., 2003.
Building detection using LIDAR data and
multispectral images. In: Proceedings of DICTA,
Sydney, Australia, 673-682.
Rubila S. A., and Maciak L. G., 2009. Considerations on
Parallelizing Nonnegative Matrix Factorization for
Hyperspectral Data Unmiging. Geoscience and
Remote Sensing Letters, IEEE, 6(1), 57-61.
Sacks, J., Welch, W. J., Mitchell, T. J., and Wynn, H. P.,
1989. Design and analysis of computer experiments.
Statistical Science, 4(4), 409–435.
Salisbury, J. W., Hapke B., and Eastes, J. W., 1987.
Usefulness of Weak Bands in Midinfrared Remote
Sensing of Particulate Planetary Surfaces. Journal of
Geophysical Research, 92, pp. 702-710.
Segl, K., Roessner, S., Heiden, U., Kaufman. H., 2003.
Fusion of spectral and shape features for identification
of urban surface cover types using reflective and
thermal hyperspectral data. ISPRS Journal of
Photogrammetry and Remote Sensing, 58, 99-112.
Scholkopf, B., Platt, J. C., Shawe-Taylor, J., Smola, A. J.,
and Williamson, R. C., 2001. Estimating the support
of a high-dimensional distribution. Technical report,
Microsoft Research, MSR-TR, 87-99.
Steele, J. M., 2002. Minimum spanning trees for graphs
with random edge lengths, Mathematics and Computer
Science, 2, 223-245.
Tao, V., 2001. Database-guided automatic inspection of
vertically structured transportation objects from mo-
bile mapping image sequences. In: ISPRS Press, 1401-
1409.UserGuide eCognition, 2003. Website: www.
Definiens_imaging.com.
Vapnik, V., 1998. Statistical learning theory. New York:
Wiley.
Velaga, N. R., Quddus, M. A. and Bristow, A. L., 2009.
Developing an enhanced weight-based topological
map-matching algorithm for intelligent transport sys-
tems. Transportation Research Part C: Emerging Tech-
nologies, 17, 672-683.
Villa, A., Chanussot, J., Benediktsson, J. A., and Jutten,
C., 2011. Spectral Unmixing for the Classification of
Hyperspectral Images at a Finer Spatial Resolution.
IEEE Selected Topics in Signal Processing, 5(3), 521
– 533.
Vukovich, F. M., 1983. An analysis of the ground tem-
perature and reflectivity pattern about St. Louis,
Missouri, using HCMM satellite data. Journal of
Climate and Applied Meteorology, 22, 560–571.
Wang, J., and Shan, J., 2009. Segmentation of LiDAR
point clouds for building extraction. In: ASPRS 2009
Annual Conference, Baltimore, MD.
Whitney A. W., 1971. A direct method of nonparametric
measurement selection. IEEE Transactions on
Computers, 20, 1100-1103.
Yang, F., and Jiang, T., 2003. Pixon-based image
segmentation with Markov random fields, IEEE Trans
Image Process. 12(12):1552-9.
Young, S. J., Johnson, R. B., and Hackwell, J. A., 2002.
An in-scene method for atmospheric compensation of
thermal hyperspectral data. Journal of Geophysical
Research, 107, 20-28.
Zhou, G., 2004. Urban 3D GIS from LiDAR and digital
aerial images. Computers and Geosciences, 30,
345-
353.
FUSION OF OPTICAL AND THERMAL IMAGERY AND LIDAR DATA FOR APPLICATION TO 3-D URBAN
ENVIRONMENT - Pattern Recognition Applications in Remotely Sensed Hyperspectral Image Analysis
405
