
COMPARATIVE ANALYSIS ON METRICS AND FILTERS TO
REDUCE IMPULSIVE NOISE IN MEDICAL IMAGES USING GPU
M. Guadalupe S´anchez
1
, Vicente Vidal
2
and Jordi Bataller
2
1
Department of Systems and Computing, Instituto Tecnol´ogico de Cd. Guzm´an, Cd. Guzm´an, Jal., Mexico
2
Department of Informatics Systems and Computing, Universitat Polit´ecnica de Val`encia, Valencia, Spain
Keywords:
Arithmetic Media Filter (AMF), Euclidean Metric, Fuzzy Metric, Graphical Processing Unit (GPU), Median
Filter, Noise Removal, Peer Group.
Abstract:
In many current applications of image processing, eliminating the noise is an important task in the pre-
processing phase. In medicine, medical imaging obtained by X-ray and computed tomography, for example,
mammograms, can have different types of noise, making it difficult to visually and to detect microcalcifica-
tions. We have adapted a noise reduction method for color images that gives good results for grayscale images.
In the first step of the method, the corrupted pixels are detected using the concept of peer group with a metric
and then is corrected by some kind of filter. This paper presents an algorithm with a very good balance between
quality and computational cost to removing impulsive noise in mammography images. With regard to quality,
we compared three metrics (two Fuzzy and one Euclidean) and two filters (Arithmetic Mean and Median). To
reduce the computational cost, the method is parallelized on a Graphic Processing Unit. The quality results
show that the metrics studied yield similar results, being the Euclidean metric less expensive computationally.
On the other hand, the filter must be chosen depending on the density of noise in the input image.
1 INTRODUCTION
The removal of noise in images is a very important
task in the area of digital image processing. One pop-
ular approach is to consider the neighbors of each
pixel under evaluation to detect if this latter has a dif-
ferent significant intensity level, preparing it, in that
case, for further processing. In the field of medicine,
particularly in mammography, malfunction of mam-
mography devices, the use of a small number of pro-
jections, or the transmission of the image through a
noisy channel, can introduce noise in the images (im-
pulsive, Gaussian), causing difficulties for image in-
terpretation. Another type of noise present in medical
images with coherent illumination, such as ultrasonic
scanner, is the speckle noise. In (Nair and Reji, 2011)
and (Padma et al., 2010) are some works related to the
elimination of noise in medical images.
Many methods have been proposed to eliminate
noise in the images. In the works (Morillas et al.,
2005), (Camarena et al., 2008), (Camarena et al.,
2010) are some approaches to eliminate impulsive
noise in color images using the concept of peer group
and fuzzy metric. Total Variation model to remove
speckle noise in images is proposed in (Bioucas and
Figueiredo, 2009) and (Jin and Yang, 2010). In liter-
ature and many recent studies is used the median to
remove impulsive noise (Jin et al., 2010), (Kang and
Wang, 2009), (Zhang and Xiong, 2009), (Toh and Isa,
2010) In this paper we want to know the behavior of
mean and median using two different metrics to detect
noise Salt & Pepper.
In this paper we have adapted a method (Ca-
marena et al., 2010) –with good quality results–
of removing impulsive noise from color images, to
grayscale images. We even developed a parallel
version able to be run on the Graphic Processing
Units (GPUs), with the aim of reducing the computa-
tional cost. Our implementation is programmed using
CUDA (Compute Unified Device Architecture). Both
(Sanchez et al., 2010) and (Sanchez et al., 2011) are
some papers explaining some approaches for remov-
ing noise using parallel algorithms.
The mammograms used for our test were obtained
from the mini-Mias database (Database, 2003), later
being contaminated with impulsive noise.
The overall method for reparing the noisy mam-
mograms has two steps: first detecting the noisy pix-
els and then, filtering them. To detect corrupted
pixels, we use the concept of peer group(Smolka,
534
Guadalupe Sánchez M., Vidal V. and Bataller J..
COMPARATIVE ANALYSIS ON METRICS AND FILTERS TO REDUCE IMPULSIVE NOISE IN MEDICAL IMAGES USING GPU.
DOI: 10.5220/0003892605340539
In Proceedings of the International Conference on Bio-inspired Systems and Signal Processing (MIAD-2012), pages 534-539
ISBN: 978-989-8425-89-8
Copyright
c
2012 SCITEPRESS (Science and Technology Publications, Lda.)

2005). The peer group associated with the central
pixel x(i, j), of a window of n x n size , is the set
comprised by the central pixel itself and its neighbors
whose distance to them is small. Several metrics can
be used for distance function. The size of the peer
group of a given pixel determines its classification as
corrupted or not. This is basically a voting criteria.
Pixels considered as corrupted are corrected by re-
placing them with a new value, determined by a given
filtering method.
This paper presents an analysis of quality and
speed, comparing three different metrics (two fuzzy
(Lopez, 2010) and one Euclidean (Camarena et al.,
2010)) used for the detection step, and two filters
(mean and median (Gonzalez and Woods, 1995)) used
in the correction step. The target is to achieve the best
balance between quality and speed.
The result shows that the output images had a sim-
ilar quality with regard to the metric used, but being
the Euclidean faster than the fuzzy ones. Which re-
spect to what filter yields the best quality/speed trade-
off, we found that it fundamentally depends on the
noise level in the original image.
This paper is organized as follows: Section 2
presents the metrics and filters used in this work, Sec-
tion 3 describes the parallel algorithm to eliminate im-
pulsive noise. The results of the experimental study
are shown in Section 4. Finally Section 5 concludes
the paper.
2 METRIC AND FILTERS
As explained in the introduction, the detection of a
wrong pixel depends on the size of its peer group
(Smolka, 2005): the set of neighboring pixels near to
them. There are several metrics to compute distance
between two pixels. We considered two fuzzy metrics
(Lopez, 2010) and one Euclidean metric (Camarena
et al., 2008). It is worth to mention that the functions
computing fuzzy metrics, two pixels are near when its
value is bigger. On the contrary and as usual, the Eu-
clidean metric outputs a small value when pixels are
closer.
In particular, the M and G fuzzy metrics between
pixels x(i, j) and y(i, j) are defined as follows:
M(x(i, j), y(i, j)) =
c
∏
l=1
min{x(i, j, l), y(i, j, l)} + k
max{x(i, j, l), y(i, j, l)} + k
,
(1)
G(x(i, j), y(i, j)) =
k
k+ kx(i, j) − y(i, j)k
2
, (2)
where the value of k is greater than zero. These
equations are the pattern of fuzzy metric when con-
sidering c color channels in the pixel. For example,
c=3 is the fuzzy metric for RGB (x(i, j, R), x(i, j, G),
x(i, j, B)). If we apply these metrics to the grayscale
images, then c = 1 and equations reduces to
M(x(i, j), y(i, j)) =
min{x(i, j), y(i, j)} + k
max{x(i, j), y(i, j)} + k
. (3)
G(x(i, j), y(i, j)) =
k
k+ |x(i, j) − y(i, j)|
. (4)
On the other hand, the Euclidean metrics, respec-
tively for c color channels and for one color are
L(x(i, j), y(i, j)) = kx(i, j) − y(i, j)k
2
, (5)
L(x(i, j), y(i, j)) = |x(i, j) − y(i, j)| , (6)
Now we can write down the definition of the peer
group of a pixel x(i, j) in a window W, depending on
the metric used ( 1),( 2), ( 3),( 4), ( 6) and( 5):
P (x(i, j), d) = {y(i, j) ∈ W : M(x(i, j), y(i, j)) ≥ d}
(7)
P (x(i, j), d) = {y(i, j) ∈ W : G(x(i, j), y(i, j)) ≥ d}
(8)
P (x(i, j), d) = {y(i, j) ∈ W : L(x(i, j), y(i, j)) ≤ d}
(9)
where 0 ≤ d ≤ 1 is the distance threshold for fuzzy
and d > 0 for Euclidean.
In order to correct a pixel early marked as cor-
rupted, we considered two filters: the arithmetic mean
and the median. Trivially, they replace a wrong pixel
x(i, j) by the average or by the median of the pixels in
the window centered at x(i, j), respectively.
3 PARALLEL DENOISING
ALGORITHM
The method for removing noise is divided into two
steps: detection and filtering. Algorithm 1 shows the
detection step using peer groups as explained above.
In this algorithm, for each pixel in the image is built a
window (W) of n x n size and obtains the pixel value
(in our case we used n = 3, because it removes more
noise and better preserves the edges and fine detail
of the image). Then, it calculates the cardinality of
the peer group according to the metric used (equa-
tion 3 and 5). If the size of the peer group is less than
m+ 1 the pixel is labeled as corrupted, where m is the
COMPARATIVE ANALYSIS ON METRICS AND FILTERS TO REDUCE IMPULSIVE NOISE IN MEDICAL
IMAGES USING GPU
535

threshold defined to decide if the pixel is noisy or not.
This threshold is chosen heuristically.
In the filtering step (algorithm 2), for each pixel
labeled as corrupted, a window W is built. If all of
the pixels in W are corrupted, W is increased until a
non-corrupted pixel is found. Then, we calculate the
mean (or then median) for replacing the value of the
pixel being analyzed.
Algorithm 1: Detection.
Input: pixels of the imagen, m,k,d
Output: pixels labeled as corrupted and non
corrupted
1: for each pixel in the image do
2: builds the window W;
3: obtains the pixel value;
4: calculate the cardinality (#) of the
peer group using the metrics
5: if #P (x(i,j),d)>= (m+1) then
6: pixel is uncorrupted;
7: else
8: pixel is corrupted;
9: end
10: end
Algorithm 2: Filtering.
Input: pixels labeled as corrupted and non
corrupted
Output: Filtered Image
1: for each pixel in the image do
2: if the pixel labeled as corrupted then
3: builds the window W;
4: obtains the pixel value;
5: expand the window if all pixels are
corrupted;
6: calculate the mean and median of
the pixels;
7: replace the calculation result of
step 6 by the value of the pixel
analyzed;
8: end
9: end
Comments about Parallel
Implementations on a GPU
The above algorithms can be parallelized easily be-
cause the work to be performed on each pixel can
be done independently. The obvious caution is that
the filtering phase must wait the detection phase to
be completed, as only non-corrupted pixels are used
to replace the corrupted ones. Anyway, programming
a GPU has practical considerations that must be ad-
dressed. For example, data must be explicitly copied
from RAM to the GPU memory, and copied back
when the task has finished. There are several types
of memories in a GPU, including caches in different
levels. Even, particular memories support different
access patterns. Therefore, to obtain the best results,
a set of tests must be carried out, investigating the best
setup.
4 EXPERIMENTAL STUDY
This section presents the results of experiments con-
ducted on a Mac OS X (Intel Quad-Core Xeon 2
x 2.26 GHz, 8GB of RAM) with an NVIDIA GPU
(GeForce GT 120, 512MB of memory). For testing,
mammograms from database mini-Mias were used.
The images have been altered to add several levels
(5%, 10% and 20%) of impulsive noise using imnoise
instruction of MATLAB.
In order to measure the resulting quality of the im-
ages, we used PSNR, MAE and MSE. PSNR (Peak
Signal-to-Noise Ratio) to measure noise reduction,
MAE (Mean Absolute Error) for the preservation of
the signal. To define the PSNR we need to calcu-
late the mean square error (MSE), which for two
monochrome images u (Filtered image) and I (Ref-
erence image) of size M×N is defined as:
MSE =
1
MN
M− 1
∑
i=0
N−1
∑
j=0
kI(i, j) − u(i, j)k
2
, (10)
where MN is the image size.
Thus, the PSNR is defined as:
PSNR = 10log
10
MAX
2
I
MSE
, (11)
where MAX
I
is the maximum possible pixel value of
the image.
The mean absolute error is given by,
MAE =
1
MN
M− 1
∑
i=0
N−1
∑
j=0
|I(i, j) − u(i, j)|. (12)
We have developed three parallel implementa-
tions. The first one only performs the filtering al-
gorithm. The second implementation executes both
the detection and the filtering algorithms. For filter-
ing, only non-corrupted pixels are used to compute
the mean (or the median). The third implementation
is different from the second one in that every pixel,
including corrupted ones, is used for computing the
mean/median. The second implementation is identi-
fied by nc (non-corrupted) and the third one by a (all
pixels).
The results obtained regarding quality using met-
rics and filters to the first implementation are shown
BIOSIGNALS 2012 - International Conference on Bio-inspired Systems and Signal Processing
536

Table 1: Results of quality considering all the pixels of W only with filtering step.
5% 10% 20%
PSNR MAE MSE PSNR MAE MSE PSNR MAE MSE
Mean 26.97 6.26 130.62 23.84 10.60 268.76 20.23 18.01 617.20
Median 46.65 0.50 1.41 42.14 0.57 3.97 31.50 0.96 46.00
Table 2: Results of quality considering only non-corrupted pixels for filtering step.
Fuzzy metric (M) Fuzzy metric (G) Euclidean
PSNR MAE MSE PSNR MAE MSE PSNR MAE MSE
5% Mean
nc
47.64 0.06 1.12 47.42 0.07 1.18 47.42 0.07 1.18
Median
nc
48.33 0.05 0.96 48.11 0.06 1.00 48.06 0.06 1.02
10% Mean
nc
42.81 0.13 3.41 42.59 0.14 3.58 42.59 0.14 3.58
Median
nc
42.59 0.12 3.58 42.36 0.13 3.78 42.36 0.13 3.78
20% Mean
nc
35.52 0.46 18.24 35.48 0.48 18.43 35.48 0.48 18.43
Median
nc
34.02 0.47 25.77 34.00 0.49 25.88 34.00 0.49 25.88
Table 3: Results of quality considering all the pixels of W for the filtering step.
Fuzzy metric (M) Fuzzy metric (G) Euclidean
PSNR MAE MSE PSNR MAE MSE PSNR MAE MSE
5% Mean
a
35.09 0.82 20.15 35.09 0.83 20.16 35.08 0.83 20.97
Median
a
50.91 0.05 0.53 50.48 0.06 0.58 50.56 0.06 0.57
10% Mean
a
30.67 1.84 55.77 30.69 1.83 55.44 30.69 1.83 55.44
Median
a
43.33 0.12 3.02 43.18 0.13 3.13 43.18 0.13 3.13
20% Mean
a
24.29 5.80 241.90 24.38 5.72 237.37 24.38 5.72 237.37
Median
a
31.98 0.52 41.20 31.93 0.54 41.74 31.93 0.54 41.74
in the table 1. This table shows that we have got better
quality using the median instead of the mean for any
percent of the noise.
The resulting quality of the second implementa-
tion, is shown in table 2. In this table the mean filter
is better than median for any metric used, except for
5% of noise which median is better than mean. The
results of quality for the metrics are similar, although
slightly better for the fuzzy (M).
Table 3 shows the results of the last implementa-
tion. In this table, the median is better than mean and
the three metrics in comparison have similar results.
Comparing tables 2 and 3 for 5% and 10% of
noise, we can see that the best results are obtained
when using the median and using all the pixels of
the window for the filtering step (third implementa-
tion). For higher noise percentages, the mean is op-
timal, considering only non-corrupted pixels for the
filtering step (second implementation). With the three
metrics used we obtained similar results, although a
little better for the fuzzy (M).
Analyzing the results of the tables 1, 2 and 3, we
can see that using the detection step and then filtering
step is the best option (the second and third imple-
mentations are better than the first implementation).
Some resulting images are shown in figure 1 for 20%
of noise.
In order to determine the computational cost of
each step, we compared, measured in Mpix/sec, the
cases of 10% and 20% of noise. Table 4 shows the
results. In this table we can see that the computational
cost is more expensive when fuzzy metrics are used,
compared to Euclidean metrics. Also, we observe that
the filtering step is more computationally expensive
than the detection step. On the other hand, comput-
ing the mean is faster than the median (as this lat-
ter involves sorting the pixels. Consequently, if only
non-corrupted pixels are used, the median is obtained
quickly).
The G fuzzy metric is faster than the M metric.
This is consequent with the fact that G computes only
and absolute value, see equation 3, while M com-
putes a maximum (consequently is obtained maxi-
mum value). But the fastest metric is the Euclidean.
Compared to the G metric, the Euclidean has one ad-
dition and one division less to compute.
If quality and speed are considered in combina-
tion, always a program with the two steps, detection
and filtering, must be used. Also, always the Eu-
clidean metric should be used for the detection. For
a noise level lesser than 10 percent, the best choice
is to employ the median of all the pixels (including
corrupted ones) in the filtering step. When the noise
is greater than 10 percent, using the mean of non-
corrupted pixels in the filtering step, is the more ad-
visable choice.
Figure 2 shows the results of running the sequen-
tial and parallel version. As we can see, using the
COMPARATIVE ANALYSIS ON METRICS AND FILTERS TO REDUCE IMPULSIVE NOISE IN MEDICAL
IMAGES USING GPU
537
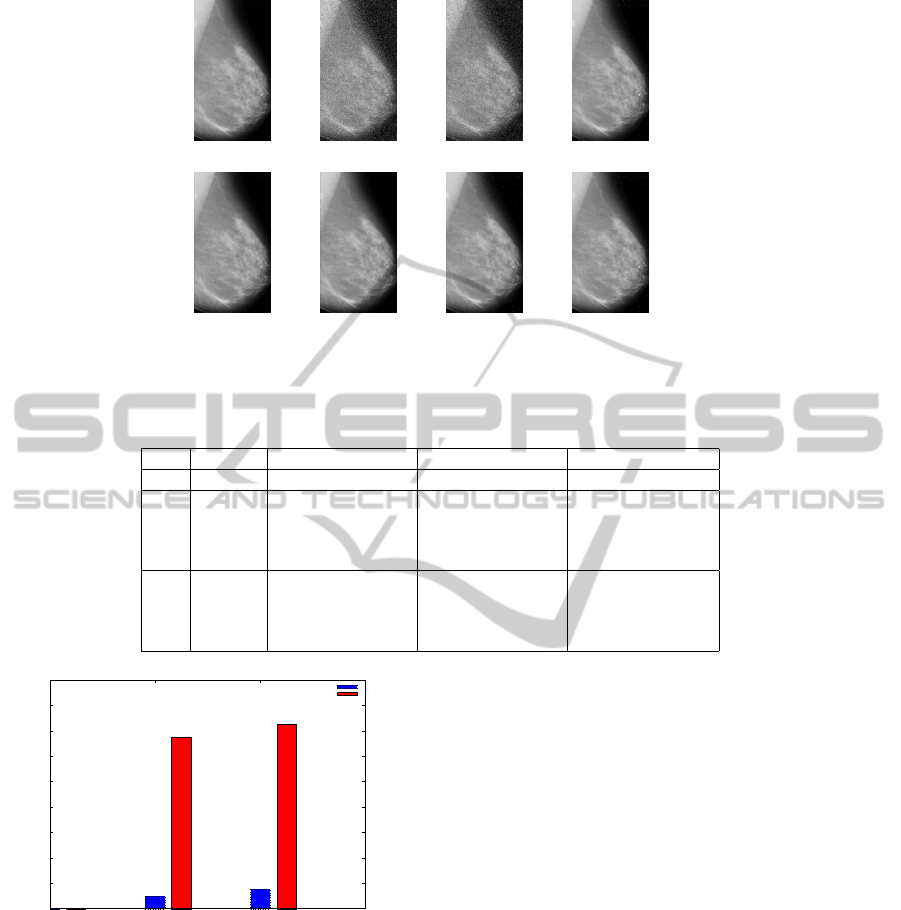
a b c d
e f g h
Figure 1: a) Original Image with 512x960 pixels, b) 20% of noise, c) Mean, d) Median, e)Mean
nc
-Fuzzy(M), f)Mean
nc
-
Euclidean, g) Median
a
-Fuzzy(M), h)Median
a
-Euclidean.
Table 4: Megapixels/sec for 10% and 20% of noise.
Fuzzy (M) Fuzzy (G) Euclidean
Detection Filtering Detection Filtering Detection Filtering
10% Mean
nc
170.90 84.04 196.37 84.37 258.26 84.21
Median
nc
170.99 36.36 196.12 36.57 258.26 36.51
Mean
a
170.98 80.11 196.32 80.29 258.26 80.28
Median
a
171.16 25.21 195.91 25.28 258.42 25.27
20% Mean
nc
170.72 54.16 196.15 54.77 258.42 54.72
Median
nc
170.73 25.16 196.29 25.34 258.50 25.42
Mean
a
170.62 47.61 196.12 48.18 258.26 48.17
Median
a
170.82 6.73 196.18 6.93 258.20 6.93
0
5
10
15
20
25
30
35
40
45
0 Fuzzy(M) Eucidean
Mpix/sec
Secuential
Parallel
Figure 2: Comparison of filters in parallel and sequentially
for 0.20 density with mean-uncorrupted.
GPU regardless of the method used, the amount of
pixels/sec processed is greater than running the se-
quential algorithm.
5 CONCLUSIONS
In this paper, we tested several approaches to remove
impulsive noise of grayscale medical images (mam-
mograms), aiming to achieve a good trade-off be-
tween quality and speed. The base algorithm relies on
two phases: noise detection and noise removal. Noise
detection uses the peer group concept, for which three
metrics were examined: we adapted fuzzy and Eu-
clidean distances for grayscale images. On the other
hand, for the correction phase, two options were con-
sidered: mean or median filters, and even if all or only
non-corrupted pixels are to be used.
The results proved that the quality of the filtered
image does not depend greatly on the metric used.
However, the process is faster if the Euclidean met-
ric is chosen and in this metric is not calculated the k
parameter.
Considering the quality and time in combination,
the median of all the neighbor pixels must be used for
filtering in images with less than 10% wrong pixels.
For greater percents of noise, then mean of non cor-
rupted pixels must be used instead. We also compared
sequential and parallel implementation of our algo-
rithms finding, as expected, that the ratio pixels/sec
processed using a GPU (parallel version), regardless
of then the method used, is greater than the sequential
version.
BIOSIGNALS 2012 - International Conference on Bio-inspired Systems and Signal Processing
538

ACKNOWLEDGEMENTS
This work was funded by the Spanish Ministry
of Science and Innovation (Project TIN2011-26254)
and Ma. Gpe. would also like to acknowledge
DGEST ITCG for the scholarship awarded through
the PROMEP program (Mexico).
REFERENCES
Bioucas, J. and Figueiredo, M. (2009). Total variation
restoration of speckled images using a split-bregman
algorithm. In Image Processing (ICIP).
Camarena, J., Gregori, V., Morillas, S., and Sapena, A.
(2008). Fast detection and removal of impulsive noise
using peer group and fuzzy metrics. In Journal of Vi-
sual Communication and Image Representation 19.
Camarena, J., Gregori, V., Morillas, S., and Sapena, A.
(2010). Some improvements for image filtering using
peer group techniques. In Image and Vision Comput-
ing 28.
Database (2003). http://peipa.essex.ac.uk/info/mias.html.
In The mini-MIAS database of mammograms.
Gonzalez, R. and Woods, R. (1995). Digital Image Process-
ing. Person International.
Jin, L., Liu, H., Song, E., and Xu, X. (2010). Impulsive
noise removal using switching scheme and adaptive
weighted median filters. In Society of Photo-Optical
Instrumentation Engineers 49.
Jin, Z. and Yang, X. (2010). A variational model to remove
the multiplicative noise in ultrasound images. In Jour-
nal of Mathematical Imaging and Vision.
Kang, C. and Wang, J. (2009). Fuzzy reasoning-based di-
rectional median filter design. In Signal Processing.
Lopez, A. (2010). Metricas fuzzy. aplicaciones al filtrado
de imagenes en color. In Phd Thesis Universidad Po-
litecnica de Valencia.
Morillas, S., Gregori, V., Peris, G., and Latorre, P. (2005).
A fast impulsive noise color image filter using fuzzy
metric. In Real-Time Imaging 11.
Nair, M. and Reji, J. (2011). An efficient directional
weighted median switching filter for impulse noise re-
moval in medical images. In Communications in Com-
puter and Information Science 192.
Padma, A., Sukanesh, R., and Vijayan, S. (2010). An effi-
cient directional weighted median switching filter for
impulse noise removal in medical images. In Interna-
tional Journal of Computer Applications.
Sanchez, M., Vidal, V., and Bataller, J. (2011). Peer group
and fuzzy metric to remove noise in images using het-
erogeneous computing. In HeteroPar.
Sanchez, M., Vidal, V., Bataller, J., and Arnal, J. (2010).
Implementig a gpu fuzzy filter for impulsive image
noise correction. In CMMSE.
Smolka, B. (2005). Fast detection and impulsive noise re-
molval in color images. In Real-Time Imaging 11.
Toh, K. and Isa, N. (2010). Noise adaptive fuzzy switching
median filter for salt-and-pepper noise reduction. In
Signal Processing Letters, IEEE.
Zhang, X. and Xiong, Y. (2009). Impulse noise removal
using directional difference based noise detector and
adaptive weighted mean filter. In Signal Processing
Letters, IEEE.
COMPARATIVE ANALYSIS ON METRICS AND FILTERS TO REDUCE IMPULSIVE NOISE IN MEDICAL
IMAGES USING GPU
539
