
Mining Windows Registry for Data Exfiltration Detection
Yi Hu, Rubaiyat Hossain, Papa Seye and Sri Vasireddy
Computer Science Department, Northern Kentucky University,
Highland Heights, KY 41099, U.S.A.
Abstract. This paper illustrates a novel approach for identifying data exfiltra-
tion activities by mining Microsoft Windows Registry. It often takes outsider
attackers a significant amount of efforts to identify the vulnerabilities in the
system or applications and launch the exploit payloads to compromise a sys-
tem. However insider attackers with legitimate access control privileges can
easily steal data and sell data to a third party. Many companies spend lots of
money defending network perimeters and applications from outsider attacks but
only pay little attention to the insider threat. Although there are existing re-
search efforts addressing various aspects of insider attacks, little research fo-
cuses on data exfiltration detection. The proposed model in this paper employs
a data mining method to profile USB device usage patterns and uses various
statistical methods to identify anomalous USB device usages. The effectiveness
of the model was tested with USB access history extracted from the Windows
Registry.
1 Introduction
Data exfiltration is the unauthorized transfer of data from a computer by insider at-
tackers. In the past two years, 70% of businesses have traced the loss of sensitive or
confidential information to USB flash memory sticks. Those findings come from a
new survey of 743 IT and information security professionals, conducted by Ponemon
Institute [1]. A malicious insider knows what information is valuable to the third
party, where a particular piece of information is stored, and the access control mecha-
nism on the valuable information. Studies on insider threats show that with greater
availability of system resources and sensitive information, insider attack is an increas-
ing threat to the network and data security of an organization [2].
In addition, most companies do not have the fine-grained access control policy for
insiders. The problem with most organizations is that employees are given a lot more
access than what they actually need to do their jobs [4]. Motivating examples that
demonstrate the type and nature of possible insider attacks were presented in reports
[5, 6, 7]. When multiple insiders collaborate together to launch an attack, it is even
harder for the organization to identify such an attack. Also, an organization may not
know all access paths to its critical systems [3].
When a USB removable storage device, such as a thumb drive, is connected to a
Windows system, footprints or artifacts are left in the Registry [6]. This character was
Hu Y., Hossain R., Seye P. and Vasireddy S..
Mining Windows Registry for Data Exfiltration Detection.
DOI: 10.5220/0004100101010108
In Proceedings of the 9th International Workshop on Security in Information Systems (WOSIS-2012), pages 101-108
ISBN: 978-989-8565-15-0
Copyright
c
2012 SCITEPRESS (Science and Technology Publications, Lda.)

not known to most individuals. By querying Windows Registry, we are able to find
out what USB devices are connected to a computer previously, who is the manufac-
turer of the USB device, and most importantly the date and time of when the USB
devices was last plugged into the computer. Therefore, essentially the Windows
Registry can be thought as a log file for USB device usage on a computer. Based on
the concentration and dispersion of USB device access operations we can identify
anomalous USB device usages during a certain time frame. For example, if a software
developer normally uses a USB removable storage device only 2 to 4 times a day,
significantly more USB device usage on a day may indicate a potential data exfiltra-
tion activity. To confirm the incident of data exfiltration, further manual investiga-
tions are needed. This paper illustrates a novel approach for identifying data exfiltra-
tion activities by mining Microsoft Windows Registry.
2 The Model
When analyzing the USB device access log, the concentration and dispersion of ac-
cess operations can reflect the characteristics of a person’s accesses to USB devices
during a certain time frame. The days with anomalous high numbers of USB device
accesses indicate a case that warrants further computer forensic investigation of po-
tential data exfiltration activities.
2.1 Statistics used for Identifying Anomalous USB Device Access Data
We use Herfindahl Index [7] to measure the concentration of USB drive access data.
Herfindahl Index H is defined as the sum of squares of the access shares of all access
data in a certain time frame:
2
1
().
N
i
i
Hp
=
=
∑
Where p
i
indicates the percentage of USB device accesses for day i out of all days in
a time window.
The higher the value of the Herfindahl index, the more concentration of USB
device access data for a certain time window. Let us use an overly simplified
example just for the purpose of illustrating the concept of Herfindahl index for
identifying suspicious USB device access activities. Consider a 100-day period USB
access data. Let’s say, from day 1 to day 100, there is an equal number of USB device
accesses for each day. So p
i
= 1 (percent), 1 ≤ i ≤ 100. The corresponding value of H
is 100. Considering another extreme case, all USB accesses happen during a single
day and no accesses for other 99 days. The value of H is 10,000 for this case.
A rule of thumb sometimes used is that H below 1,000 indicates the relatively
limited concentration, and H above 1,800 points indicates the significant
concentration [7].
Table 1 illustrates an example of Herfindahl Index calculation for USB device
access data. The column USB Access Data shows the number of USB device accesses
102

on a computer for each day in an 8-day period. The Access Percentage data illustrates
the access share of a particular day out of all USB device accesses. The Square of
Access Percentages are also shown in this table. It can be seen from the table, the
value of Herfindahl index is 2,246.35 which is larger than 1,800. Based on the rule of
thumb, the significant concentration of USB device access data reveals anomalous
accesses during this period.
Table 1. An example of Herfindahl index calculation.
USB Access Data Access Percentage Square of Access Percentage
1 2 3.77 14.24
2 2 3.77 14.24
3 2 3.77 14.24
4 3 5.66 32.04
5 4 7.55 56.96
6 8 15.09 227.84
7 13 24.53 601.64
8 19 35.85 1285.15
total 53 100 2246.35
Although Herfindahl Index can illustrate the concentration of USB drive access
data, it cannot tell to which extent the data are different from each other. We use Gini
Index to measure the degree of inequality of USB devices access data. It indicates
how equally all device access data are distributed among all days. The Gini Index
captures the information shown in a Lorenz Curve, which is the difference between
the actual distribution of a variable and the hypothetical state in which the distribution
of the variable is uniform [7]. The Gini Index G for USB device access data is
defined as:
1
2( )
100
N
iii
i
ea e
G
=
−
Δ
=
∑
Where N is the total number of days of USB device accesses in certain time frame, i
is used to identify day i and 1≤ i ≤ N.
100
i
i
e
N
=×
a
i
= cumulative percentage
Δe
i
= e
i
–e
i-1
.
A rule of thumb often used is that Gini Index above 40% indicates significant degree
of inequality in the sample data [7]. Table 2 illustrates an example of Gini index
calculation based on the same set of data in Table 1. It is shown significant degree of
inequality reflected in the sample USB device access data. This is because the Gini
Index value is 45.52% which is larger than the baseline value 40%.
103

Table 2. An example of Gini index calculation.
USB Access Data Access Percentage a
i
e
i
e
i
- a
i
2 × (e
i
- a
i
) × Δe
i
/100
1 2 3.77 3.77 12.5 8.73 2.18
2 2 3.77 7.55 25 17.5 4.36
3 2 3.77 11.3 37.5 26.2 6.54
4 3 5.66 17 50 33 8.25
5 4 7.55 24.5 62.5 38 9.49
6 8 15.09 39.6 75 35.4 8.84
7 13 24.53 64.2 87.5 23.4 5.83
8 19 35.85 100 100 0 0
total 45.52
2.2 Exception Subset Identification
For the access logs that Herfindahl Index and Gini Index raise the red light, we
propose a method to identify individual USB data access instances that actually
contains excessive USB device accesses, i.e., the exception subset. Our method for
identifying exception subset of USB data accesses is based on the idea of sequential
exception detection [9] and is described as follows. Let us define the set of USB
device access data as S. The dissimilarity function DF(S) is used to illustrate to what
extent the data in a set S is different from each other. Intuitively, variance of a data set
can be used to measure the dissimilarity, so we will use this standard measurement for
that purpose. The process for identifying the exception subset is as follows. The data
set is sorted first. Then we measure the dissimilarity function after removing the
largest number in the data set. We also calculate the smooth factor (defined later) that
reflects to what extend the dissimilarity can be reduced by removing the largest
number. Repeat the procedure by removing the largest number in the new set and
measure the dissimilarity function and smooth factor again. Continue this process
until the remaining set only has one data element. The subset with the largest smooth
factor is the exception subset.
To facilitate the calculation, cardinality function C(S) is defined as the size of the
set S. The smooth factor SF(S - S
i
) is defined as follows:
SF(S - S
i
) = C(S - S
i
) * (DF(S) –DF(S - S
i
))
Where S
i
represents the set containing the elements removed (in the steps mentioned
above), S – S
i
represent the new set after elements in S
i
are removed from S. C(S – S
i
)
represents the size of the set (S – S
i
). DF(S) and DF(S – S
i
) represent dissimilarity
function values of set S and (S – S
i
) respectively. The smooth factor reflects the extent
to which the dissimilarity can be reduced by removing the subset S
i
from the set S.
As we mentioned previously, the variance of a data set is used to identify the
dissimilarity in the data set. Thus, DF(S) can be defined as follows:
2
()
()
||
i
x
x
DF S
S
∑−
=
104
where x
i
represents an element in the set S and
x
represents the mean of data in set S,
| S | is the size of the set S.
The algorithm for finding the exception subset is presented as follows.
Algorithm:
Sort the set of USB device access data S in the descending order.
Generate N-1 subset S
1
, S
2
, …, S
N-1
, where S
i
contains top i (1 ≤ i ≤ N-1) largest numbers
from set S, N is the size of set S. Also generate corresponding subset S – Si for each i.
For i = 2 to N
Calculate the smooth factor SF(S - S
i
)for each set S
i
.
Find the subset with the largest smooth factor, say, S - S
k.
Output the exception subset which is S
k.
The reason we use this algorithm instead of using some metric distance based
algorithm is based on the intrinsic of our problem. Our problem is that after seeing a
sequence of device access data, finding the data that does not seem to belong to the
usual access pattern. The algorithm proposed here is to identify the subset by
removing which the remaining data are most similar to each other. That is, removing
the exception subset reduces the variance of the data the most. The disadvantage of
using metric distance based algorithm is that most algorithms like these can generate
noise subset or outlier subset that is not desirable.
3 Experiments and Discussions
In order to verify the effectiveness of the proposed model, we conducted experiments
on various real world Windows Registry data in order to discover anomalous USB
access activities. We used a tool called USB History [8] to extract USB access data
from the Windows Registry on several computers.
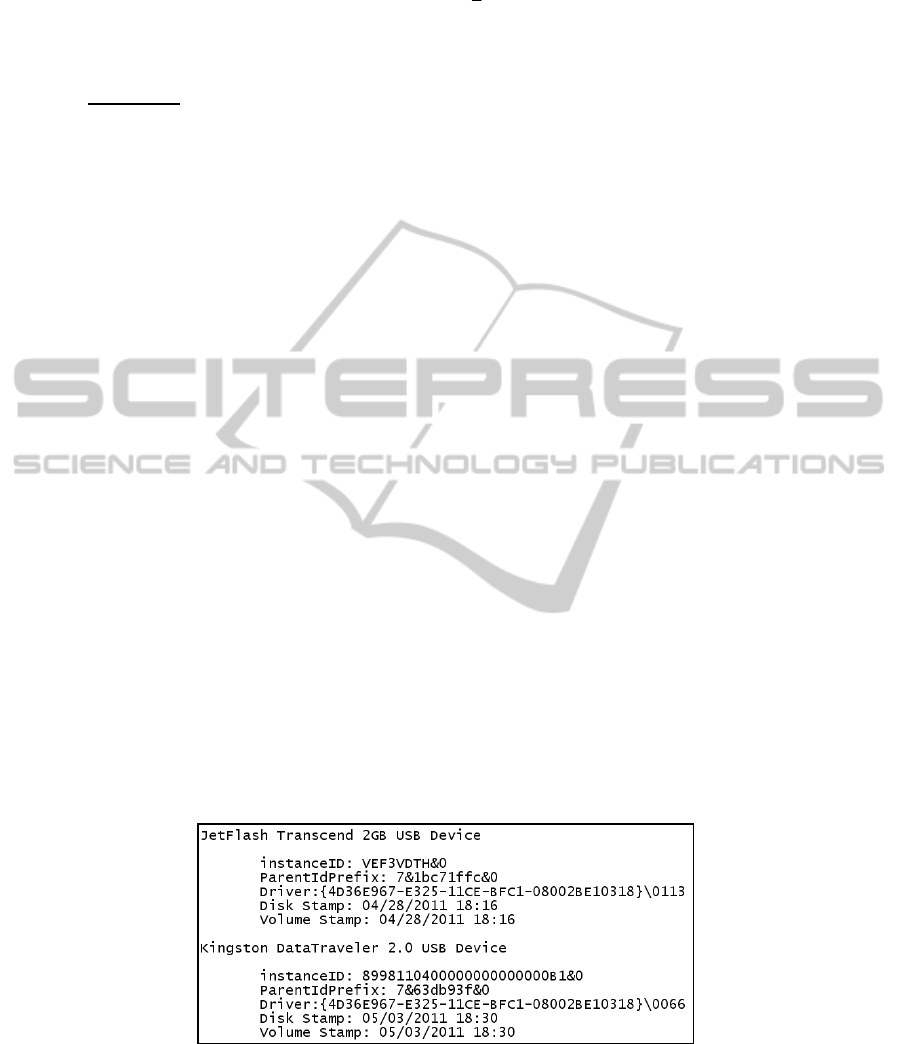
The partial output of USB History is illustrated in Figure 1. It can be seen that
Windows Registry logs very detailed USB device usage history data. We conducted
our experiments on multiple sets of data and the results show our model works really
well on identifying anomalous USB usage data.
Fig. 1. An example of USB history data.
105

We first calculate the Herfindahl Index of history data containing anomalous USB
access history as shown in Table 3. It can be seen that Herfindahl Index value
1,928.24 correctly identifies this suspicious USB device access history since its value
is larger than the baseline value 1,800.
Table 3. Herfindahl index calculation of anomalous USB usage data.
Device Access Data Percentage Access Square of the Percentage
1 1 0.99 0.98
2 1 0.99 0.98
3 1 0.99 0.98
4 2 1.98 3.92
5 2 1.98 3.92
6 2 1.98 3.92
7 3 2.97 8.82
8 5 4.95 24.51
9 13 12.87 165.67
10 17 16.83 283.31
11 26 25.74 662.68
12 28 27.72 768.55
Total 101 100.00 1928.24
We also calculated the Herfindahl Index for legitimate USB usage history data as
illustrated in Table 4. It can be seen that the Herfindahl Index is 1,275.99 for this
history. Thus our method indicates that this history does not contain suspicious USB
usage activities.
Table 4. Herfindahl index calculation of legitimate USB usage data.
Device Access Data Percentage Access Square of the Percentage
1 1 2.17 4.73
2 1 2.17 4.73
3 1 2.17 4.73
4 2 4.34 18.90
5 2 4.34 18.90
6 2 4.34 18.90
7 3 6.52 42.53
8 5 10.87 118.15
9 6 13.04 170.13
10 6 13.04 170.13
11 7 15.22 231.57
12 10 21.74 472.59
Total 46 100.00 1275.99
We also conducted experiments on Gini Index calculation on the previous two
USB usage histories. Table 5 illustrates the Gini Index calculation of anomalous USB
usage data. It can be seen that the value of Gini index is 57.67% which is larger than
the baseline value 40%. Thus Gini Index verifies that there is a great extent of
inequality in the given set of USB device access data.
106

Table 5. Gini index calculation of anomalous USB usage data.
Device Access Data Percentage Access
a
i
e
i
e
i
- a
i
2 x (ei -ai) x Δ(ei) /100
1 1 0.99 0.99 8.33 7.34 1.22
2 1 0.99 1.98 16.66 14.68 2.45
3 1 0.99 2.97 25.00 22.03 3.67
4 2 1.98 4.95 33.33 28.38 4.73
5 2 1.98 6.93 41.66 34.73 5.79
6 2 1.98 8.91 50.00 41.09 6.85
7 3 2.97 11.88 58.33 46.45 7.74
8 5 4.95 16.83 66.66 49.83 8.30
9 13 12.87 29.70 75.00 45.30 7.55
10 17 16.83 46.53 83.33 36.80 6.13
11 26 25.74 72.28 91.66 19.38 3.23
12 28 27.72 100.00 100.00 0.00 0.00
total 57.67
Table 6 illustrates the Gini Index calculation of legitimate USB usage data. It can
be seen that the value of Gini index is 39.48% which is less than the baseline value
40%. Thus Gini Index verifies that there is not significant inequality in the given set
of USB device access data.
Table 6. Gini index calculation of legitimate USB usage data.
Device Access Data Percentage Access
a
i
e
i
e
i
- a
i
2 x (ei -ai) x Δ(ei) /100
1 1 2.17 2.17 8.33 6.16 1.03
2 1 2.17 4.35 16.67 12.32 2.05
3 1 2.17 6.52 25.00 18.48 3.08
4 2 4.34 10.87 33.33 22.46 3.74
5 2 4.34 15.22 41.67 26.45 4.41
6 2 4.34 19.57 50.00 30.43 5.07
7 3 6.52 26.09 58.33 32.24 5.37
8 5 10.87 36.96 66.67 29.71 4.95
9 6 13.04 50 75.00 25.00 4.17
10 6 13.04 63.04 83.33 20.29 3.38
11 7 15.22 78.26 91.67 13.41 2.23
12 10 21.74 100 100 0.00 0.00
total 39.48
After Herfindahl Index calculated in Table 3 and Gini Index calculated in Table 5
confirm the anomalous USB usage data in the data set {1, 1, 1, 2, 2, 2, 3, 5, 13, 17,
26, 18}, we run the program implementing the algorithm proposed in section 3.2 for
identifying the exception subset. Table 7 illustrates the calculation of the smooth
factors for subset S
i
, 1 ≤ i ≤ 11. It can be seen from the table that the largest smooth
factor value 731.7 is generated by the set {28, 26, 17, 13}. It means that by removing
these 4 data elements, the dissimilarity of the data in the original set will be reduced
the most. Thus the days corresponding to the USB device assess data in the set {28,
26, 17, 13} are the days that are worth further computer forensic investigations to
confirm potential data exfiltration activities.
107
Table 7. An example of identifying exception subset.
i
Si S-Si C(S-Si) DF(S-Si) SF (S-Si)
1
{28} {26, 17, 13, 5, 3, 2, 2, 2, 1, 1, 1} 11 63.5 325.3
2
{28, 26} {17, 13, 5, 3, 2, 2, 2, 1, 1, 1} 10 28.61 644.7
3
{28, 26, 17} {13, 5, 3, 2, 2, 2, 1, 1, 1} 9 13.11 719.7
4
{28, 26, 17, 13} {5, 3, 2, 2, 2, 1, 1, 1} 8 1.61 731.7
5
{28, 26, 17, 13, 5} {3, 2, 2, 2, 1, 1, 1} 7 0.49 648.1
6
{28, 26, 17, 13, 5, 3} {2, 2, 2, 1, 1, 1} 6 0.25 557
7
{28, 26, 17, 13, 5, 3, 2} {2, 2, 1, 1, 1} 5 0.24 464.2
8
{28, 26, 17, 13, 5, 3, 2, 2} {2, 1, 1, 1} 4 0.19 371.6
9
{28, 26, 17, 13, 5, 3, 2, 2, 2} {1, 1, 1} 3 0 279.2
10
{28, 26, 17, 13, 5, 3, 2, 2, 2, 1} {1, 1, 1} 2 0 186.2
11
{28, 26, 17, 13, 5, 3, 2, 2, 2, 1, 1} {1} 1 0 93.08
4 Conclusions
Studies showed that a significant number of businesses have traced the loss of sensi-
tive or confidential information to USB flash memory sticks. In this paper, we present
a novel model for identifying data exfiltration activities by mining Microsoft Win-
dows Registry. When a USB removable device is connected to a Windows system,
footprints are left in the Registry. By analyzing the concentration and dispersion of
USB device access operations we can identify anomalous USB device uses during a
certain time frame. Further computer forensic investigations are performed to confirm
the case of data exfiltration activities.
References
1. InformationWeek,http://www.informationweek.com/news/storage/security/231300434
(2011).
2. Randazzo, M., Keeney, M., Kowalski, E., Cappelli, D. and Moore, A.: Insider Threat
Study: Illicit Cyber Activity in the Banking and Finance Sector, CERT and the National
Threat Assessment Center (2004).
3. Cappelli,D.: Risk mitigation strategies: lessons learned from actual insider attacks, In Pro-
ceedings of the Sixth Annual Workshop on Cyber Security and Information Intelligence
Research (2010).
4. Cole, E., Ring, S.: Insider Threat, Protecting the Enterprise from Sabotage, Spying, and
Theft, 1st edition. Syngress (2005).
5. Gandhi, M.: Data Profiling and the Access Path Model, A Step Towards Addressing Insider
Misuse in Database Systems, Dissertation, University of California Davis (2005).
6. Carvey, H.: Windows Forensic Analysis DVD Toolkit, 2
nd
Edn, Syngress (2009).
7. Financial Soundness Indicators: Compilation Guide, International Monetary Fund,
http://www.imf.org/external/pubs/ft/fsi/guide/2006/.
8. USB History, http://nabiy.sdf1.org/index.php?work=usbHistory.
9. Arning, A., Agrawal, R., Raghavan, P.:A linear method for deviation detection in large
database, In the Proceedings of 1996 International Conference on Knowledge Discovery
and Data Mining (1996).
108
