
Healthy/Esophageal Speech Classification using Features
based on Speech Production and Audition Mechanisms
Sofia Ben Jebara
Lab. COSIM, Ecole Sup´erieure des Communications de Tunis, Carthage University
Route de Raoued 3.5 Km, Cit´e El Ghazala, Ariana 2088, Tunisia
Keywords:
Speech Production Mechanism, Perceptual Audition Process, Classification, Healthy/Esophageal Speech.
Abstract:
This paper focuses on the classification of speech sequences into two classes: healthy speech and esophageal
speech. Two kinds of features are selected: those based on speaker speech production mechanism and those
using listener auditory system properties. Two classification strategies are used: the Discriminant Analysis
and the GMM based bayesian classifier. Experiments, conducted with a large database, show classification
accuracy using both features. Moreover, auditory based features are the best since error rates tend to be null.
1 INTRODUCTION
Nowadays, a big importance is attached to the so-
cial integration of persons suffering from pathologies.
Particularly, recent research works are conducted in
order to allow alaryhngeal people, using esophageal
voice as substitution speech, to communicate through
fixed and mobile phones. In such situations, due to
the speech production process conducted by esoph-
agus extremity, esophageal voice is not clear and not
very intelligible. In order to improveits quality, a sim-
ple device to insert in the telephone equipment would
allow elevating and clarifying this voice. This equip-
ment would work when esophageal voice is in use and
will not be functional when healthy voice is spoken.
A system of classification healthy/esophageal speech
is then useful in order to attend this purpose. Hence,
the goal of this paper is to propose a useful solution
to make the decision whether the telephone spoken
speech is healthy or esophageal. Successful classifi-
cation will enable the automatic non-invasive device
to work.
The speech classification is mainly composed of
two important blocks which are the features extractor
and the decision module. The most commonly used
features for healthy speech analysis are zero crossing
rate, auto-correlation coefficients, speech peakness
and energy, wavelet based features, delta line spectral
frequencies (Atal and Rabiner, 1996; Childers et al.,
1989; ITU-T, 1996) which can be qualified as tem-
poral and spectral features. Some others such as Mel
Frequency Cepstral Coefficients are categoriz-
ed as perceptual features (Rabiner and Juang, 1993).
By the other side, the most commonly used fea-
tures for esophageal voice are Pitch, Jitter, Shimmer,
Harmonic to Noise Ratio (HNR), Normalized Noise
Energy (NNE), (Orlikoff, 2000; Kasuya and Ogawa,
1986),... which are called acoustic parameters.
In this paper, we propose the use of two kinds of
features, the first one is related to the hearing behavior
of the listener whereas the second one expresses the
speech production mechanism of the speaker. These
families of features are justified as follows: both
voices are heard by human listeners whose percep-
tual properties towards healthy and esophageal voices
are the same. Hence, the ear will be able to differ-
entiate the auditive quality of the two voices. On the
opposite side, the two voices are produced by two dif-
ferent mechanisms. Healthy speech is the result of an
excitation, filtered by the glottis, the vocal track and
the lips whereas the esophageal voice is presented as
the result of an excitation, filtered by the esophagus
extremity and the lips. So we expect that their pro-
duction mechanism models will be different and some
classical features well adapted to healthy speech will
fail when used to characterize esophageal speech.
The used features related to the audition mecha-
nism are the popular Mel Frequency Cepstral Coefi-
cients (MFCC) which are powerful for many speech
processing tasks such as recognition, fingerprinting,
indexing,.. Features related to speech production
mechanism are Linear Prediction Coherence Func-
tion features (LPCF) which have interesting prop-
erties for voice activity detection, voiced-unvoiced-
99
Ben Jebara S..
Healthy/Esophageal Speech Classification using Features based on Speech Production and Audition Mechanisms.
DOI: 10.5220/0004181500990104
In Proceedings of the International Conference on Bio-inspired Systems and Signal Processing (BIOSIGNALS-2013), pages 99-104
ISBN: 978-989-8565-36-5
Copyright
c
2013 SCITEPRESS (Science and Technology Publications, Lda.)
silence classification (BenJebara, 2006; BenJebara,
2008) in noisy environment.
Classically, the classification strategy (decision
module) is based on heuristic thresholding, fuzzy
logic, pattern recognition, neural networks, maximum
likelihood estimation (Atal and Rabiner, 1996; Ar-
slan and Hansen, 1999; Liao and Gregory, 1999)... In
this paper, Discriminant Analysis (DA) and Gaussian
Mixture Models (GMM) are used to classify data into
healthy and esophageal voices. The classification is
done either on direct features or on their related Prin-
cipal Component Analysis parameters and the ones
obtained after dimensionality reduction.
The paper is organized as follows. Section 2 gives
an overview on speech production mechanism fea-
tures. Section 3 presents experimental results and
an analysis about healthy/esophageal speech classi-
fication using yet mentioned features. In section 4,
MFCC features are recalled, their histograms are il-
lustrated and classification results are given. Finally,
some concluding remarks are drawn.
2 SPEECH PRODUCTION
FEATURES
2.1 Motivation and Ideas
It is well known that the classic way to describe
healthy human speech is the autoregressive model:
s(k) =
L
P
∑
i=1
a
i
(k)s(k− i)+ g(k), (1)
where {a
i
(k)} are the model parameters, L
P
is the
model order and g(k) is the source. It is a quasi-
random white noise for unvoiced frames and a quite
periodic signal for the voiced frames. According to
this model, it is possible to predict a sample
b
s(k) us-
ing previous observations and to extract the prediction
error as follows
e
m
(n) = s
m
(n) −
L
P
∑
i=1
p
m
(i)s
m
(n− i), (2)
where {p
m
(i)} is the
th
order predictor coefficient cal-
culated for the frame number m and n is the time in-
dex.
In the case of esophageal speech, the produc-
tion mechanism is different: esophagus extremity in-
stead of vocal cord, presence of aspiration noise, ab-
sence of glottic source,... The autoregressive model
could be inappropriate but, due to the absence of bet-
ter precise model, we propose to generalize its use
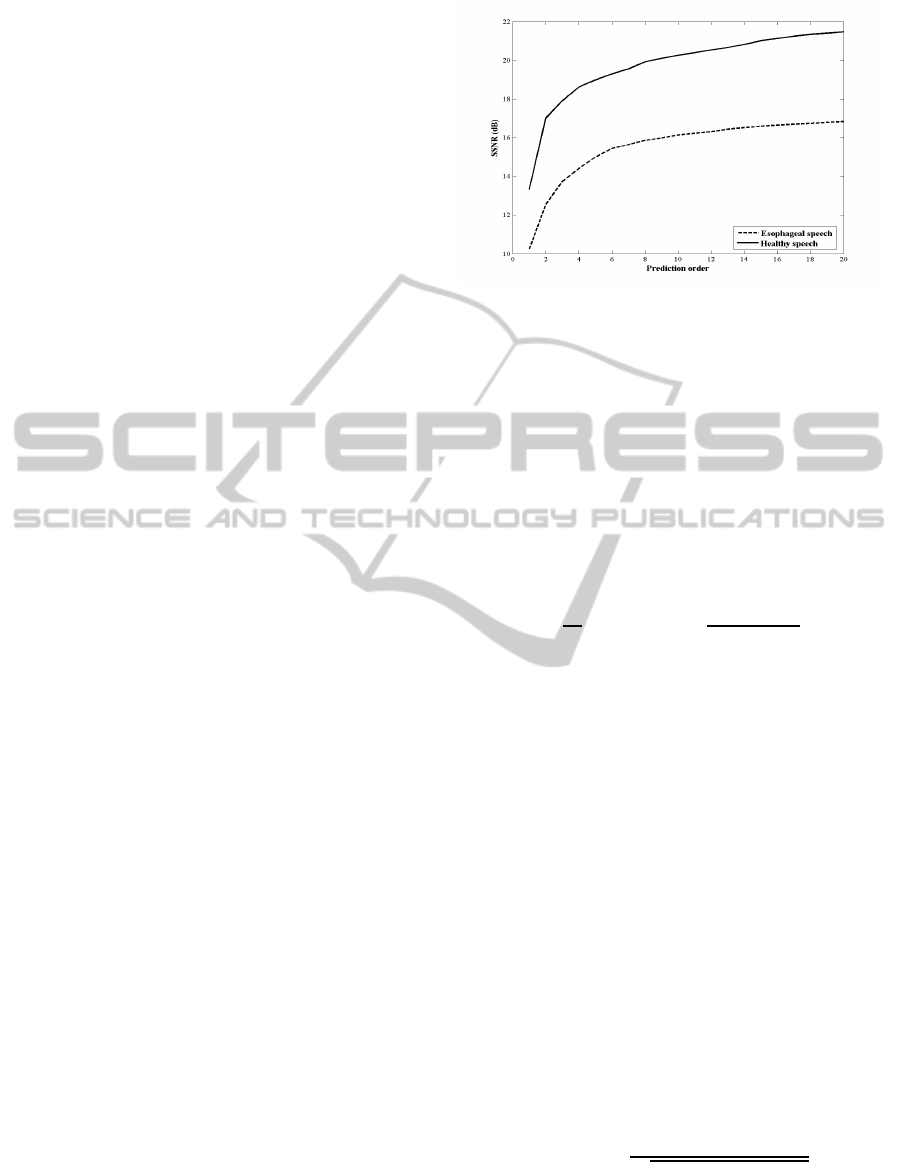
Figure 1: Prediction quality in term of SSNR for healthy
and esophageal voices.
to esophageal speech. We expect that the predic-
tion error signal will is more important than the one
of healthy speech. We propose to validate this idea
by conducting by the following experiment: a large
database of healthy speech is chosen and the same
sentences are pronounced by esophageal speakers to
create the esophageal database. Linear prediction of
different orders is applied to both databases and the
the quality of prediction is evaluated using the Seg-
mental Signal to Noise Ratio:
SSNR =
1
M
M
∑
m=1
10log10
E
s
m
(n)
2
E {e
m
(n)
2
}
!
, (3)
where M is the total number of frames.
Fig.1 represents the evolution of the SSNR ver-
sus the predictor length L
P
for both healthy and
esophageal voices. This figure shows that, for each
predictor order, the predictor quality obtained for
healthy speech is better than the one obtained for
esophageal speech. The difference varies from 2 to
4 dB.
According to this constatation, we think that the
amount of the prediction error comparedto the speech
signal itself can be a good indicator of the kind of
voice (healthy or esophageal).
2.2 Features Extraction
A possible solution to consider the similarity between
the speech signal and its predictionresidue is to calcu-
late their coherence function in the frequency domain
(BenJebara, 2008):
C
s,e
(m, f) =
P
s,e
(m, f)
p
P
s,s
(m, f)P
e,e
(m, f)
, (4)
where P
s,s
(m, f) and P
e,e
(m, f) are spectral densities
of m
th
frame of signals s(k) and e(k) respectively and
P
s,e
(m, f) is the inter-signal spectral density.
BIOSIGNALS2013-InternationalConferenceonBio-inspiredSystemsandSignalProcessing
100
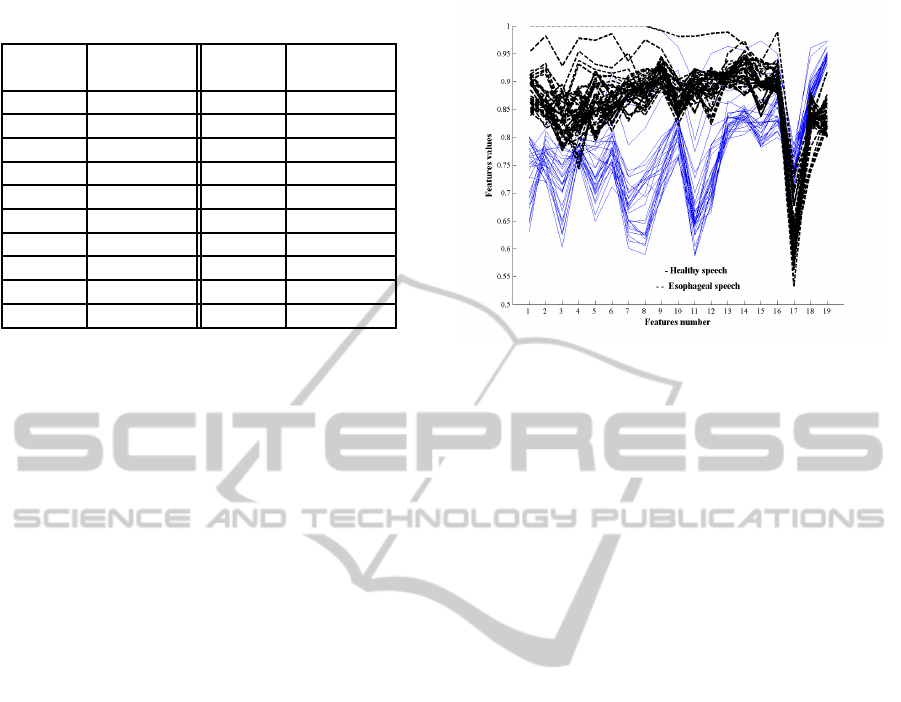
Table 1: Critical bands.
Band Frequency Band Frequency
number range (Hz) number range (Hz)
1 0-125 11 1500-1750
2 125-250 2 1750-2000
3 250-375 13 2000-2250
4 375-500 14 2250-2750
5 500-625 15 2750-3125
6 625-750 16 3125-3750
7 750-875 17 3750-5000
8 875-1000 18 5000-6500
9 1000-1250 19 6500-8000
10 1250-1500
Moreover, one of the most interesting properties
of he human auditory system is the existence of the
critical bands concept (Zwicker, 1961). Critical bands
are defined as the smallest frequencyranges which ac-
tivate the same part of the basilar membrane and fre-
quency bins within the same critical band are equally
perceived (see Tab. 1 for critical bands repartition).
To mimic the critical band structure, the proposed
features are the sum of the coherence magnitudes cal-
culated in each critical band. The features are called
Linear Prediction Coherence Function features and
are defined as follows:
LPCF
B
i
m
=
∑
f∈B
i
|C
s,e
(m, f)|. (5)
The whole set of LPCF
B
i
m
constitutes the set of param-
eters to be used for healthy/esophgeal speech classifi-
cation.
2.3 Illustration
To illustrate LPCF features, the phoneme “A” pro-
nounced by both healthy and esophageal speakers is
considered and selected featuresare calculated. Fig. 2
illustrates the evolution of the LPCF
B
i
m
( (i = 1, ..., 19)
features in a particular manner in order to visual-
ize high dimensional data (here 19). In fact, each
curve represents the 19
th
features for the considered
frame. Both healthy and esophageal voices features
are plotted. Fig. 2 permits to notice that almost
all esophageal speech features are larger than those
of healthy speech. This fact confirms the usefulness
of proposed features to discriminate between healthy
and esophageal voice.
Figure 2: Evolution of healthy and esophageal phoneme
“A” features PLPCFF
B
i
m
.
3 CLASSIFICATION RESULTS
USING LPCF FEATURES
3.1 Classification Tools
The experiments are conducted with a database com-
posed of 15 minutes of healthy speech and 15 minutes
of esophageal speech. The two sets are arranged in
705 audio files sampled at 16 KHz. 66% of frames
are used for training and 34% are used for test.
Two supervised techniques were used to construct
decision functions. They are the Discriminant Anal-
ysis (DA) and the Gaussian Mixture Model based
bayesian classifier (GMM). The Discriminant Analy-
sis is a parametric classification approach which uses
a decision function that tries to maximize the distance
between the centroids of each class of the training
data and at the same time minimizes the distance of
the data from the centroid of the class to which it be-
longs.
The bayesian classification is based on probability
theory. The posterior probabilities are computed with
the Bayes formula and one class is chosen if it has the
highest posterior probability. The Gaussian mixtureis
used to model the distributions. It is a weighted sum
of Gaussian distributions whose model parametersare
computed from the training data using Figueiredo-
Jain algorithm which finds the “best” overall model
directly using an iterative approach. The method is
based on Minimum Message Length MML-like crite-
rion which is directly implemented by a modification
of the Expectation-Maximization algorithm (EM).
Healthy/EsophagealSpeechClassificationusingFeaturesbasedonSpeechProductionandAuditionMechanisms
101
3.2 Classification Criteria
To evaluate the effectiveness of proposed features for
healthy/esophageal speech classification, the proba-
bilities of correct and false detection are computed.
They are denoted
• P
e
: the probability of false decision. It is calcu-
lated as the ratio of incorrectly classified frames
to the total number of frames.
• P
health
(resp. P
eso
): the probability of correct
healthy (resp. esophageal) speech classification.
It is calculated as the ratio of correctly classified
healthy (resp. esophageal) speech frames to the
total number of healthy(resp. esophageal)frames.
3.3 Experimental Results
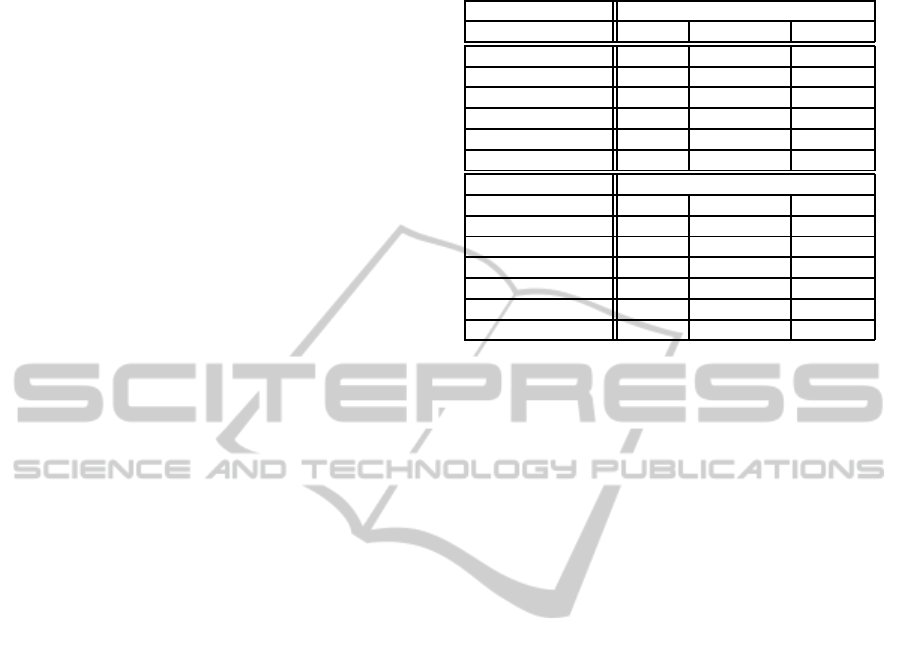
Tab. 2 illustrates performances of the classification
technique in terms of probability of correct and false
decision for healthy/esophageal speech classification.
Tab. 2 permits the following interpretations.
• The first line gives performances when the nine-
teen coherence function features are used. The
rate of error is quite low (around 8 and 9 %) and
esophagealframes are better classified. Moreover,
the GMM classifier is slightly better than DA clas-
sifier.
• The Principal Component Analysis is used, it is a
classic tool for reducing large scale multivariate
data dimensionality. Each principal component
is obtained by linear combination of the original
variables, with coefficients equal to the eigenvec-
tors of the correlation or covariance matrix. The
principal componentsaresorted by descending or-
der of the eigenvalues. The second line of Tab. 2
gives classification results after PCA. We notice
the error rate regression with GMM classifier. It
is due to better GMM fitting of PCA parameters
distributions. However, results are the same with
LDA classifier.
• The dimensionality of PCA components is re-
duced by discarding the PCA features related to
the minimum values of eigenvalues of original co-
variance matrix. The other lines of Tab. 2 show
the classification performances when the dimen-
sion is reduced. PCA(K − i) means that the first
K − i principal componants are retained. It shows
that better classification results are obtained when
3 components are discarded, keeping 16 principal
components. In such case, the probability of false
classification is reduced to 6.7% with GMM clas-
sifier.
Table 2: Classification results using LPCF features.
GMM
Features P
e
(%) P
health
(%) P
eso
(%)
PLPCFF 8.47 85.24 97.45
with PCA 7 89.59 96.62
with PCA(K − 1) 6.78 89.59 97.07
with PCA(K − 2) 6.94 89.8 96.51
with PCA(K − 3) 6.70 90.02 96.79
with PCA(K − 4) 7.14 89.7 96.23
LDA
Features P
e
(%) P
health
(%) P
eso
(%)
PLPCFF 9.32 85.24 96.45
with PCA 9.32 85.24 96.45
with PCA(K − 1) 9.08 85.45 96.73
with PCA(K − 2) 9.46 85.29 96.06
with PCA(K − 3) 9.24 85.77 96.06
with PCA(K − 4) 9.49 85.5 95.83
4 AUDITORY FEATURES
4.1 Definition
We deal now with the second category of classifi-
cation features related to the audition mechanism.
The Mel-Frequency Cepstral Coefficients (MFCCs)
are commonly used as speech features for many tasks
such as speech analysis, speaker identification, auto-
matic speech recognition (ASR),... They constitute
a perceptually motivated, compact representation of
the spectral envelope of speech and are intended to be
independent of pitch and related features. The proce-
dure of computation is the following: amplitude spec-
trum estimation, spectrum grouping into Mel-bands,
contents sum of each band, logarithm taking, Dis-
crete Cosine Transform (DCT) calculus. First or-
der derivates describing the speech and second or-
der derivates describing velocity are also calculated.
Hence, a MCFF vector of 36 features (12 MFCC, 12
first order derivates denoted ∆MFCC and 12 second
order derivates denoted ∆∆MFCC), will be used for
classification.
4.2 Histograms
Histograms of healthy and esophageal speech MFCC
features are calculated. Due to lake of space, only the
first twelve histograms and represented in Fig 3. They
permit the following interpretations.
• Globally, the histograms differ in shape and val-
ues range.
• Sometimes, the same Gaussian shape and the
same values range are obtained for both voices
BIOSIGNALS2013-InternationalConferenceonBio-inspiredSystemsandSignalProcessing
102
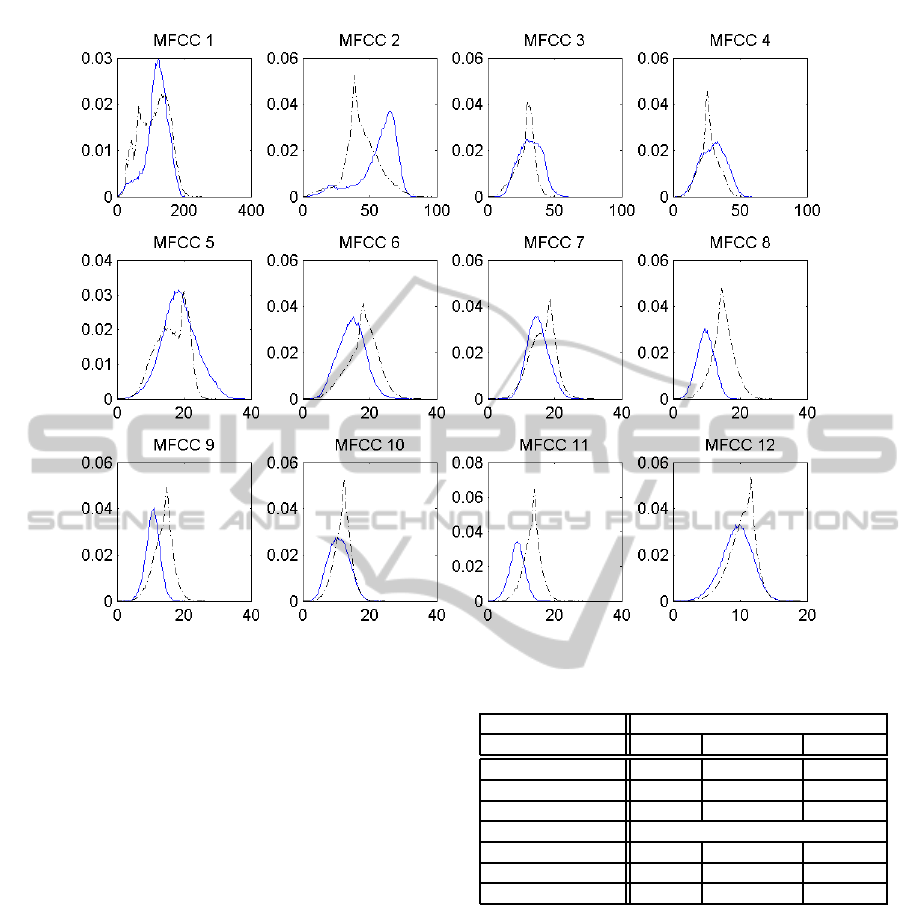
Figure 3: Histograms of MFCC features for healthy (solid line) and esophageal speech (dashed lines).
(see for example MFCC
3
and MFCC
4
).
• In some other times, the shape is the same but the
values range is quite different, where a confusion
range is obtained (see for example MFCC
8
and
MFCC
9
).
• In other times, the shape is different and the range
is almost the same (see for example MFCC
12
).
• A great number of histograms look like Gaus-
sian distributions or generalized Gaussian distri-
butions.
• Other histograms can be assimilated to mixture of
gaussian distributions.
4.3 Classification Results with MFCC
Features
Tab. 3 gives classification results in the same con-
ditions and with the same tools as previous ones.
It shows the diminution of error rate when first or-
der and second order derivates are used, which have
meaningful sense of velocity and acceleration. We
can also conclude about the very low rate of error
which reaches 0.6%. Hence, we can conclude about
the validity of MFCC features for healthy/esophageal
Table 3: Classification results using MFCC features.
GMM
Features P
e
(%) P
health
(%) P
eso
(%)
MFCC 2.56 96.69 98.13
MFCC+ ∆ 1.1 98.59 99.17
MFCC+ ∆ + ∆∆ 0.06 99.02 99.57
LDA
MFCC 6.87 92.18 94
MFCC+ ∆ 4.39 95.08 96.11
MFCC+ ∆ + ∆∆ 3.09 96.6 97.2
speech classification and about the superiority of this
category of perceptual features over the others based
on speech production mechanism (despite their low
error rate which is less than 10%).
5 CONCLUSIONS
The research work presented in this paper aimed
healthy/esophageal speech classification. Selected
features are of two types: those considering the
speaker speech production mechanism expressed in
terms of similarity measure between original speech
and its prediction error in different frequency bands
Healthy/EsophagealSpeechClassificationusingFeaturesbasedonSpeechProductionandAuditionMechanisms
103

arranged in order to mimick the critical band behavior
of human ear and those considering the listener audi-
tion mechanism expressed in terms of Mel Frequency
Cepstral Coefficients. Using Discriminant Analysis
and the Gaussian Mixture Model bayesian classifiers,
accuracy varying from 94% to 99.6% is achieved.
REFERENCES
Arslan, L. M. and Hansen, J. H. L. (1999). Selective train-
ing for hidden markovian models with applications to
speech classification. In IEEE Trans. on Speech and
Audio Processing. Vol. 7, no.1, pp. 46-54.
Atal, B. S. and Rabiner, L. R. (1996). A new pattern recog-
nition approach to voiced-unvoiced-silence classifica-
tion with applications to speech recognition. In IEEE
Trans. Acoust. Speech and Signal Processing. ASSP-
24, pp. 201-212.
BenJebara, S. (2006). Multi-band coherence features
for voiced-unvoiced-silence speech classification. In
Proc. of the Int. Conf. on Information and Commu-
nication Technologies: from Theory to Applications
ICTTA. Damascus-Syria.
BenJebara, S. (2008). Voice activity detection using peri-
odioc/aperiodic coherence features. In Proc. of the
16th European Signal Processing Conf. EUSIPCO.
Lauzane-Switzerland.
Childers, D. G., Hahn, M., and Larar, J. N. (1989).
Silent and voiced/unvoiced/mixed excitation (four-
way) classification of speech. In IEEE Trans. Acoust.
Speech and Signal Processing. vol. ASSP-37, no. 11,
pp. 1171-1774.
ITU-T (1996). Recommandation g729 annex b.
Kasuya, H. and Ogawa, S. (1986). Normalized noise energy
as an acoustic measure to evaluate pathologic voice.
In Journal of the Acoustical Society of America. pp.
34-43.
Liao, L. and Gregory, M. A. (1999). Algorithms for speech
classification. In Proc. of the Int. Symp. on Sig-
nal Processing and its Applications ISSPA. Brisbane-
Australia.
Orlikoff, P. B. R. (2000). Clinical measurement of speech
and voice. CA:Singular Publishing Group, 2nd edi-
tion.
Rabiner, L. R. and Juang, B. H. (1993). Fundamentals of
speech recognition. Prentice-Hall, New Jersey.
Zwicker, E. (1961). Subdivision of the audible frequency
range into critical bands. In The J. of Acoustical Soci-
ety of America.
BIOSIGNALS2013-InternationalConferenceonBio-inspiredSystemsandSignalProcessing
104
