
Indices and Repeatability Tests of Cardiovascular Function Performed
on the Arterial Distension Waveform
Case Study: Angiography Intervention
V. G. Almeida
1
, J. Borba
1
, H. C. Pereira
1,2
, T. Pereira
1
, J. Cardoso
1
and C. Correia
1
1
Instrumentation Center (GEI-CI), University of Coimbra, Coimbra, Portugal
2
ISA-Intelligent Sensing Anywhere, Coimbra, Portugal
Keywords:
Arterial Distension Waveform, Augmentation Index, Clinical Validation, Repeatability Trials, Angiography
Intervention.
Abstract:
The arterial distension waveform (ADW) analysis is a reliable technique for cardiovascular function assess-
ment. The purpose of this study was to perform the pre-clinical validation of a non-invasive prototype focusing
the repeatability tests and cross-relationships between different subject groups. The evaluation focused param-
eters retrieved from ADW: systolic peak (SP), dicrotic notch (DN), RP (reflection point) and Augmentation
index (AI). One hundred and fifty one subjects (61 men and 90 women, aged between 18 and 80 years) were
assigned into four groups based on their clinical characteristics. Database is constituted by healthy, hyperten-
sive and subjects that suffer from stenosis. The cross-correlations analysis between groups allows establishing
time parameterizations for each one. Furthermore, the differences between the left and right carotid artery
suggest intrinsically variability for each one of the subjects. The coefficient of variation (CV) mean value
obtained for all measurements was 18.58%, maximum rate of 33.7% and minimum 8.9%. The stenosis case
study demonstrate the potentialities of the use of this prototype in the detection of cardiac anomalies by the
monitoring of state alterations through RP, SP and DN time parameterizations with visible changes in RP and
SP values (after carotid intervention RP appears later than SP, in opposition with values before intervention),
while DN associated time changes little. The tests performed on the ADW showed that is possible the reliable
measurement of morphological patterns changes.
1 INTRODUCTION
The prevention and treatment guidelines of cardio-
vascular disease (CVD) have focused on the modi-
fication of risk factors, such as hypertension, smok-
ing or hyperglycaemia, among others that could po-
tentially reduce cardiac events. Furthermore, the
early non-invasive identification of hemodynamic al-
terations that result from pathological situations can
facilitate much more precise risk stratification.
Arterial walls are the primary site of disease in
arteriosclerotic vascular disease, and their properties
and function are commonly affected by the risk fac-
tors above referred. So, the assessment of wall in-
tegrity can provide an accurate prediction of car-
diovascular (CV) risk (Hamilton et al., 2007). CV
risk assessment can be performed using several risk
tools based upon multi-variable equations. In spite
of the difficulty in absolute risk prediction, they are
extremely useful in assessing or estimating risk, as
well as in prioritising treatments. The most used are
the Framingham (Bitton and Gaziano, 2010) and the
SCORE (Conroy, 2003).
Some factors have been focused by scientific com-
munity due to their relationship with risk occurrences.
The INTERHEART study established the smoking
status, history of hypertension or diabetes, waist hip
ratio, dietary pattern, physical activity, alcohol con-
sumption, blood apolipoproteins and psychosocial
factors collectively accounting for more than 90%
of the risk in the acute myocardial infarction (Yusuf
et al., 2004). Serum total, high density (HDL) choles-
terol and serum triglyceride are used in the most of
risk scores. However, HDL is frequently ignored by
some authors that emphasize its poor sensitivity for
the identification of individuals at high risk (Jones
et al., 2001). Hypertension is also reported as one of
the most important factors, and should not be ignored.
Arterial stiffness is one of the early detectable symp-
toms of adverse structural and functional changes
138
G. Almeida V., Borba J., C. Pereira H., Pereira T., Cardoso J. and Correia C..
Indices and Repeatability Tests of Cardiovascular Function Performed on the Arterial Distension Waveform - Case Study: Angiography Intervention.
DOI: 10.5220/0004219301380144
In Proceedings of the International Conference on Bio-inspired Systems and Signal Processing (BIOSIGNALS-2013), pages 138-144
ISBN: 978-989-8565-36-5
Copyright
c
2013 SCITEPRESS (Science and Technology Publications, Lda.)
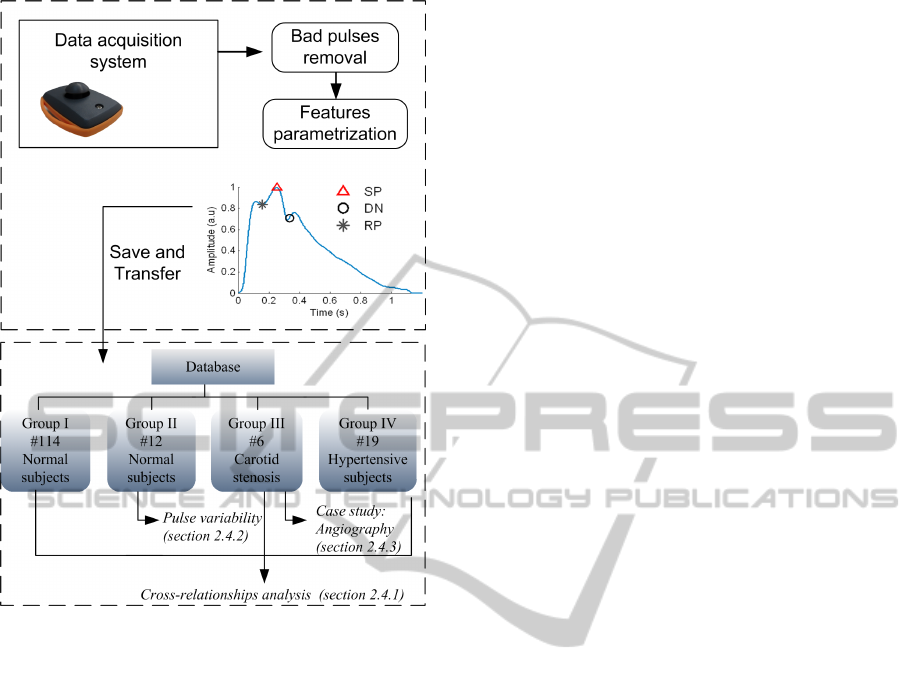
Figure 1: Database groups and signal processing tasks per-
formed for each one.
within the vessel wall (Laurent, 2006). A wide vari-
ety of non-invasive techniques are employed to assess
its development (Cavalcante et al., 2011; Mackenzie
et al., 2002).
The arterial distension waveform (ADW) is an in-
teresting signal that can be used in the analysis of rele-
vant morphological features (Avolio et al., 2010). The
major determinants are systolic peak (SP), reflected
wave (RP) and dicrotic notch (DN) that results from
the aortic valve closure at end of systole. The pres-
ence of branches and tapers in the arterial tree leads
to occurrence of reflection waves that are influenced
by the arterial wall stiffening. The increase of arterial
stiffness leads to early occurrence of RP rather than
SP leading to the augmentation phenomenon. The
augmentation index (AI) is used to quantify this fact,
and is calculated as a percentage of the increment of
pressure to the pulse pressure (Hamilton et al., 2007).
Little is known about the cross-relationships of
these indices in different risk groups. The available
studies compare within the same subject (Huck et al.,
2007) several techniques such as, tonometry, ultra-
sound, Doppler and brachial flow-mediated dilation
(Liang et al., 1998). Furthermore, the analysis of
ADW from different anatomical origins, such as left
and right carotid artery could be interesting in the
analysis of anatomical differences (Luo et al., 2011).
The non-invasive prototype to be tested was devel-
oped in a previous work for distension wave estima-
tion based on piezoelectric (PZ) sensors. A set of pre-
liminary tests were done in flexible tubes and in vol-
unteers to physiological monitoring (Almeida et al.,
2011a; Almeida et al., 2011b). The main focus of this
work is performing a set of clinical tests, as follow:
• Exploration of the cross-correlations between
subjects;
• Perform a set of repeatability tests in successive
measurements and distinguish the differences be-
tween left and right carotid ADW;
• Evaluate the capability of probe in detect mod-
ifications in clinical states by the monitoring of
ADW after and before angiography procedure, us-
ing an invasive method as reference.
The selection and description of primary variables
and groups are issued in section 2. Results are pre-
sented in section 3. Finally, discussion and conclu-
sions are stated in sections 4 and 5, respectively.
2 METHODS
This section describes the dataset and protocol used
during data acquisition. The database details are de-
picted in Figure 1 (below row).
2.1 Subjects
One hundred and fifty one volunteers, 61 male and
90 female, aged between 18 and 80 years were in-
cluded in this study. Subjects were recruited from
Coimbra University Hospital Centre (C.H.U.C.) and
advertisements placed in public platforms calling for
healthy volunteers. Informal consent was obtained af-
ter full explanation of the purpose, nature and risk of
all procedures used. The research was approved by
the Committees of the Coimbra University Hospital
Centre. The database is composed by four indepen-
dent groups, whose demographic data are listed in Ta-
ble 1.
• Group I is composed by 114 normal subjects (be-
tween 18 and 30 years).
• Group II is composed by 12 normal subjects be-
tween 21 and 29 years.
• Group III is composed by 6 subjects that suffer
from severe stenosis.
• Group IV comprises 19 hypertensive subjects.
IndicesandRepeatabilityTestsofCardiovascularFunctionPerformedontheArterialDistensionWaveform-CaseStudy:
AngiographyIntervention
139

Table 1: Demographic data comparison for each one of groups analysed.
Variable Group I Group II Group III Group IV
Age 21.90 ± 3.32 23.50 ± 2.43 72.5 ± 5.44 58.63 ± 12.51
Sex (M/F) 45/69 4/8 4/2 8/11
Smoker (Y/N) 10/104 0/12 M.D.* 2/17
Diabetes (Y/N) 0/114 0/12 M.D.* 2/17
Weight (Kg) 62.46 ± 10.24 59.66 ± 10.96 M.D.* 74.42 ± 10.77
Height(m) 1.69±0.09 1.66±0.06 M.D.* 1.64 ± 0.10
BMI(Kg/m) 21.80 ± 2.59 21.45 ± 2.71 M.D.* 27.81 ± 5.28
SBP(mmHg) 108.78 ± 11.59 105.25 ± 5.86 144.33 ± 40.08 155.42 ± 27.32
DBP(mmHg) 69.52 ± 7.84 65.67 ± 6.71 81 ± 18.34 90.95 ± 17.45
HR(beats/min) 70.11 ± 10.83 71.17 ± 10.64 72.5 ± 3.53 63.79 ± 6.08
Note: Data were expressed in mean±standard deviation (SD)
*M. D. -Missing data
2.2 Protocol
ADWs were recorded at the sampling rate of 1kHz
using a non-invasive PZ probe previously developed
(Almeida et al., 2011b). The probe is placed over
the carotid artery, and is held by a collar to avoid
noise interference and artefacts that may arise from
the interaction between the probe and the operators
hand. Age, sex, weight, height, smoking habits and
diabetes history were registered for each subject. The
Body Mass Index (BMI) was later calculated. Sys-
tolic blood pressure (SBP), diastolic blood pressure
(DBP) and heart rate (HR) values were measured in
the left arm with an automated digital oscillomet-
ric sphygmomanometer (Omron M6 Comfort, Kyoto,
Japan). The following requirements were performed
for each one of groups:
• Group I- One measurement (three trials) was
taken for each subject during 30-40 seconds. The
subjects remained quiet and seated on a comfort-
able chair;
• Group II- For each subjects two successive ses-
sions were monitored. In each session, 3 trials
of 30-40 seconds were performed for each carotid
site (right and left). All measurements were made
in a similar time of the day and at the same tem-
perature controlled room (22-23
◦
Celsius), to min-
imize the climatic variation. The subjects re-
mained quiet and seated on a comfortable chair;
• Group III- These subjects were monitored under
carotid intervention (due to a stenosis that partly
blocks the artery blood flow). The angiography is
the imaging method of choice to visualize it. After
local anesthesia, a surgical cut is executed next to
the groin, and after a filter device is opened above
the lesion, the stent is implanted. The balloon is
then inflated at the stenosis plaque level, decreas-
ing the stenosis after deflation, and the filter de-
vice is kept open as prevention for an eventual em-
bolic trapping. With this surgical technique, the
blood flow was restored to the normal values since
the diameter of the vessel enlarged to the same im-
posed by the stent. The ADW was sequentially
collected by our probe and invasive equipment,
Axiom Sensis (Siemens). Only a small segment
of 3-4 seconds was analyzed.
• Group IV- The data from group IV were ac-
quired during hospitalization. One measurement
(three trials) was taken for each subject during 30-
40 seconds. The subjects were monitored prior
to taking any medication and subjects remained
quiet and seated on a comfortable chair.
2.3 Signal Acquisition and Discrete
Time Signal Processing
Data processing was undertaken in MATLAB 2011b
and statistical analysis was performed using Mi-
crosoft Excel 2010 and SPSS18.0 statistical soft-
ware. The collected data consisted in demographic
and pulse waveform parameters. The overall list of
demographic parameters (expressed as mean±S.D.)
is described in Table 1.
The methodology adopted in the pulse wave anal-
ysis consists in the removal of bad pulses that may re-
sults from voluntary or involuntary movements, such
as respiration. The criteria used to remove these
pulses consisted in the analysis of amplitude and
width abnormal pulse variations. Then, the pulse-
by-pulse analysis was performed, consisting in the
identification of the systolic peak (SP), diastolic notch
(DN) and reflection point (RP) in the ADW, such rep-
resented in Figure 1 (upper row). An algorithm for
prominent points identification was previously devel-
oped (Almeida et al., 2011a) for this task. This algo-
rithm action is based on the analysis a number of fea-
tures of the arterial distension waveform and its first
BIOSIGNALS2013-InternationalConferenceonBio-inspiredSystemsandSignalProcessing
140
derivative. After acquisition, the pulses are subject to
a segmentation process and amplitude normalization
to the diastolic-systolic pressure interval in a manner
to allow a reliable comparison among subjects.
2.4 Data Analysis
2.4.1 Cross-relationships
SP, DN and RP associated time and amplitude was
computed for all of the groups, as well as AI values.
Group I and II are both composed by healthy subjects.
To avoid similar patterns, only Group I was used in
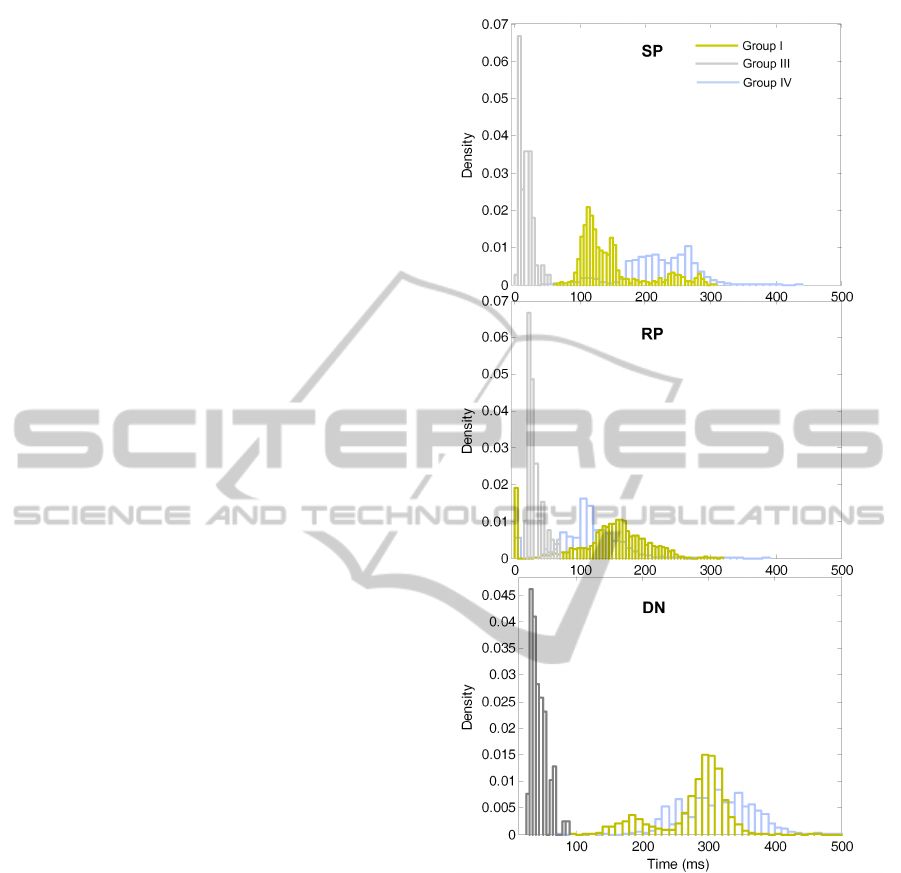
the analysis of cross-relationships. The arrival time
histogram distributions were computed for the Groups
I, III and IV, shown in Figure 2.
2.4.2 Pulse Variability
Group II was used to study of the data repeatability.
The SP, DN and RP associated time and amplitude
information was used for this purpose by the analysis
of successive sessions and comparison of mean values
and standard deviations. Furthermore the coefficient
of variation (CV) within each subject in the same ses-
sion was also computed. The left and right carotid
differences were analysed. The time and amplitude
parameterizations were also studied between left and
right carotid side, as well as the AI values.
2.4.3 Physiological Changes During
Angiography
The waveforms, before and after the procedure were
collected through the invasive and non-invasive de-
vices. However the comparison is only possible
through visual inspection due to the limitations in data
availability of invasive device.
3 RESULTS
3.1 Inter-groups Relationships
Figure 2 shows the arrival time histogram distribu-
tions, between all groups for the SP, DN and RP. SP
occurs later in hypertensive subjects (Group IV) con-
trasting with RP that occurs early in group IV and
later in group I. DN arrival time is similar in groups
I and IV (hypertensive and normal subjects). How-
ever, DN presents a peculiar behaviour characterized
by early time parameterizations in group III. When
the algorithm is not able to identify the prominent
Figure 2: SP, DN, RP cross-relationships between groups I,
II and IV.
points due to morphological artefacts or algorithm er-
rors, a null timing is assumed, that is visible in the
first bin of each histogram.
3.2 Pulse Variability
The pulse variability between sessions was studied for
group II. The results are shown in Table 2, where
for each one of the parameters was computed the
mean ± SD.
Results demonstrate good repeatability obtained
from RP analysis, 168.90 ± 40.12 ms and in ampli-
tude 0.86±0.09 (a.u.) in session I and 166.41 ±34.10
ms and 0.87 ± 0.07 (a.u.) in session II. DN also
IndicesandRepeatabilityTestsofCardiovascularFunctionPerformedontheArterialDistensionWaveform-CaseStudy:
AngiographyIntervention
141
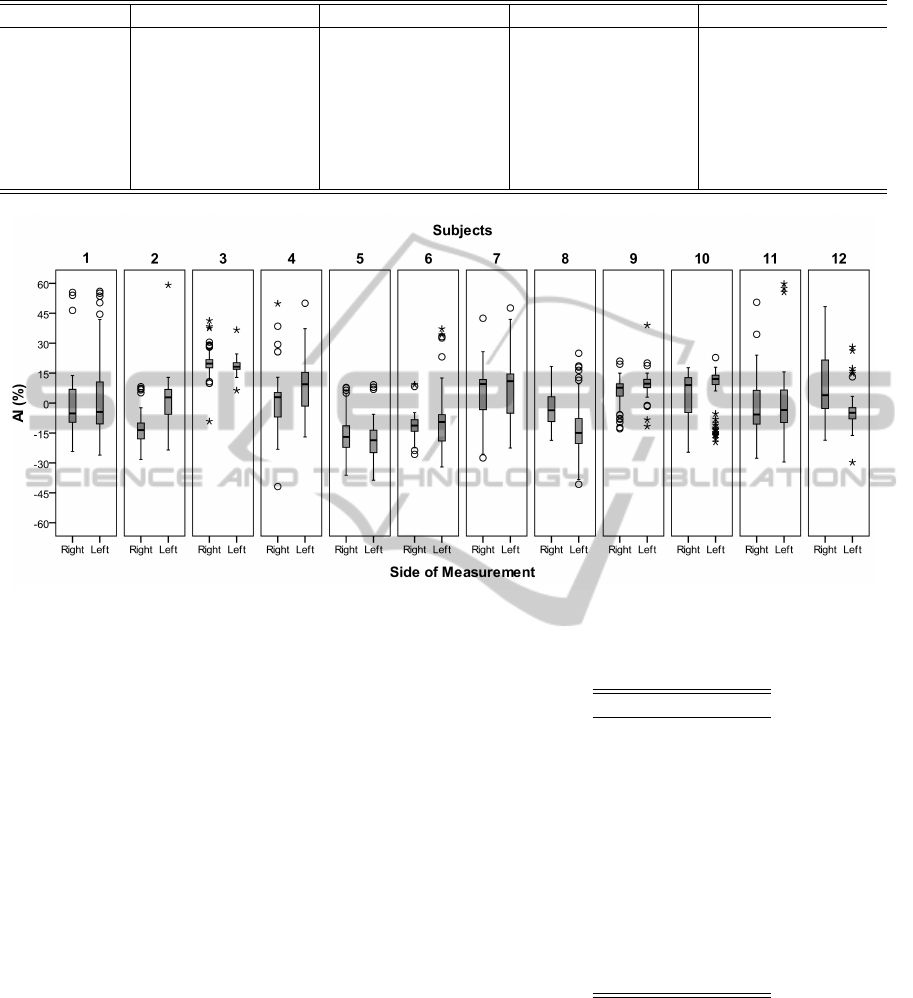
Table 2: Comparison of hemodynamic parameters obtained between sessions and bilateral common carotid acquisitions.
Parameter Session 1 Session 2 Left Right
SP (time(s)) 155.69 ± 58.81 177.74 ± 64.26 163.70 ± 60.51 169.27 ± 64.51
SP (amp(a.u)) 0.99 ± 0.01 0.99 ± 0.01 0.99 ± 0.01 0.99 ± 0.01
DN (time(s)) 285.98 ± 61.72 293.23 ± 39.31 286.96 ± 52.40 292.39 ± 51.98
DN (amp(a.u)) 0.70 ± 0.15 0.72 ± 0.13 0.72 ± ±0.15 0.71 ± 0.14
RP (time(s)) 168.90 ± 40.12 166.41 ± 34.10 169.18 ± 39.48 165.98 ± 34.66
RP (amp(a.u)) 0.86 ± 0.09 0.87 ± 0.07 0.88 ± 0.07 0.86 ± 0.08
AI (%) −2.67 ± 15.94 0.48 ± 13.84 −1.55 ± 14.26 −0.70 ± 15.91
Figure 3: A: AI distribution in function of carotid side of measurement for each one of the subjects.
presents good agreement between time and amplitude
information 285.98 ± 61.72 ms and 0.70±0.15 (a.u.)
in opposition with 293.23 ± 39.31 and 0.72 ± 0.13
(a.u.). SP presents more dispersion in time measure-
ments. Since SP amplitude was previously normal-
ized, during pre-processing, its relevance in the anal-
ysis is negligible.
The CV for each one of the subjects within the
same measurement, independent of the visit and
carotid side were computed. These values suggest in-
trinsically variability that needs to be taking in consid-
eration for each one of the subjects. The CV mean ob-
tained for all measurements was 18.58%, maximum
rate of 33.7% and minimum 8.9%. All of the CV val-
ues are displayed in Table 3. The left-right carotid
differences were also studied. The analysis of time
parameterizations (mean ± SD) is satisfactory, with-
out significant differences, as is presented in Table 2.
Furthermore, for each one of the subjects were plotted
the AI values depending of carotid side of measure-
ment. It is evident AI dispersion for some of the sub-
jects. The less marked differences in AI distribution
are achieved for subjects 3 and 9, which are according
with lowest CV values. The largest differences in AI
and CV values occur for the 12 subject.
Table 3: CV values obtained for each subjects indepen-
dently of session and carotid side of measurement.
Subjects CV (%)
1 26.1
2 14.7
3 8.9
4 33.3
5 9.2
6 17.8
7 14.7
8 21.9
9 11.8
10 13.6
11 17.2
12 33.7
3.3 Angiography Subjects
The ADW comparison between both methods (inva-
sive and non-invasive) is shown in Figure 4. A small
segment (3-4 s) was chosen from each method before
and after carotid intervention. It is possible to note the
physiological alterations in both methods after carotid
intervention. The DN, RP, and SP associated time
BIOSIGNALS2013-InternationalConferenceonBio-inspiredSystemsandSignalProcessing
142
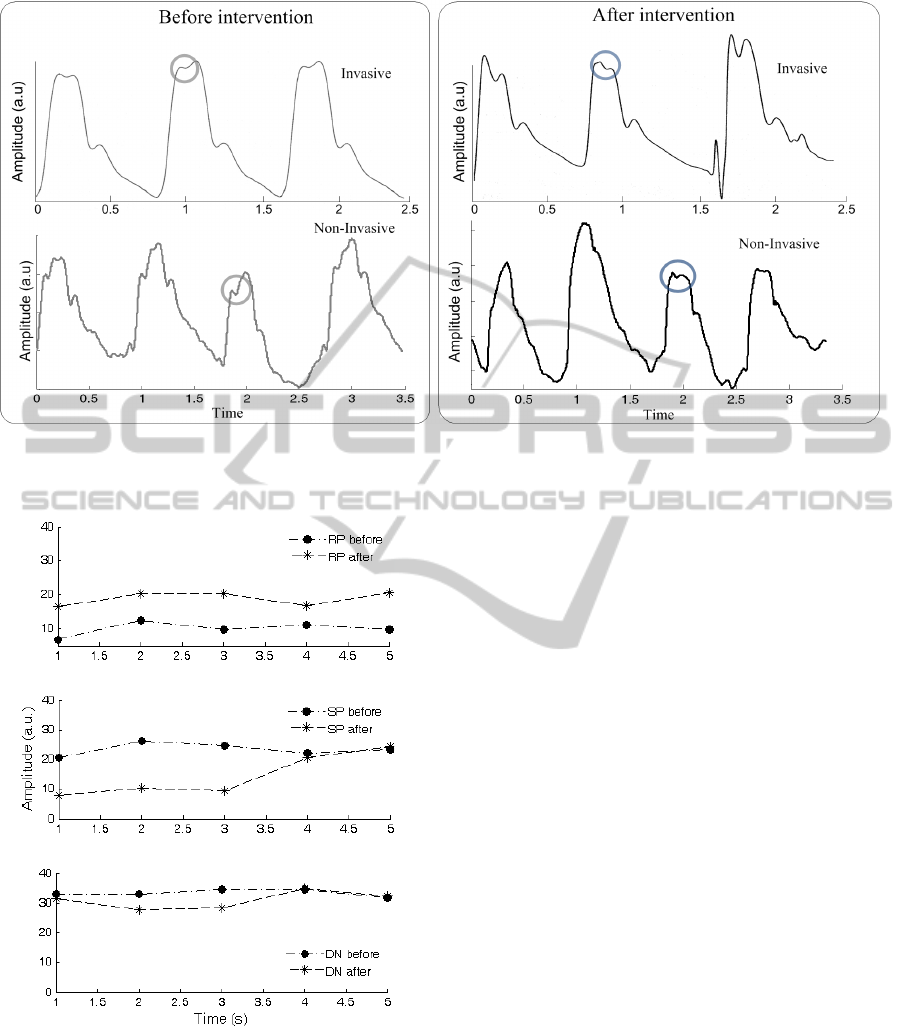
Figure 4: Set of three-four pulses detected invasively and non-invasively after and before carotid intervention. RP arrival time
for each one is represented by gray and blue circles, corresponding respectively to ADW collected before and after carotid
intervention.
Figure 5: SP, RP and DN time parameterization comparison
before and after carotid intervention.
were measured for the non-invasive method before
and after carotid procedure and the data are presented
in Figure 5. DN associated time changed little, as ex-
pected due to the absence of known cardiac valves
complications. However, visible changes occur in the
RP and SP analysis. Before the catheterization pro-
cedure, the RP occurs early, while SP appears later
but after the carotid intervention this tendency was in-
verted leading to the occurrence of normal ADW pat-
terns characteristics from healthy subjects (SP occurs
first, and then RP). This fact seems to indicate that
the anomalous reflection waveform disappeared with
the carotid intervention, as indicated by blue circles in
Figure 4. The main purpose of this case study was to
prove that our probe is able to monitor physiological
alterations, such occurs in stenosis situations.
4 DISCUSSION
The analysis of pulse variability for ADW measure-
ments showed good results. There were no signicant
differences within each pair over the range of mea-
surements for any of the variables. The AI values
observed for each one of the subjects shows differ-
ences in mean value for the subjects (#2, #8, #12), but
correlated with high CV value leads to the assump-
tion that physiological variations are the main cause.
These results are according (Luo et. al., 2011) that
demonstrate that the differences are only significative
after 40/50 years. This is the main limitation of the
present study. Vascular dysfunction of the left and
right carotid arteries is affected by the age, among
other factors. So, left and right carotid signals need
to be further analysed to include different age groups
and correlations with other parameters, such as bio-
chemical parameters.
IndicesandRepeatabilityTestsofCardiovascularFunctionPerformedontheArterialDistensionWaveform-CaseStudy:
AngiographyIntervention
143

5 CONCLUSIONS
The present study investigated the viability of ADW
assessment using a cardiac prototype in a wide num-
ber of subjects, comprising real clinical environment.
The study of different groups during data analysis
demonstrates the ability in different patterns com-
parison for each group. The data variability re-
sults showed good repeatability for the SP, RP and
DN. Therefore, this prototype could be an interest-
ing tool to use in the screening of arterial compli-
cations caused by the arterial stiffness development.
This fact was also proved by the analysis of a stenosis
case study where the clinical alterations were reliably
monitored by our probe.
ACKNOWLEDGEMENTS
Authors acknowledge Fundac¸
˜
ao para a Ci
ˆ
encia e
Tecnologia for funding SFRH/BD/61356/2009 and
PTDC/SAU-BEB/100650/2008, project developed
under the initiative of QREN, funding by UE/FEDER,
through COMPETE-Programa Operacional Factores
de Competitividade. The authors also thanks to Coim-
bra University Hospital Centre (C.H.U.C.) and Dr.
Rui Provid
ˆ
encia, SCDSOS-Sudden Cardiac Death
Screening of Risk factors, for the support in clinical
trials.
REFERENCES
Almeida, V. G., Pereira, H. C., Pereira, T., Figueiras, E.,
Borges, E., Cardoso, J. M. R., and Correia, C. (2011a).
Piezoelectric probe for pressure waveform estimation
in flexible tubes and its application to the cardiovas-
cular system. Sensors and Actuators A: Physical,
169(1):217–226.
Almeida, V. G., Santos, P., Figueiras, E., Borges, E.,
Pereira, T., Pereira, H. C., Cardoso, J. M. R., and
Correia, C. (2011b). Hemodynamic features extrac-
tion from a new arterial pressure waveform probe.
Proceedings of the 3rd International Joint Conference
on Biomedical Engineering Systems and Technologies
(BIOSTEC 2011). Rome, Italy.
Avolio, A. P., Butlin, M., and Walsh, A. (2010). Ar-
terial blood pressure measurement and pulse wave
analysis–their role in enhancing cardiovascular as-
sessment. Physiol Meas, 31(1):R1–47. Avolio, Al-
berto P Butlin, Mark Walsh, Andrew England Physiol
Meas. 2010 Jan;31(1):R1-47. Epub 2009 Nov 26.
Bitton, A. and Gaziano, T. A. (2010). The framing-
ham heart study’s impact on global risk assessment.
Prog Cardiovasc Dis, 53(1):68–78. Bitton, Asaf
Gaziano, Thomas A K01 TW007141-05/TW/FIC
NIH HHS/ K01 TW007141-06/TW/FIC NIH HHS/
T32HP10251/PHS HHS/ Prog Cardiovasc Dis. 2010
Jul-Aug;53(1):68-78.
Cavalcante, J. L., Lima, J. A., Redheuil, A., and Al-
Mallah, M. H. (2011). Aortic stiffness: current un-
derstanding and future directions. J Am Coll Cardiol,
57(14):1511–22. Cavalcante, Joao L Lima, Joao A C
Redheuil, Alban Al-Mallah, Mouaz H J Am Coll Car-
diol. 2011 Apr 5;57(14):1511-22.
Conroy, R. (2003). Estimation of ten-year risk of fatal car-
diovascular disease in europe: the score project. Eur
Heart J, 24(11):987–1003.
Hamilton, P. K., Lockhart, C. J., Quinn, C. E., and
McVeigh, G. E. (2007). Arterial stiffness: clini-
cal relevance, measurement and treatment. Clin Sci
(Lond), 113(4):157–70. Hamilton, Paul K Lockhart,
Christopher J Quinn, Cathy E McVeigh, Gary E Eng-
land London, England : 1979 Clin Sci (Lond). 2007
Aug;113(4):157-70.
Huck, C. J., Bronas, U. G., Williamson, E., Draheim, C.,
Duprez, D. A., and Dengel, D. R. (2007). Noninvasive
measurements of arterial stiffness: Repeatability and
interrelationships with endothelial function and arte-
rial morphology measures. Vascular health and risk
management, 3(3):343–349.
Jones, A. F., Walker, J., Jewkes, C., Game, F. L., Bartlett,
W., Marshall, T., and Bayly, G. R. (2001). Compar-
ative accuracy of cardiovascular risk prediction meth-
ods in primary care patients. Heart, 85:37–43.
Laurent, S., e. a. (2006). Expert consensus document on ar-
terial stiffness:methodological issues and clinical ap-
plications. European Heart Journal, 27:25882605.
Liang, Y., Teede, H., Kotsopoulos, D., Shiel, L., Cameron,
J., Dart, A., and McGrath, B. (1998). Non-invasive
measurements of arterial structure and function: re-
peatability, interrelationships and trial sample size.
Clinical Science, 95:669–679.
Luo, X., Yang, Y., Cao, T., and Li, Z. (2011). Differences
in left and right carotid intima-media thickness and
the associated risk factors. Clin Radiol, 66(5):393–8.
Luo, X Yang, Y Cao, T Li, Z England Clin Radiol.
2011 May;66(5):393-8. Epub 2011 Feb 15.
Mackenzie, I. S., Wilkinson, I. B., and Cockroft, J. R.
(2002). Assessment of arterial stiffness in clinical
practice. Q J Med., 95:67–74.
Yusuf, S., Hawken, S., unpuu, S., Dans, T., Avezum, A.,
Lanas, F., McQueen, M., Budaj, A., Pais, P., Varigos,
J., and Lisheng, L. (2004). Effect of potentially mod-
ifiable risk factors associated with myocardial infarc-
tion in 52 countries (the interheart study): case-control
study. The Lancet, 364(9438):937–952.
BIOSIGNALS2013-InternationalConferenceonBio-inspiredSystemsandSignalProcessing
144
