
Evidence Accumulation Approach applied to EEG Analysis
Helena Aidos, Carlos Carreiras, Hugo Silva and Ana Fred
Instituto de Telecomunicac¸
˜
oes, Instituto Superior T
´
ecnico, Lisbon, Portugal
Keywords:
EEG, ICA, EMD, Phase-locking Factor, Clustering Ensembles.
Abstract:
Human-machine interaction is a rapidly expanding field which benefits from automatic emotion recognition.
Therefore, methods that can automatically detect the emotional state of a person are important for this field,
as well as for fields such as psychology and psychiatry. This paper proposes the use of clustering ensembles
(CEs) to achieve such detection. We use CEs on a dataset containing EEG signals from subjects who per-
formed a stress-inducing task. From the raw EEG data we apply filtering and processing techniques leading to
three dataset types: simple EEG, EEG with eye-movement artifacts removed through Independent Component
Analysis, and data-driven modes extracted using Empirical Mode Decomposition. Then, for each of these
three data types, we compute band power features and phase-locking factors, yielding a total of six different
feature spaces. These spaces are then analyzed using the CE framework which combines results of multiple
clustering algorithms in a voting scheme. This procedure yields interesting clusters, in particular a natural
tendency for finding low numbers of clusters per subject and finding clusters which are composed of consec-
utive test lines. These two facts combined may indicate that a change in the emotional state of the subject was
detected by the proposed framework.
1 INTRODUCTION
There are hundreds of clustering algorithms, han-
dling differently issues such as cluster shape, density,
noise, among others (Jain et al., 1999; Theodoridis
and Koutroumbas, 2009). Examples of application in-
clude bioinformatics, market research, and medicine.
However, the simple use of a clustering algorithm
like k-means can give a diversity of solutions over the
same dataset depending of the initialization, or of the
chosen k. Recently, an approach known as Cluster-
ing Ensemble (CE) has been proposed, taking advan-
tage of that diversity of solutions (Fred, 2001; Strehl
and Ghosh, 2002; Kuncheva and Hadjitodorov, 2004;
Ayad and Kamel, 2005). CEs can be generated from
different clustering algorithms or algorithmic param-
eters over data. CEs have been applied to various
domains including image segmentation, bioinformat-
ics, document clustering, among several others (Vega-
Pons and Ruiz-Shulcloper, 2011).
In this paper, we analyze electroencephalogram
(EEG) data using the CE framework. This EEG data
was acquired from subjects performing a stressful
task, which requires high concentration levels over a
long time. This design mimics what may occur during
interactive educational tasks, where detecting when a
subject is growing tired would be useful.
Typical pre-processing of EEG signals usually in-
volves the extraction of band power features (BPFs),
since brain activity measured on the scalp exhibits os-
cillatory dynamics which are modulated by neurolog-
ical tasks (Pfurtscheller and Lopes da Silva, 1999).
As an example, a phenomenon called Event-Related
Desynchronization, which involves a decrease of the
EEG power in the motor cortex, usually occurs during
movement preparation (Pfurtscheller and Lopes da
Silva, 1999). A disadvantage of BPFs is that they
require a priori selection of the frequency bands,
which may not be constant between subjects. Alter-
natively, the Phase-Locking Factor (PLF) method has
been proposed in the area of Brain-Computer Inter-
faces (Carreiras et al., 2012); we apply this method
here in the context of emotion analysis.
This paper is organized as follows: Section 2 de-
scribes the acquisition of the EEG signals. Section
3 details the proposed methodology, which has three
main stages: signal processing (3.1), feature extrac-
tion (3.2) and clustering ensembles (3.3). Section 4
presents the results of this methodology on the EEG
data. Section 5 presents concluding remarks.
479
Aidos H., Carreiras C., Silva H. and Fred A. (2013).
Evidence Accumulation Approach applied to EEG Analysis.
In Proceedings of the 2nd International Conference on Pattern Recognition Applications and Methods, pages 479-484
DOI: 10.5220/0004267804790484
Copyright
c
SciTePress
2 EMOTION ELICITATION AND
DATA ACQUISITION
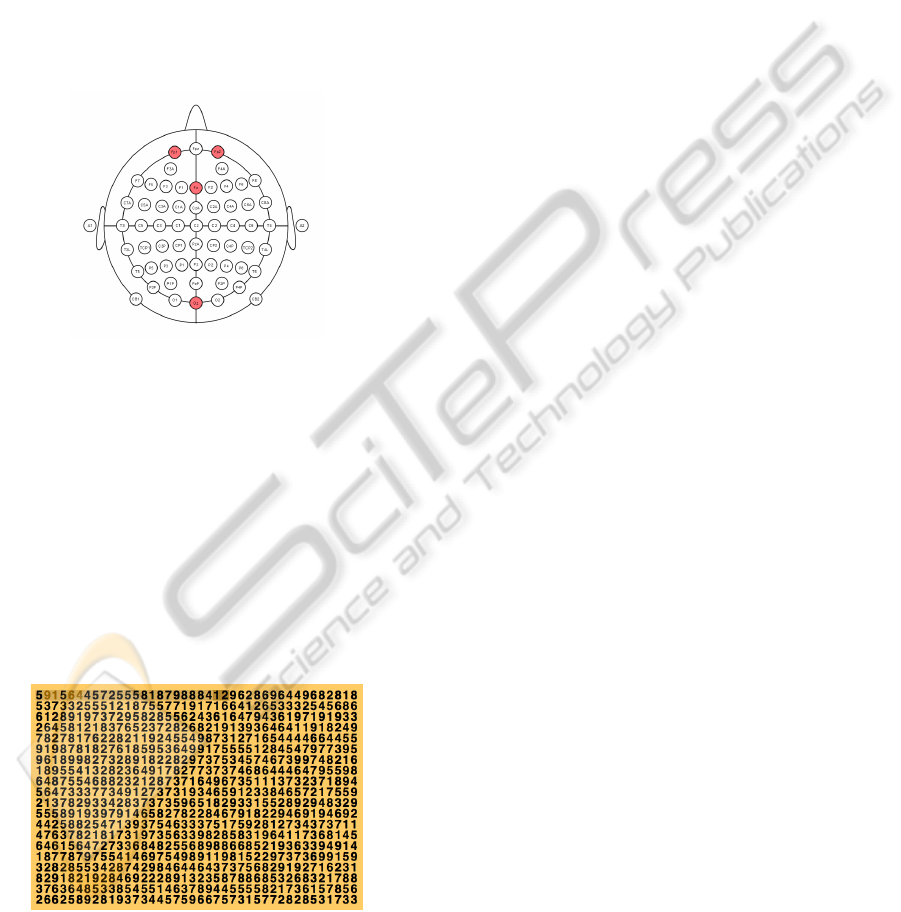
The EEG signals used throughout this work were ac-
quired in the context of HiMotion (Gamboa et al.,
2007), a project whose goal was to obtain informa-
tion related to human-computer interaction and phys-
iological signals on different cognitive activities. Sig-
nals were obtained at four scalp positions, according
to the 10-20 system (F
p1
, F
z
, F
p2
, and O
z
– see Fig-
ure 1), at a sampling rate of 256 Hz. The data was
acquired from 24 subjects (17 males and 7 females)
with ages in the range of 23.3 ±2.4 years.
Figure 1: Electrodes placement used in our setup (red).
During data acquisition, subjects were instructed
to perform several cognitive tasks. One of these tasks,
a concentration task, was inspired by a test from the
MENSA set (Fulton, 2000). The person is presented
with a screen containing a matrix with 20 rows and 40
columns of integers. The goal is to identify pairs of
consecutive numbers which sum to 10 (see Figure 2).
This task is cognitively challenging, since the same
number may be used to form two pairs; thus, the test
assesses the ability of the person to maintain concen-
tration over long periods of time, an activity which is
expected to induce stress.
Figure 2: A matrix of the concentration test; the user selects,
line by line, the pairs of consecutive numbers that add to 10.
3 THE PROPOSED
METHODOLOGY
To analyze the EEG signals described in the previous
section, we propose the methodology shown in Fig-
ure 3. We start with a filtering step, followed by a de-
noising process using independent component analy-
sis (ICA) and empirical mode decomposition (EMD).
Then, we perform feature extraction using two differ-
ent measures: band-power features (BPF) and phase-
locking factor (PLF). Finally, we use the CE frame-
work on these features and analyze the results to de-
tect changes in the emotional state. We explain each
of these steps in detail in the following subsections.
3.1 Signal Processing
To eliminate noise from non-physiological sources,
such as power-line noise and baseline wander, the raw
EEG was processed with two Butterworth filters, each
applied on a forward pass and then a backward pass
(to avoid distortions in the phase of the signals). The
first filter is a high-pass filter of order 8 with cutoff
frequency at 4 Hz, while the second one is a low-pass
filter of order 16, with cutoff at 40 Hz. Three distinct
methods were used to create features: in the first, we
apply no further processing and use the filtered EEG
directly; we call this the EEG-only approach. In the
second method, we apply Independent Component
Analysis (ICA) to remove eye-movement artifacts;
we call this method EEG-ICA. In the third method,
we apply Empirical Mode Decomposition (EMD), a
method which analyzes non-stationary and non-linear
data; this approach is denoted as EEG-EMD.
3.1.1 Independent Component Analysis
We now introduce Independent Component Analy-
sis (ICA), a method to solve blind source separation
problems (BSS). Let X = [X
1
, ..., X
M
]
T
(M being the
number of signals) be the observed data produced
by a linear mixture X = AS of some source signals
S = [S
1
, ..., S
N
]
T
(N being the number of sources),
where A is an M ×N matrix.
The goal of the BSS problem is to find the sources
S and the mixing matrix A, using only the observed
signals X. One way to do so is ICA, which assumes
that S
1
, S
2
, . . . , S
N
are statistically independent. The
ICA methods estimate the sources by optimizing a
measure of their independence (which depends on the
particular ICA algorithm), yielding sources that are
maximally independent (Hyv
¨
arinen et al., 2001).
ICA has been used effectively to separate mean-
ingful neural activity from artifacts due to muscle
ICPRAM2013-InternationalConferenceonPatternRecognitionApplicationsandMethods
480

Figure 3: Outline of the proposed methodology.
contractions and eye blinks in EEG data (Jung et al.,
2000). In this paper, we used FastICA (Hyv
¨
arinen
et al., 2001) to decompose the EEG into independent
components. Then, one of the four retrieved compo-
nents was manually selected as the one which best
isolated eye artifacts; this component was discarded
and the EEG was reconstructed without that compo-
nent. An example of the original EEG signal, its ICA
decomposition and reconstruction without the noisy
component can be seen in Figure 4.
3.1.2 Empirical Mode Decomposition
Empirical Mode Decomposition decomposes a signal
into a sequence of oscillatory-like components called
Intrinsic Mode Functions (IMFs), using a sifting pro-
cess (Huang et al., 1998). It is a data-driven method:
it estimates two envelopes, one bounding the signal
from above and one from below, by interpolating the
local maxima and minima of the signal; it then com-
putes the mean of these two envelopes as a running
average of the signal and subtracts it from the signal,
thus leaving a deviation from this running average.
This process is then restarted, using the deviation as
a new input signal, and so on. In this way, one can
extract a sequence of IMFs from the original signal.
In this paper, each EEG signal was decomposed
with the EMD method, selecting the IMFs with mean
energy above 5% of the maximum energy. The result-
ing components were treated as EEG-like signals for
the subsequent processing steps.
3.2 Feature Extraction
The features used in this work come from two ways
of evaluating brain activity. The first method uses
band power features (BPF), where we compute the
average power in multiple frequency bands (Section
3.2.1). The second approach uses the Phase-Locking
Factor (PLF – Section 3.2.2), which is a measure of
synchrony. One of the difficulties in the analysis of
signals resulting from a continuously interactive ex-
periment, such as the one being analyzed here, is the
fact that different subjects will finish the task in dif-
ferent time intervals. In our case, there is variability
in the time each subject takes to conclude each line of
the concentration test, and thus, in the total length of
the task. For this reason, we used a gradient estima-
tion to evaluate the trend of each type of features (BPF
and PLF) over time, obtaining a value for each line of
the matrix in the concentration test (Section 3.2.3).
It is important to highlight that each of the pre-
processing methods (EEG-only, EEG-ICA and EEG-
EMD) was analyzed with both kinds of features (BPF
and PLF), resulting in 6 different sets of features. For
clarity, we denote each set by the combination of the
two respective names. For instance, the feature set
“EEG-ICA-PLF” was obtained by extracting the PLF
features from the EEG preprocessed with ICA.
3.2.1 Band Power Features
We consider the following bands in the Band Power
Features approach: Theta (4-8 Hz); Lower Alpha (8-
10 Hz); Upper Alpha (10-13 Hz); Beta (13-25 Hz);
Gamma (25-40 Hz). For each channel, we extracted
the features by computing a short-time Fourier trans-
form in windows of 500 ms, with 50% overlap. The
windowed signal was completed with zeros up to
1024 samples. The power in each band was computed
by averaging the spectrum in that band. An order 5
median filter was then applied to the resulting signals.
3.2.2 Phase-locking Factor
Given two oscillators i and k with time-dependent
phases ϕ
i
[n] and ϕ
k
[n], n = 1, ..., T (with T the num-
ber of discrete time samples), the PLF is defined as
(Almeida et al., 2011):
EvidenceAccumulationApproachappliedtoEEGAnalysis
481
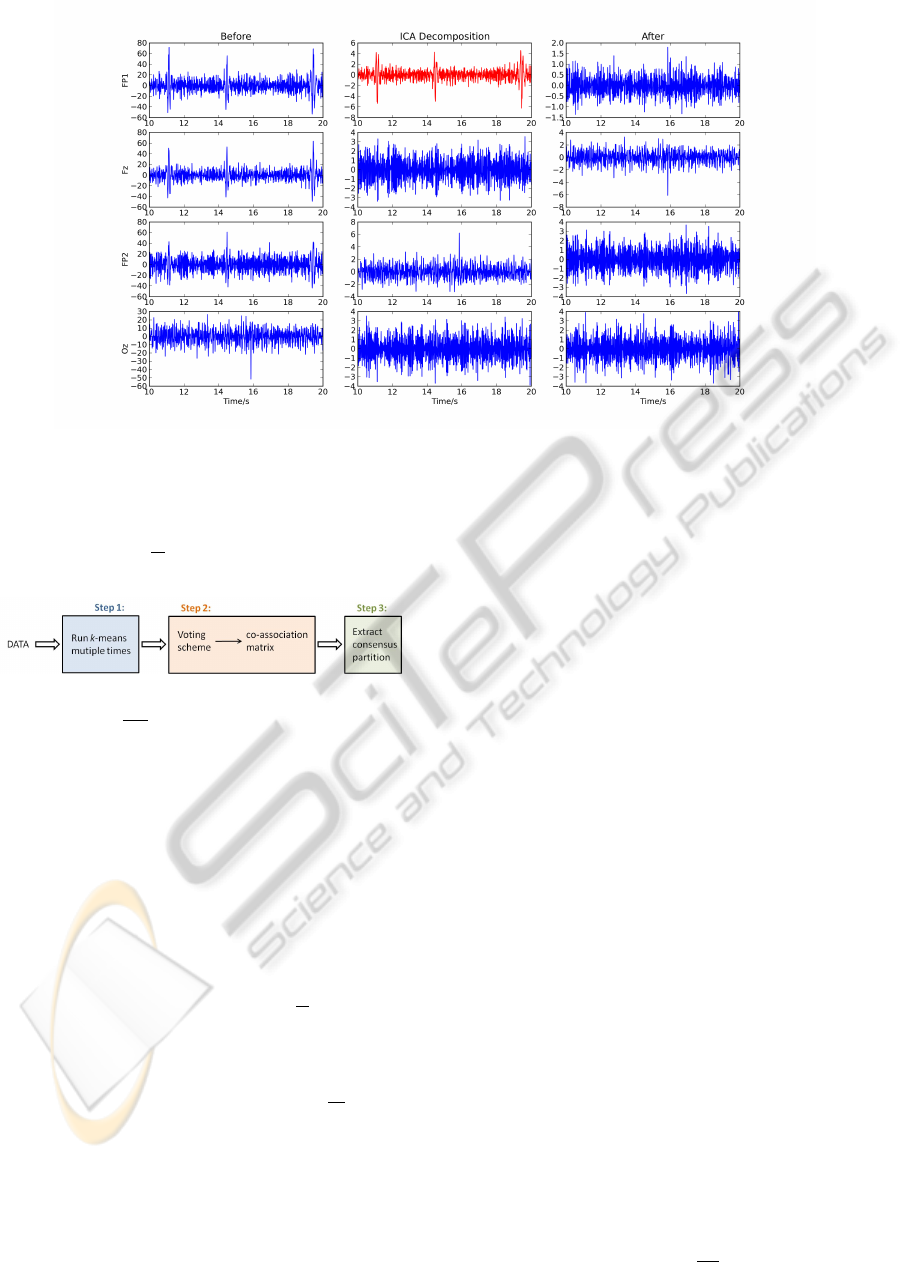
Figure 4: Example of applying the ICA method to remove eye-movement artifacts from the EEG; the left column shows the
four original EEG channels, where the spikes are ocular artifacts; the middle column shows the ICA decomposition, with
removed component in red; and the right column presents the reconstructed EEG.
ρ
ik
=
1
T
T
∑
n=1
e
j(ϕ
i
[n]−ϕ
k
[n])
, (1)
Figure 5: Outline of the evidence accumulation framework.
where j =
√
−1 is the imaginary unit. This mea-
sure ranges from 0 to 1. While the value ρ
ik
= 1 cor-
responds to perfect synchronization between the two
signals (constant phase lag), the value ρ
ik
= 0 corre-
sponds to no synchronization. Put simply, the PLF
measures whether the phase lags of some pair of os-
cillators are strongly or weakly clustered around some
angle in the complex unit circle. In this work, phase
information is extracted from the EEG signals (which
are real-valued) through the use of analytical signals,
which are obtained by applying the Hilbert transform
to the EEG signals. Given a real signal x(t), its Hilbert
transform is defined as H
t
{x}= x(t)∗
1
πt
, where ∗ de-
notes the convolution operator; the corresponding an-
alytical signal z(t) is then obtained as:
z(t) = x(t) + jH
t
{x} = x(t) + j
[
x(t) ∗
1
πt
]
. (2)
The PLF was computed, for all possible electrode
pairs, in windows of 250 ms, with 50% overlap. An
order 5 median filter was then applied.
3.2.3 Gradient Estimation
In order to estimate the trend of the feature sets over
time, a straight line was fitted to each line k = 1, ..., 20
of the concentration task (with T (k) duration), esti-
mating the gradient G(k) of that line. The evolution
of the features, from the initial state, over the lines is
then given by D(k) = D(k −1) + G(k) ×T(k), with
D(0) = 0.
3.3 Evidence Accumulation Clustering
Consider X = {x
1
, x
2
, . . . , x
n
} a set of n objects. A
clustering ensemble, P, is a set of N different parti-
tions of the data X , where each partition is the output
of a clustering algorithm:
P = {P
1
, P
2
, . . . , P
N
} (3)
P
1
=
{
C
1
1
, C
1
2
, . . . , C
1
k
1
}
.
.
.
P
N
=
{
C
N
1
, C
N
2
, . . . , C
N
k
N
}
,
where C
i
j
is the jth cluster in data partition P
i
, which
has k
i
clusters, and n
i
j
is the cardinality of C
i
j
, with
∑
k
i
j=1
n
i
j
= n, i = 1, . . . , N.
(Fred and Jain, 2005) proposed a voting scheme
to combine all the different partitions, under the evi-
dence accumulation framework. This voting scheme
leads to a pairwise relationships matrix, called “co-
association matrix”:
C (i, j) =
n
i j
N
, (4)
ICPRAM2013-InternationalConferenceonPatternRecognitionApplicationsandMethods
482
test lines
subjects
BPF −− AL
2 4 6 8 10 12 14 16 18 20
5
10
15
20
test lines
subjects
BPF −− WL
2 4 6 8 10 12 14 16 18 20
5
10
15
20
test lines
subjects
PLF −− AL
2 4 6 8 10 12 14 16 18 20
5
10
15
20
test lines
subjects
PLF −− WL
2 4 6 8 10 12 14 16 18 20
5
10
15
20
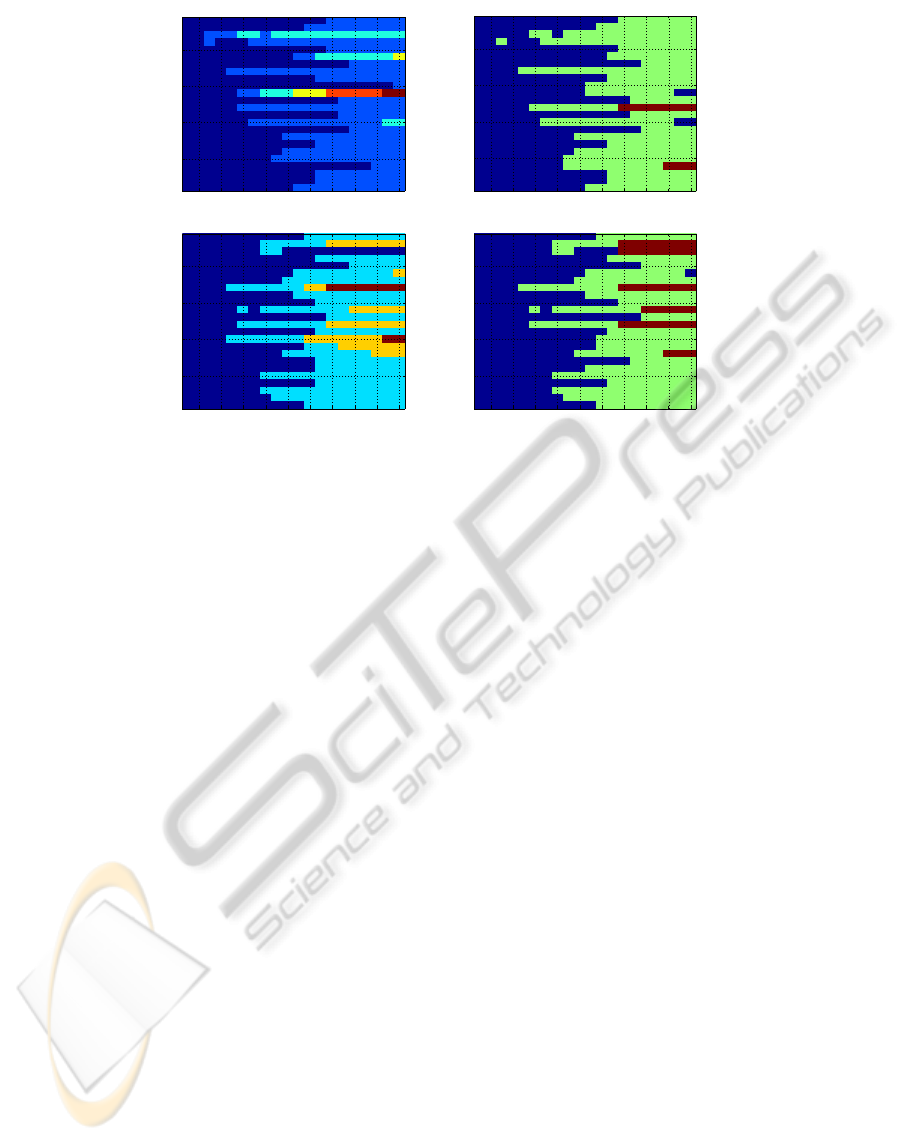
Figure 6: Each of the four subfigures represents one of the combinations of feature type (BPF or PLF) and clustering algorithm
(AL or WL). Within each subfigure, each row represents one subject, and each column one of the test lines of the matrix in
the concentration test. Each different color corresponds to a distinct cluster.
where n
i j
is the number of times the pattern pair (i, j)
is assigned to the same cluster among the N partitions.
According to (Fred and Jain, 2005), the evidence
accumulation approach is a three-step cluster ensem-
ble method (illustrated in figure 5):
Step 1: build the clustering ensemble (CE);
Step 2: combine evidence in the CE, mapping it into
a co-association matrix;
Step 3: extract the consensus partition by applying a
clustering method over the co-association matrix.
In order to produce the clustering ensembles, we
perform 100 runs of k-means with k randomly chosen
from the set {2, 3, 4} for each feature space mentioned
previously. We combined in a co-association matrix
the 300 partitions using BPF and in a different co-
association matrix the 300 partitions using PLF. After
that we extract the consensus partition over each co-
association matrix by applying two hierarchical clus-
tering algorithms: average-link (AL) and Ward’s link-
age (WL). The final number of clusters is found using
the largest lifetime criterion (Fred and Jain, 2002).
4 EXPERIMENTAL RESULTS
AND DISCUSSION
The results of the previously described methodology
are presented in Figure 6, from which one can draw
some interesting conclusions. For example, the re-
sults of the two clustering algorithms are usually very
close: in one of the cases, subjects 1, 2, 7, 8 and
many others get exactly the same clustering from the
BPF features, regardless of the choice of clustering
algorithm. This confers some strength in the clusters
which are found, since they are detected by two dif-
ferent algorithms. However, WL always finds 2 or
3 clusters, whereas AL occasionally finds 4 or more;
this may suggest that WL is a better algorithm to use
for emotion state change, as discussed below.
Going into the finer details, subject 11 was found
to have 6 clusters by AL on the BPF features, but only
2 or 3 on the remaining three configurations. This
suggests that subject 11 could be an outlier for some
reason, such as improper experimental setup or inabil-
ity to understand the instructions or to fulfill the task.
However, the most striking conclusion is that, in
general, two clusters are found for each subject, and
each cluster is usually composed of consecutive test
lines. In other words, each cluster represents a single
time interval. This can be interpreted as a detection of
a change in the emotional state of the subject during
the task, for example due to difficulty in maintaining
appropriate concentration levels which could lead to
feelings of tiredness, frustration, or stress.
To assess whether this detection of emotional state
change is correct or not, one would need data which
contains ground truth information about the emo-
tional state of each subject. One possibility is to ask
subjects directly to indicate their self-assessed con-
centration level, for example at the end of each line.
Another possibility is to use the time it took the sub-
ject to complete the task as a proxy for his/her concen-
EvidenceAccumulationApproachappliedtoEEGAnalysis
483

tration level: it is intuitive that lines which took longer
to finish did so because the subject was maintaining a
lower concentration level. A third possibility is to use
lines of different difficulty (with harder lines having
more pairs of numbers to be indicated), and assume
that harder lines will induce more stress. Acquisition
of data with this type of external information, and its
subsequent analysis using the methodology proposed
here, will be the subject of future work.
5 CONCLUSIONS
We presented a methodology for exploratory data
analysis of EEG data acquired while subjects per-
formed a task which demands high concentration lev-
els. We preprocessed the data using bandpass filter-
ing, independent component analysis (ICA) and em-
pirical mode decomposition (EMD); we then used
two different measures: band power features (BPF)
and phase-locking factor (PLF), which measure en-
ergy in typical EEG bands and phase synchrony
across pairs of channels, respectively. Finally, we
used the clustering ensembles framework to extract
relevant information from those features.
The main conclusion is the finding of few clus-
ters per subject and per test line (usually 2 or 3; 4 or
more clusters are rare), and the fact that these clus-
ters are almost always composed of a single time in-
terval. These findings suggest that this methodology
may be detecting a transition in the brain activity of
the subject, which could be caused by a change in the
emotional state due to tiredness or stress.
ACKNOWLEDGEMENTS
This work was supported by the Portuguese Founda-
tion for Science and Technology grants PTDC/EIA-
CCO/103230/2008 and SFRH/BD/65248/2009.
REFERENCES
Almeida, M., Schleimer, J.-H., Vig
´
ario, R., and Bioucas-
Dias, J. (2011). Source separation and clustering of
phase-locked subspaces. IEEE Transactions on Neu-
ral Networks, 22:1419–1434.
Ayad, H. G. and Kamel, M. S. (2005). Cluster-based cumu-
lative ensembles. In Proc. Int. Workshop on Multiple
Classifier Systems.
Carreiras, C., de Almeida, L. B., and Sanches, J. M.
(2012). Phase-locking factor in a motor imagery
brain-computer interface. In Eng. in Medicine and
Biology Society, 2012. 34th Annual Int. Conf. of the
IEEE.
Fred, A. (2001). Finding consistent clusters in data parti-
tions. In Proc. Int. Workshop on Multiple Classifier
Systems, pages 309–318.
Fred, A. and Jain, A. (2005). Combining multiple clus-
terings using evidence accumulation. IEEE Transac-
tions on Pattern Analysis and Machine Intelligence,
27(6):835–850.
Fred, A. and Jain, A.K. (2002). Evidence Accumulation
Clustering based on the K-Means Algorithm. In Proc.
Joint IAPR Int. Workshop on Structural, Syntactic and
Statistical Pattern Recognition, pages 442–451.
Fulton, J. (2000). The Mensa Book of Total Genius. Carlton
Books.
Gamboa, H., Silva, H., and Fred, A. (2007). HiMotion
project. Technical report, Instituto Superior T
´
ecnico,
Lisbon, Portugal.
Huang, N., Shen, Z., Long, S., Wu, M., Shih, H., Zheng,
Q., Yen, N., Tung, C., and Liu, H. (1998). The em-
pirical mode decomposition and the hilbert spectrum
for nonlinear and non-stationary time series analysis.
Proc. Royal Society of London. Series A: Mathemati-
cal, Physical and Eng. Sciences, 454(1998):903–995.
Hyv
¨
arinen, A., Karhunen, J., and Oja, E. (2001). In-
dependent component analysis, volume 26. Wiley-
interscience.
Jain, A. K., Murty, M. N., and Flynn, P. J. (1999). Data
clustering: a review. ACM Computing Surveys,
31(3):264–323.
Jung, T., Makeig, S., Westerfield, M., Townsend, J.,
Courchesne, E., and Sejnowski, T. (2000). Removal
of eye activity artifacts from visual event-related po-
tentials in normal and clinical subjects. Clinical Neu-
rophysiology, 111(10):1745–1758.
Kuncheva, L. I. and Hadjitodorov, S. T. (2004). Using di-
versity in cluster ensembles. In Proc. Int. Conf. on
Systems, Man and Cybernetics, pages 1214–1219.
Pfurtscheller, G. and Lopes da Silva, F. H. (1999). Event-
related EEG/MEG synchronization and desynchro-
nization: basic principles. Clinical Neurophysiology,
110:1842 – 1857.
Strehl, A. and Ghosh, J. (2002). Cluster ensembles - a
knowledge reuse framework for combining multiple
partitions. Journal of Machine Learning Research,
3:583–617.
Theodoridis, S. and Koutroumbas, K. (2009). Pattern
Recognition. Elsevier Academic Press, 4th edition.
Vega-Pons, S. and Ruiz-Shulcloper, J. (2011). A survey of
clustering ensemble algorithms. Int. Journal of Patt.
Recog. and Artificial Intelligence, 25(3):337–372.
ICPRAM2013-InternationalConferenceonPatternRecognitionApplicationsandMethods
484
