
Using Visual Attention in a CBIR System
Experimental Results on Landmark and Object Recognition Tasks
Franco Alberto Cardillo, Giuseppe Amato and Fabrizio Falchi
Istituto di Scienza e Tecnologie dell’Informazione, Consiglio Nazionale delle Ricerche, Pisa, Italy
Keywords:
Biologically-Inspired Vision, Visual Attention, Visual Saliency, Landmark Recognition, Object Recognition,
Content-based Image Retrieval.
Abstract:
Many novel applications in the field of object recognition and pose estimation have been built relying on
local invariant features extracted from key points that rely on high-contrast regions of the images. The visual
saliency of the those regions is not considered by state-of-the art detection algorithms that assume the user
is interested in the whole image. In this paper we present the experimental results of the application of a
biologically-inspired model of visual attention to the problem of local feature selection in landmark and object
recognition tasks. The results show that the approach improves the accuracy of the classifier in the object
recognition task and preserves a good accuracy in the landmark recognition task.
1 INTRODUCTION
Given an image as query, a Content-Based Image Re-
trieval (CBIR) system returns a list of images ranked
according to their visual similarity with the query im-
age. The ranking is based on a comparison among
the visual features extracted from the query image and
from the images stored in the index. Many CBIR sys-
tems support general visual similarity searches based
on global features, such as color and edge histograms.
The adoption of descriptions based on local features
(e.g., SIFT and SURF) provided multimedia informa-
tion systems with the possibility to build applications
able to exploit local image similarities. The number
of local visual features extracted from cluttered, real-
world images is usually in the order of thousands.
When the number is ‘too’ large, the overall perfor-
mance of the CBIR system may decline, and, if too
many features are extracted from irrelevant regions,
the matching accuracy may decline. The reduction of
the number of visual features used in the image de-
scriptions can thus be considered a central point in
reaching a good overall performance in a CBIR sys-
tem. In this work we present an approach concerning
the application of a biologically-inspired visual atten-
tion model for filtering out a subset of the features ex-
tracted from an image. The basic assumption of our
experimental work is that the user selects the query
image according to its most salient areas. In order to
assess quantitatively the performance of the approach,
we tested it on a landmark recognition task and an
object recognition task using two publicly available
datasets. The results show that the feature filtering
based on the image saliency is able to drastically re-
duce the number of keypoints with an improvement
or just a slightly decrease in the accuracy of the clas-
sifier in, respectively, the object recognition task and
the landmark recognition task.
2 PREVIOUS WORKS
(Marques et al., 2007) proposes a segmentation
method that exploits visual attention in selecting re-
gions of interest in a CBIR dataset to be used in the
similarity computation. The salient regions are used
to segment the image with a region growing approach.
They compute the visual saliency using the model
in (Itti et al., 1998), while another visual attention
model, the Stentiford’s, is used to guide the segmen-
tation step. They experimented their methods on a
dataset containing 110 images of road signs, red soda
cans, and emergency triangles. Since that dataset is
well known and used in other published experimenta-
tions, we used it in order to test our filtering approach.
(Gao and Yang, 2011) propose a method for filter-
ing SIFT keypoints using saliency maps. The authors
use two different algorithms for computing the im-
age saliency, the Itti-Koch model (for local-contrast
analysis) and a frequency-based method (for global-
468
Cardillo F., Amato G. and Falchi F..
Using Visual Attention in a CBIR System - Experimental Results on Landmark and Object Recognition Tasks.
DOI: 10.5220/0004299404680471
In Proceedings of the International Conference on Computer Vision Theory and Applications (VISAPP-2013), pages 468-471
ISBN: 978-989-8565-47-1
Copyright
c
2013 SCITEPRESS (Science and Technology Publications, Lda.)

contrast analysis) (Hou and Zhang, 2007). The fi-
nal saliency, corresponding to the sum of the saliency
maps computed by the two methods, is used to start
a segmentation algorithm based on fuzzy growing.
They experimented their method on a dataset com-
posed by 10 classes with more than 10 images per
class, extracted from the ALOI image dataset and the
Caltech 256 photo gallery. The authors show that
their method has a precision that is lower than stan-
dard SIFT and comparable to PCA-SIFT, but that it is
also much faster, making it suitable for use in CBIR
systems.
3 BIOLOGICAL INSPIRATION
When we open our eyes we see a colorful and mean-
ingful three-dimensional world surrounding us. Such
visual experience results from a sequence of trans-
formations performed on the light stimuli that starts
in our eyes. The light is focused on the retinal sur-
face, then processed and transferred to our thalamus,
and finally routed to the cerebral cortex. Earlier com-
putational steps extract basic and non-structured fea-
tures, while later steps are able to compute complex
features, such as, for example, lines at various ori-
entations or different color layouts using a center-
surround receptive field. However, the amount of in-
formation contained in the patterns of neural activity
is still too large for our brain to process in a reason-
able amount of time. Evolution has thus endowed hu-
mans with a series of attentional filters able to reduce
the incoming information.
Several psychological theories have been pro-
posed to explain how a unitary visual perception can
arise from distinct computational flows filtered by vi-
sual attention. In the ”Feature Integration Theory”
(FIT), the parallel, preattentive processes build an im-
age representation with respect to a single feature and
encode the information in feature maps (color, ori-
entation, spatial frequency, . . . ). The maps are then
combined and the their peaks of activity are used to
choose the areas to inspect. One of the most influen-
tial and detailed models was proposed in (Koch and
Ullman, 1985). The computational model used in this
work is an extension of the model in (Itti et al., 1998),
built upon the theory (Koch and Ullman, 1985).
4 THE MODEL
The input image is first encoded in the Lab color
model. The raw L, a, and b values are then used
to build the color channels I
I
, I
R
, I
G
, I
B
, and
I
Y
that correspond, respectively, to intensity, red,
green, blue, and yellow. Each channel is encoded
in an image pyramid , that allows the model to
perform a multiresolution analysis of the input im-
age. Such channels are merged in Feature Con-
trast Maps (FCMs) using a center-surround repre-
sentation. The model uses single opponent chan-
nels, meaning that it builds a pyramid for each oppo-
nent feature: (R, G), (G, R), (B,Y ), (Y, B), (I
on
, I
o f f
),
(I
o f f
, I
on
), where ( f , f
?
) denotes a map encoding a
center-surround difference with feature f in the cen-
ter and feature f
?
in the surround. For example,
the map BY , obtained by I
B
and I
Y
, is computed
as follows: BY ← [(B ∗ G
0
) − max(Y ∗ G
1
,Y ∗ G
2
)]
+
,
where ∗ corresponds to the convolution, G
0
, G
1
, G
2
corresponds to Gaussian kernels with different sizes
(G
0
corresponds to the central part of the receptive
field, G
1
, G
2
to the surround) and the function [·]
+
simply sets to zero negative values. The FCMs are
then merged into Feature Maps (FMs) that encodes
the strength of each couple of opponent features. For
example, the maps (R, G) and (G, R) leads to the FM
RG. The two FCMs are normalized in order to re-
duce the values in maps with a diffuse activity and
enhance the values in maps with only few and small
spots of activity. The normalization is based on the
values of Summed Area Tables indicating how the
activity is spread all over the map. Local orienta-
tion maps are computed on the intensity pyramid by
convolving the intensity image in each layer using
a set of oriented Gabor filters at four different ori-
entations θ ∈
0,
π
4
,
π
2
,
3
2
π
. The filters used in the
model implementation are expressed as in (Daugman,
1985), with parameters with biological plausible val-
ues (Serre et al., 2007). The two color FMs and the
intensity FM are merged together using the same nor-
malization strategy described before. The four ori-
entation maps are merged into a single FM with the
same normalization method. All of the maps are then
normalized again using the method above and merged
together by simply computing the pixel-wise maxi-
mum among the maps. For each level of the pyra-
mids, the maps are merged into Level Saliency Maps
(LSMs). The final saliency map is obtained at the
lowest resolution level by taking the maximum value
in the corresponding area in all the LSMs.
5 EXPERIMENTATIONS
We tested the proposed VA-based filtering approach
on one landmark recognition and one objection recog-
nition tasks using two different datasets. The first
one is the publicly available dataset containing 1227
UsingVisualAttentioninaCBIRSystem-ExperimentalResultsonLandmarkandObjectRecognitionTasks
469
0.4$
0.5$
0.6$
0.7$
0.8$
0.9$
1$
0$ 20$ 40$ 60$ 80$ 100$
Accuracy'
Percentage'of'SIFT'keypoints'kept'
Random$
VA$
No$filter$
0.4$
0.5$
0.6$
0.7$
0.8$
0.9$
1$
0$ 10$ 20$ 30$ 40$ 50$ 60$ 70$ 80$ 90$ 100$
Accuracy'
Percentage'of'SIFT'keypoints'kept'
RANDOM$
No$Filter$
VA$
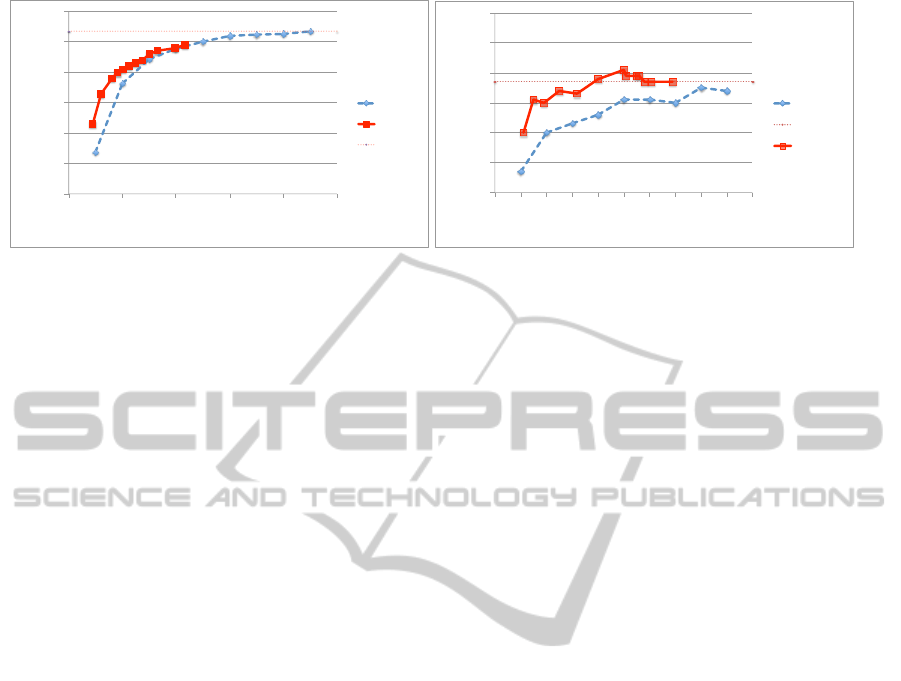
Figure 1: Accuracy on the the two datasets. Left: PISA-DATASET; Right: STIM-DATASET. Solid line: filtering based on
the saliency map; dashed line: random filtering. The maximum accuracy obtained without applying any filter is shown by the
horizontal dotted line.
photos of 12 landmarks (object classes) located in
Pisa (also used in (Amato et al., 2011; Amato and
Falchi, 2011)), hereafter named PISA-DATASET.
The dataset is divided in a training set (Tr) consisting
of 226 photos (20% of the dataset) and a test set (Te)
consisting of 921 photos (80% of the dataset). The
second dataset is contains 258 photos belonging to
three classes (cans, road signs, and emergency trian-
gles), hereafter named STIM-DATASET. The dataset
is similarly split into a training and a test set con-
taining, respectively, 206 and 52 photos. The experi-
ments were conducted using the Scale Invariant Fea-
ture Transformation (SIFT) (Lowe, 2004) algorithm
that represents the visual content of an image using
scale-invariant local features extracted from regions
around selected keypoints. Such keypoints usually lie
on high-contrast regions of the image, such as ob-
ject edges. Image matching is performed by com-
paring the description of the keypoints in two images
searching for matching pairs. The candidate pairs for
matches are verified to be consistent with a geomet-
ric transformation (e.g., affine or homography) using
the RANSAC algorithm (Fischler and Bolles, 1981).
The percentage of verified matches is used to argue
whether or not the two images contain the very same
rigid object. The number of local features in the de-
scription of the images is typically in the order of
thousands. This results in efficiency issues on com-
paring the content of two images described with the
SIFT descriptors. For this reason we applied a fil-
tering strategy selecting only the SIFT keypoints ex-
tracted from regions with a high saliency. Each image
in the dataset was processed by the VA model produc-
ing a saliency map. Since the resolution of the final
saliency map is low, each saliency map has been re-
sized to the dimension of the input image.
PISA-DATASET. In order to study how many SIFT
keypoints could be filtered out by the index, we ap-
plied several thresholds on the saliency levels stored
in the saliency maps. The thresholds range from 0.3
to 0.7 the maximum saliency value (normalized to 1).
The 0.3 threshold did not modify at all any of the
saliency maps, meaning that all of the saliency maps
had values larger than 0.3. SIFT keypoints were fil-
tered out only when they corresponded to points in
the saliency map with a value below the given thresh-
old. In order to see how effective the filtering by the
VA model was, we compared it against random fil-
tering. In this second case, we kept from 10% to
90% of the original SIFTs by incrementally remov-
ing keypoints chosen randomly. We used accuracy in
assigning the correct landmark to the test images (in
the previously mentioned dataset) as the measure of
performance . For each test image, the best candidate
match between the training images is selected using
the SIFT description and verifying the matches for an
affine transformation using the RANSAC algorithm.
The results of the experimentation are shown in fig-
ure 1. The x-axis shows the percentage of SIFT key-
points kept after filtering. The y-axis corresponds to
the accuracy reached by the classifier after the filter-
ing. The maximum accuracy is reached by not remov-
ing any keypoint and is equal to 0.935. The accuracy
does not vary much till a 40% filtering, when it starts
decreasing. When all the saliency values are used,
the filtering performed using the visual saliency maps
reaches a 0.89 accuracy when it removes almost 57%
of the original keypoints. The performance of the
VA-based filter is very similar to the random-based
one when 30% keypoints are kept. However, when
the percentages of removed keypoints increases, the
VA-based filtering algorithm outperforms the random
filtering. The results of the model with aggressive fil-
tering levels are quite encouraging. The model is in
fact able to preserve regions that are relevant for the
recognition of the specific object. There is a decrease
in the overall accuracy with respect to the SIFT clas-
sifiers, but the time needed to perform the classifica-
VISAPP2013-InternationalConferenceonComputerVisionTheoryandApplications
470

tion is significantly lower. In fact, when the classifi-
cation uses 100% of the SIFT keypoints (no filtering),
the average time for classifying a single test image
is 7.2 seconds. When we use only 30% or 20% of
the original SIFT keypoints (VA-based filtering) the
time needed for the classification of an image is, re-
spectively, 0.78 and 0.6 seconds per image on aver-
age. Even when the random filter and the VA-based
filter have the same accuracy, the saliency-based filter
provides better keypoints. When only a 40% percent-
age of the original keypoints is kept, the average time
needed to classify a single image is 1.07 and 0.97 sec-
onds for, respectively, images preprocessed using the
random filter and the VA-based filter. However, the
experimentation has also shown a relevant limitation
of filtering approaches based on bottom-up visual at-
tention. In fact, many test images misclassified by the
classifier contain salient regions that are radically dif-
ferent from the other images in the same category. For
example, since many pictures contain people in front
of monuments, the visual attention filter is prone to
remove (i.e., assign a low saliency to) the monument
in the background and preserve the people as the most
salient areas.
STIM-DATASET. In the case of the STIM-
DATASET the saliency maps were thresholded using
values ranging from 0.1 to 0.9 the maximum value
in the map. The percentage of SIFT keypoints kept
and used by the classifier ranges from 11% to 77%
(on average) the number of keypoints originally ex-
tracted from images. In this dataset, the relevant ob-
jects are well-separated by the background in almost
every image. Furthermore, since they never fill the en-
tire frame, their features are not considered too ’com-
mon’ and are not suppressed by the attentional mech-
anism. From the graph shown in Fig. 1 it is clear that
the VA-based filtering is able both to improve the ac-
curacy and to decrease the time needed for the classi-
fication. By using only half the keypoints selected
by the VA model, the classifier reaches 81% accu-
racy, which is much greater than those obtained us-
ing 100% of the original keypoints or 90% randomly
selected, that are equal to, respectively, 0.77 and 0.74.
6 CONCLUSIONS
In this paper we have presented a filtering approach
based on a visual attention model that can be used to
improve the performance of CBIR systems and ob-
ject recognition algorithms. The model uses a richer
image representation than other common and well-
known models and is able to process a single im-
age in a short time thanks to many approximations
used in various processing steps. The results show
that a VA-based filtering approach allows to reach a
better accuracy on object recognition tasks where the
objects stand out clearly from the background, like
in the STIM-DATASET. The results on the PISA-
DATASET are encouraging since a faster response
in the classification step is obtained with only a mi-
nor decrease in accuracy. However, the results need
a deeper inspection in order to gain a better under-
standing of the model on cluttered scene where the
object (or landmark) to be detected does not corre-
spond to the most salient image areas and usually fills
the frame.
REFERENCES
Amato, G. and Falchi, F. (2011). Local feature based image
similarity functions for kNN classfication. In Proc. of
the 3rd Int’l Conf. on Agents and Artificial Intelligence
(ICAART 2011), pages 157–166. SciTePress. Vol. 1.
Amato, G., Falchi, F., and Gennaro, C. (2011). Geometric
consistency checks for knn based image classification
relying on local features. In SISAP ’11: 4th Int’l Conf.
on Similarity Search and Applications, pages 81–88.
ACM.
Daugman, J. (1985). Uncertainty relations for resolution in
space, spatial frequency, and orientation optimized by
two-dimensional visual cortical filters. Journal of the
Optical Society of America A, 2:1160–1169.
Fischler, M. A. and Bolles, R. C. (1981). Random sample
consensus: A paradigm for model fitting with appli-
cations to image analysis and automated cartography.
Commun. ACM, 24(6):381–395.
Gao, H.-p. and Yang, Z.-q. (2011). Integrated visual
saliency based local feature selection for image re-
trieval. In Intelligence Information Processing and
Trusted Computing (IPTC), 2011 2nd International
Symposium on, pages 47 –50.
Hou, X. and Zhang, L. (2007). Saliency detection: A spec-
tral residual approach. In Computer Vision and Pat-
tern Recognition, 2007. CVPR ’07. IEEE Conference
on, pages 1 –8.
Itti, L., Koch, C., and Niebur, E. (1998). A model of
saliency-based visual attention for rapid scene anal-
ysis. IEEE Transactions on Pattern Analysis and Ma-
chine Intelligence, 20(11):1254–1259.
Koch, C. and Ullman, S. (1985). Shifts in selective visual
attention: towards the underlying neural circuitry. Hu-
man Neurobiology, 4:219–227.
Lowe, D. G. (2004). Distinctive image features from scale-
invariant keypoints. International Journal of Com-
puter Vision, 60(2):91–110.
Marques, O., Mayron, L. M., Borba, G. B., and Gamba,
H. R. (2007). An attention-driven model for group-
ing similar images with image retrieval applications.
EURASIP J. Appl. Signal Process., 2007(1):116–116.
Serre, T., Wolf, L., Bileschi, S., Riesenhuber, M., and Pog-
gio, T. (2007). Robust object recognition with cortex-
like mechanisms. IEEE Transactions on Pattern Anal-
ysis and Machine Intelligence, 29(3):411–426.
UsingVisualAttentioninaCBIRSystem-ExperimentalResultsonLandmarkandObjectRecognitionTasks
471
