
Sampling based Optimum Signal Detection in Concentration
Encoded Molecular Communication
Receiver Architecture and Performance
Mohammad Upal Mahfuz, Dimitrios Makrakis and Hussein T. Mouftah
School of Electrical Engineering and Computer Science, University of Ottawa, Ontario, K1N6N5, Canada
Keywords: Molecular Communication, Concentration Encoding, Intersymbol Interference, Sampling-based Detection,
Nanonetworks.
Abstract: In this paper for the first time ever a comprehensive analysis of the sampling-based optimum signal
detection in diffusion-based binary concentration-encoded molecular communication (CEMC) system has
been presented. A generalized amplitude shift keying (ASK) based CEMC system has been considered in
diffusion-based noise and inter-symbol interference (ISI) conditions. We present an optimum receiver
architecture of sampling-based signal detection, address the critical issues in signal detection, and evaluate
its performance in terms of sampling number, communication range, and transmission data rate. ISI
produced by the residual molecules deteriorates the performance of the CEMC system significantly, which
is further deteriorated when the communication distance and/or the transmission data rate increase(s). The
proposed receiver architecture can also be used to detect multilevel (M-ary) amplitude modulated signals by
increasing the alphabet size and changing the modulation format.
1 INTRODUCTION
Nanotechnology has recently brought several
research fields into a common ground in order to
realize new and emerging communication paradigm
of molecular communication (MC) (Nakano et al.,
2012) through offering many potential applications
involving nanonetworks, e.g. immune system
support, bio-hybrid implants, targeted drug delivery
in cancer treatment, health monitoring, and genetic
engineering (Akyildiz et al., 2008). Nanomachines
are tiny natural or engineered natural biological or
artificial machines with dimensions in the nanometre
to micrometre scale having at least one dimension in
the range from 1 nm to 100 nm. 1 nm is a billion-th
(i.e. 10
-9
) of a metre. Concentration-encoded
molecular communication (CEMC) system has been
discussed in detail in several of our previous works
(Mahfuz et al., 2010b). CEMC system uses only a
single type of information molecules and the TN
encodes information by modulating the amplitude of
the transmission rate of the input signal. The
molecules thus released by the TN undergo ideal
diffusion-based propagation. The RN decodes the
information by observing the concentration of the
molecules available at the location of the RN. Signal
detection in CEMC is quite challenging because ISI
plays a destructive role and increases the probability
of incorrect decoding of the transmitted symbols.
Earlier work reported in (Mahfuz et al., 2010b) first
proposed the concept of sampling-based detection
method for CEMC signaling. However, that did not
present its receiver architecture or its range and rate
dependent characteristics, which is the main focus of
this paper. In this paper we have made two major
contributions: first, a mathematical model of an
optimum receiver architecture of sampling-based
signal detection in diffusion-based CEMC system
has been presented, and second, we develop the
exact expressions of detection performance of the
proposed receiver and evaluate that with the bit error
rate (BER) characteristics when several influencing
factors e.g. sampling number, communication range,
and transmission data rate vary. The paper is
organized as follows. Section 2 briefly discusses the
system model. Section 3 describes the development
of sampling-based receiver in detail and discusses
the communication range and rate dependent
characteristics. Finally, Section 4 concludes the
paper with possible future research directions.
372
Upal Mahfuz M., Makrakis D. and T. Mouftah H..
Sampling based Optimum Signal Detection in Concentration Encoded Molecular Communication - Receiver Architecture and Performance.
DOI: 10.5220/0004305403720376
In Proceedings of the International Conference on Bio-inspired Systems and Signal Processing (BIOSIGNALS-2013), pages 372-376
ISBN: 978-989-8565-36-5
Copyright
c
2013 SCITEPRESS (Science and Technology Publications, Lda.)

2 DIFFUSION BASED CEMC
SIGNALING
As shown in Fig. 1 the RN has a number of receptors
of the same kind that can bind with a single type of
information molecules transmitted by the TN.
Referring to Fig. 1 the concentration of molecules at
the RN can be explained by Fick’s laws of ideal
diffusion (Berg, 1993) and so the molecules can
become available to the RN multiple times. The TN
and the RN are synchronized in time (Moore et al.,
2009). The RN is assumed to be located at the centre
of a small volume known as the virtual receive
volume (VRV) (Atakan and Akan, 2010). Assuming
a point source type TN located at (0,0,0) transmitting
molecules as an impulsive fashion (i.e.
()
m
Qt
where
()t
is Dirac delta function) the mean concentration
of available molecules U(r,t) in molecules per unit
volume at a three-dimensional space
ˆ
ˆˆ
rixjykz
(where the RN is located) and at
time t changes with time and space as below (Bossert
and Wilson, 1963); (Berg, 1993).
222
3
2
2
3
2
(,) , exp
4
4
exp
4
4
m
m
x
yz
Q
Urt Grt
Dt
Dt
Q
r
Dt
Dt
(1)
where
r
is the vector representing distance between
the TN and the RN, r
2
=x
2
+y
2
+z
2
when a Cartesian
coordinate system is assumed, Q
m
, m={0,1} is the
number of the transmitted molecules, and D is the
diffusion constant of information molecules in the
homogenous medium.
(,)Grt
is known as the
impulse response of the CEMC channel.
Assuming isotropic diffusion in homogenous
case in three dimensions, hereafter we can drop the
vector notation in
(,)Grt
and write G(r,t) only.
Integrating G(r,t) over the volume V of the RN we
can get the mean number of the available molecules
in the volume V as below.
222
3/2
,,
exp
4
4
RN
V
m
V
Grt GrtdV
Q
xyz
dx dy dz
Dt
Dt
(2)
where V represents the volume of the RN sensing
region and
dV dx dy dz is the differential volume
in the V. Expressing G
RN
(r,t) in energy-normalized
quantity we can express the mean number of
molecules available at the RN as
ˆ
ˆˆ
rixjykz
RN
Figure 1: Ideal (free) diffusion of information molecules in
the unbounded propagation medium. The receptors of the
RN shown in inset bind with a single type of molecules.
0
2
3
2
2
0
3
0
2
(,)
(,)
(,)
1
exp
4
4
(,)
where
1
(,)
exp
4
4
RN
mm m
RN
RN
RN
Grt
srt Q Qp
Grtdt
r
Dt
Dt
Grt
p
r
Grtdt
dt
Dt
Dt
(3)
indicates the energy-normalized impulse response of
the CEMC channel (Mahfuz et al., 2010a). s
m
(r,t)
can be considered as mean concentration signal
intensity of the available molecules at any TN-RN
distance r at time t, and any integral of s
m
(r,t) over
time is considered as mean signal strength. We
assume that D=10
-6
cm
2
/sec. of small information
molecules in water medium remains unchanged over
the entire observation time and the effects of size of
the information molecules on D is negligible.
3 SAMPLING BASED RECEIVER
3.1 Receiver Architecture
In a binary CEMC system the transmission of a
symbol is done according to amplitude shift keying
(ASK) modulation (Haykin, 2000) based on time-
slotted manner as shown in Fig. 2, meaning that the
TN transmits each bit at the beginning of the bit
interval T
b
. In binary ASK scheme the TN transmits
Q
0
(t) molecules when it wants to send a bit “0” and
it transmits Q
1
(t) molecules when it wants to send a
bit “1.” As a result,
0
()
b
N
j
mb
QtjTis the transmitted
signal and the TN transmits Q
m
molecules, m{0,1}
and Q
m
1, depending on the bit to be transmitted
being b
j
{0,1} respectively, where j={1,2,…,N
b
},
SamplingbasedOptimumSignalDetectioninConcentrationEncodedMolecularCommunication-ReceiverArchitecture
andPerformance
373
N
b
being the total number of bits to be transmitted.
The number of molecules that would be available
and possibly received by the RN in the VRV would
represent the deterministic amplitude s
m
(t) of the
received molecular concentration signal following
binomial distribution as shown below. When the TN
sends Q
m
, m{0,1}, molecules in the medium for
each symbol, the probability of having k molecules
in the RN out of the Q
m
transmitted molecules
during the i-th symbol interval (i.e. whether each of
those k molecules arrives the RN during the i-th
symbol interval or not) can be expressed by the
binomial distribution function as below.
()
!
Pr ; , (1 )
!( )!
m
Qk
k
m
m
m
Q
kQ p p p
kQ k
(4)
For a reasonably large value of
1
m
Q , when p is
not close to 1 or 0 and
p is finite such that as
,nnp , the binomial distribution on the
right side of (4) can be approximated to a normal
distribution
2
(, )
ss
N
where the mean ()
s
and the
variance
2
()
s
can be expressed as
2
(), 1 ()(1 )
and so, , 1 ( ), ( ) 1 .
sm m s m m
mm m m
Qp s t Qp p s t p
NQpQp p Ns t s t p
(5)
As a result, we can see that the mean of the number
of molecules available for reception is actually the
deterministic signal
()
m
s
t that was found as the mean
signal intensity in (3) using the macroscopic theory
of the diffusion mechanism (Berg, 1993). Therefore,
the total number of molecules y(t) available for
reception as a result of diffusion only can be
expressed as a normal distributed random variable
that is the sum of the deterministic part
()
m
s
t and a
zero-mean normal variable with variance
()(1 )
m
s
tp as below (Kay, 1993).
() () () where
() 0, ()1 ()1 0,1
ms
sm m
yt s t n t
nt N s t p s t pN
(6)
During the i
th
bit duration the RN would receive
some of the molecules that were transmitted by the
TN at the beginning of the i
th
symbol interval, plus
some of the molecules that were transmitted by the
TN during the previous symbol durations i.e. from
the first symbol duration up to the (i-1)
th
symbol
duration. The former part constitutes the desired
signal part and the latter constitutes the ISI part of
the received signal. Fig. 3 shows the output signal
U(r,t) with 10 samples taken in each symbol
duration.
The number of molecules available to the RN at
any time during the symbol duration is a random
variable with signal-dependent mean and variance,
and therefore, including the ISI the received signal
intensity can be expressed as
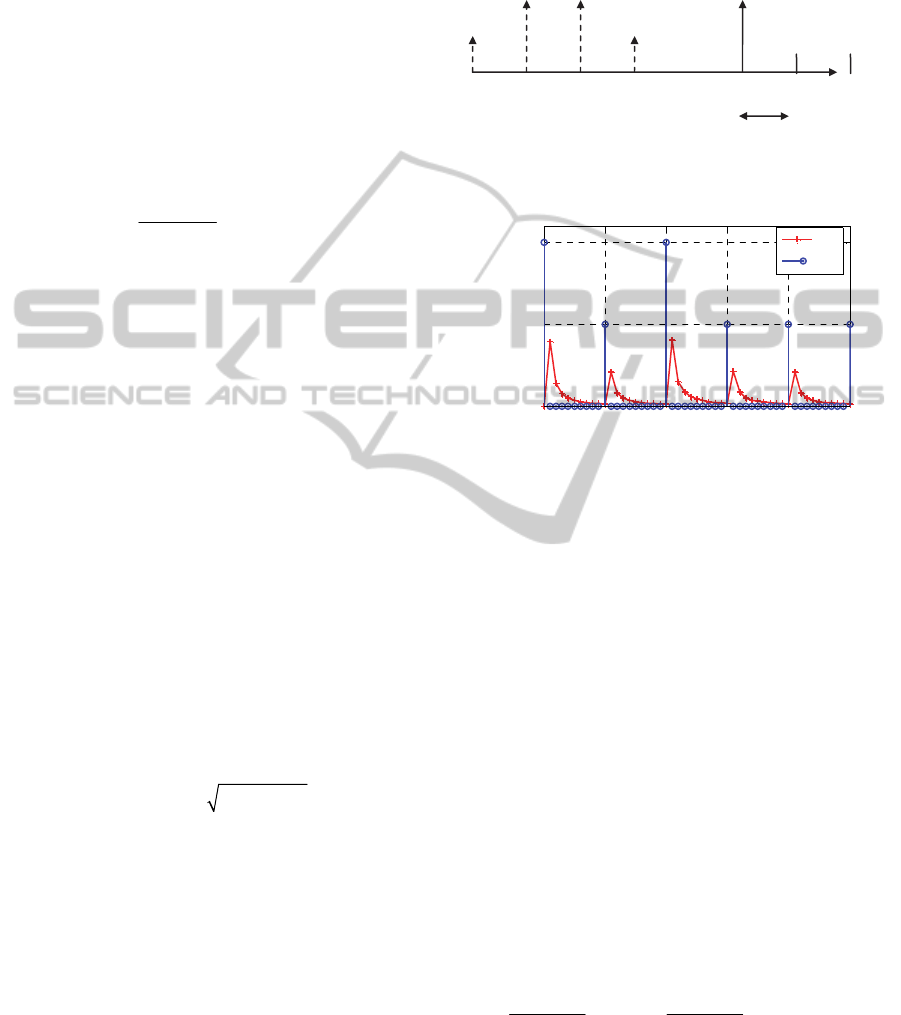
Figure 2: Binary ASK signaling at the beginning of each
symbol duration.
0 100 200 300 400 500
0
5000
10000
Time (sec.)
U(r,t) molecules/cm
3
z(t)
Q(t)
Figure 3: Input and output signals in binary ASK CEMC
system. A “1” and a “0” are represented by sending 10,000
and 5,000 molecules respectively at the beginning of each
symbol duration.
sISI
() () () ()
m
zt s t n t n t
(7)
where
s
()ntis as shown in (6) and
ISI
()nt represents
the residual molecules due to ISI and can be
expressed as
2
ISI ISI ISI
() ( , )nt N
. Therefore, the
binary signal detection problem in CEMC system
can be formally written as below.
2
1ISI1 ISI1
2
0ISI0 ISI0
() , ()(1 ) ; H
()
() , ()(1 ) ; H
Nst st p
zt
Ns t s t p
(8)
An optimum receiver is the one that gives the
minimum probability of error. We consider the
minimum probability of error criterion to derive a
test statistic by calculating the logarithm of the
likelihood ratio using Neyman-Pearson formula
(Kay, 1993) with equal prior probabilities as below.
11
00
||
1 ln 0
||
zH zH
zH zH
(9)
The conditional probabilities can be expressed as
shown in (10). Note that for any prior probability the
optimum receiver is termed as the maximum a
T
b
…
(i-1)T
b
iT
b
(i+1)T
i-th symbol
2T
b
Q
0
Q
1
Q
0
Q
1
Q
1
0
BIOSIGNALS2013-InternationalConferenceonBio-inspiredSystemsandSignalProcessing
374
posteriori probability (MAP) detector, which for
equal prior probability
01
Pr( ) Pr( )
H
H reduces to
maximum likelihood (ML) detector (Kay, 1993).
1
2
1ISI
2
1ISI
2
1ISI
0
2
0ISI
2
0ISI
2
0ISI
1
|
2()(1)
()
exp
2()(1 )
1
|
2()(1)
()
exp
2()(1 )
zH
st p
zst
st p
zH
st p
zst
st p
(10)
A sampling-based detector samples the received
concentration signal at a number of points in each
symbol duration. Each sample value represents one
observation. Therefore, for a total of N observations,
[1, 2,..., ]nN , combining (9) and (10) and
simplifying yields the test statistic T(z) as:
1
0
Select H
2
1
Select H
22
0ISI1ISI
1 ISI 0 ISI
22
1 ISI 0 ISI
2
0ISI
1
[] [] [][] , where
11
[]
2 [ ](1 ) 2 [ ](1 )
[] []
[]
[](1 ) [](1 )
[](1 )
1
ln
2
[
N
n
Tz anz n bnzn
an
sn p sn p
sn sn
bn
sn p sn p
sn p
s
2
1ISI
22
ISI 1 ISI
2
1
0ISI
2
0ISI
[]
](1 ) 2 [ ](1 )
[]
2[](1 )
N
n
sn
np snp
sn
sn p
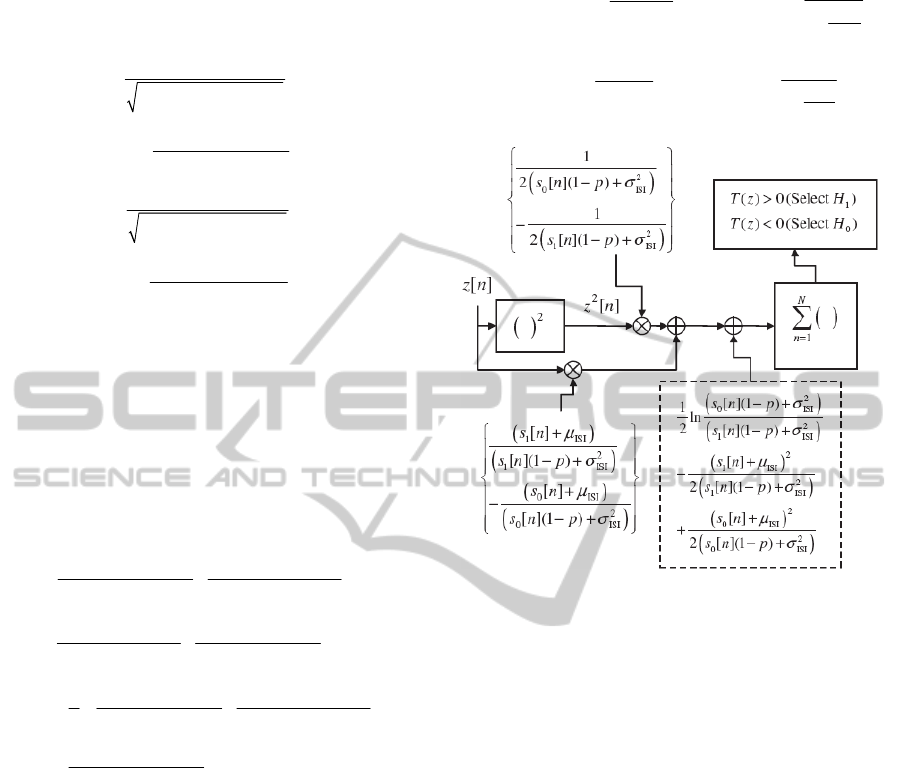
The resulting sampling-based receiver architecture is
shown in Fig. 4.
Approximate (Closed Form) Expression. The exact
performance in terms of probability of false alarm
(P
FA
) and probability of detection (P
D
) is difficult to
be determined analytically because the test statistic is
a sum of a normal distributed random variable and a
weighted sum of independent
2
1
random variables.
However, in the following we assume an example
scenario and try to derive the closed form
expressions of P
FA
and P
D
under certain assumptions.
Assuming that N is even i.e. N=2L where L is a
positive integer, and that the coefficients of
2
[]
x
n are
all distinct and occur in pairs, P
FA
and P
D
can be
expressed respectively as below, where
is the
modified
(Kay, 1993).
0
1
2
exp
2[]
L
FA n
n
z
PA
an
where
1
1
[]
1
[]
L
n
i
in
A
ai
an
1
1
2
exp
2[]
L
Dn
n
z
PB
an
where
1
1
[]
1
[]
L
nn
i
in
B
A
ai
an
.
Figure 4: Sampling-based receiver architecture for binary
CEMC system.
3.2 Communication Range and Rate
Dependent Characteristics
We explain the proposed sampling-based receiver
architecture in terms of three factors, namely, N, r,
and f. The receiver model developed analytically has
been evaluated numerically for average BER using
100,000 randomly generated bits at each simulation
scenario. As shown in Fig. 5 when more number of
samples are used in the receiver the average BER
decreases. For instance, when 4 samples per bit are
used in the receiver, we observe a high BER of
approximately 0.5 meaning that approximately half
of the bits are decoded incorrectly. However, we
found that when N=20 or more (data not shown) the
receiver can decode all the bits correctly i.e. BER=0.
The more the N is the better the receiver performs
because the receiver gets more information from
more samples that it can use in decoding the bit
correctly. On the other hand, Fig. 6 shows the effects
of communication range (r) on BER such that when r
increases BER increases. This is due to the temporal
spreading the signal experiences as r increases,
owing to the nature of the diffusion-based CEMC
channel (Mahfuz et al., 2010a). The communication
SamplingbasedOptimumSignalDetectioninConcentrationEncodedMolecularCommunication-ReceiverArchitecture
andPerformance
375
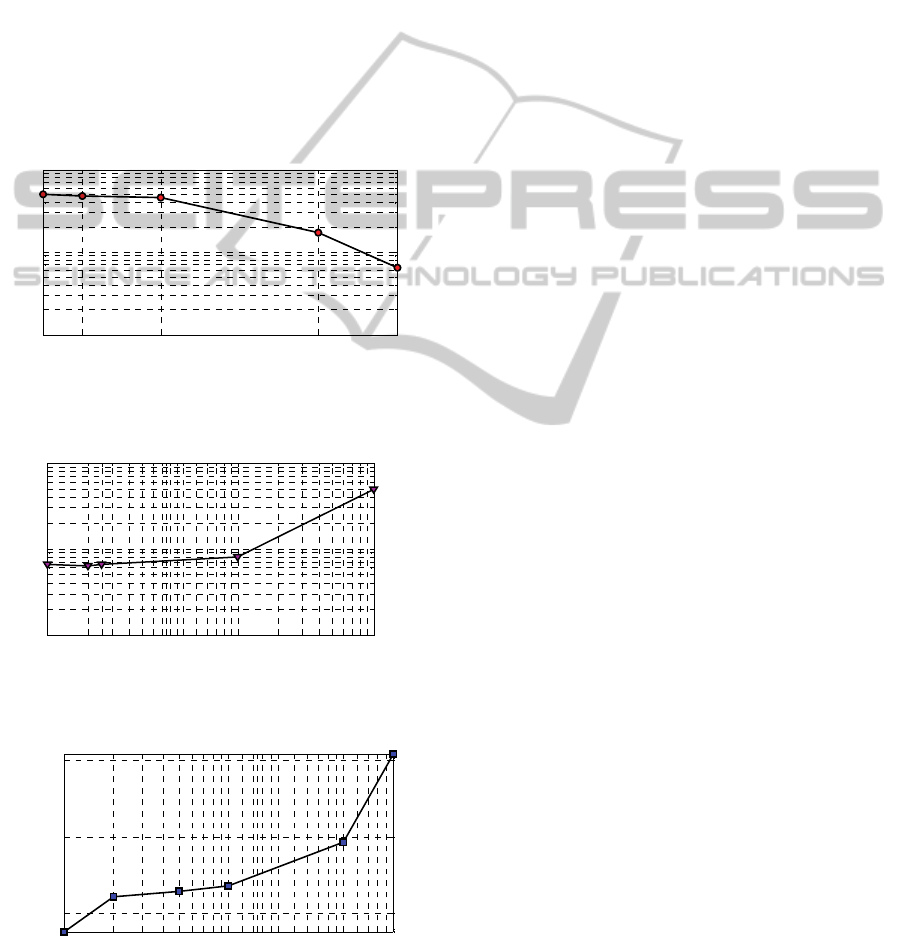
range investigated is in between 400 nm and 100
m,
which covers a wide range of TN-RN distances for
water medium as reported in (Mahfuz et al., 2010b).
Finally, the effects of data rate on BER are shown in
Fig. 7 such that BER increases as f increases. This is
also due to the ISI caused by the temporal spreading
of the channel when the input symbol changes at a
higher rate. When f increases the symbol duration
decreases and as a result the receiver cannot cope up
with the input signal to decode the transmitted bits
correctly, and in addition, suffers from the ISI. The
effects of ISI become more severe when f increases
further giving rise to BER of ~6% at f=0.01 bits per
second (bps) to ~7% at f=1 bps when r and N are
kept fixed at 800 nm and 10 samples per symbol
respectively.
1 2 4 8 10
10
-2
10
-1
10
0
No. of samples per bit (N)
BER
Figure 5: Effects of number of samples per symbol (N) on
BER when r=800 nm and f=0.01 bps.
400 nm 1 um 10 um 100 um
10
-2
10
-1
10
0
r (nm)
BER
Figure 6: Effects of communication range on BER when
N=10, f=0.01 bps.
0.01 0.02 0.05 0.1 0.5 1
10
-1.19
10
-1.16
10
-1.13
f (bps)
BER
Figure 7: Effects of transmission data rate on BER when
r=800 nm and N=10.
4 CONCLUSIONS
In this paper we have developed and evaluated the
performance of sampling-based optimum receiver
architecture of CEMC system. The proposed receiver
model should be valid for any type of input signal
transmission with any modulation format, e.g. pulse
amplitude modulation (PAM) transmission, and can
also be extended to detect signals with multilevel (M-
ary) amplitude modulation in CEMC system.
Bionanomachines existing in the nature can sense the
concentration of molecules at their receptors, which
may help implement sampling-based receivers
through engineering of bionanomachines. Finally, the
results presented in this paper will surely help a
molecular communication engineer to evaluate the
performance of a CEMC system in greater details.
REFERENCES
Akyildiz, I. F., Brunetti, F. and Blazquez, C., 2008.
"Nanonetworks: A New Communication Paradigm",
Computer Networks Journal (Elsevier), vol. 52, pp.
2260-2279.
Atakan, B. and Akan, O. B., 2010. "Deterministic capacity
of information flow in molecular nanonetworks",
Nano Communication Networks, vol. 1, no. 1, pp. 31-
42.
Berg, H. C., 1993. Random Walks in Biology, Princeton
University Press, NJ, USA. .
Bossert, W. H. and Wilson, E. O., 1963. "The analysis of
olfactory communication among animals", Journal of
theoretical biology, vol. 5, no. 3, pp. 443-469.
Haykin, S., 2000. Communication Systems, 4th edn, John
Wiley & Sons.
Kay, S. M., 1993. Fundamentals of statistical signal
processing, Vol. 2 Detection Theory, Englewood
Cliffs, NJ: PTR Prentice-Hall.
Mahfuz, M. U., Makrakis, D. and Mouftah, H. T. 2010a,
"Characterization of Molecular Communication
Channel for Nanoscale Networks", Proc.
BIOSIGNALS-2010, pp. 327, Spain, 20-23 January.
Mahfuz, M. U., Makrakis, D. and Mouftah, H. T. 2010b,
"On the characterization of binary concentration-
encoded molecular communication in nanonetworks",
Nano Communication Networks, vol. 1, no. 4, pp. 289-
300.
Moore, M.-., Suda, T. and Oiwa, K., 2009. "Molecular
Communication: Modeling Noise Effects on
Information Rate", NanoBioscience, IEEE
Transactions on, vol. 8, no. 2, pp. 169-180.
Nakano, T., Moore, M. J., Fang Wei, Vasilakos, A. V. and
Jianwei Shuai 2012. "Molecular Communication and
Networking: Opportunities and Challenges",
NanoBioscience, IEEE Transactions on, vol. 11, no. 2,
pp. 135-148.
BIOSIGNALS2013-InternationalConferenceonBio-inspiredSystemsandSignalProcessing
376
