
Semi-quantitative Monitoring of VOCs Emission Decay
based on Gas Sensor Array and Graphical Display
Andrzej Szczurek and Monika Maciejewska
Faculty of Environmental Engineering, Wroclaw University of Technology,
Wybrzeże Wyspiańskiego 27, 50-370, Wrocław, Poland
Keywords: Gas Sensor Array, Visualization, Monitoring, Semi-quantitative Assessment.
Abstract: We propose a method of evaluating volatile organic compounds (VOCs) emission decay semi-
quantitatively. The method utilizes continuous measurements performed with gas sensor array and the
simultaneous visualization of measurement data. Individual VOCs are evaluated against the graphically
displayed quantitative criteria, which describe the stages of the emission process. Based on the displayed
information, human operator evaluates the gas mixture composed of the emitted VOCs. In order to visualize
the data together with the quantitative criteria the two-dimensional feature space was proposed. A number
of issues were discussed in this work regarding the selection of the adequate feature spaces and suitable
methods of their partitioning in order to reflect the stages of the VOCs emission process in the structure of
the feature space.
1 INTRODUCTION
Over the last decades it has become evident that
many products can be major contributors to the
pollution of the indoor environment with volatile
organic compounds. These substances are found in
wide variety of everyday products such as floor
coverings, solvent-based paints/coatings, adhesives,
sealants, printing inks, many consumer products,
organic solvents and petroleum products. VOCs
contained in products tend to diffuse to the surface
of the products and then they are emitted to the air
over time. When these emissions occur indoors,
building occupants are exposed via inhalation.
Unfortunately, some of the emitted VOCs may
affect the perception of the indoor air quality, e.g. in
the form of odor nuisance, eye and airway irritation.
Thus, there is an increasing awareness and emphasis
on receiving the information, whether concentrations
exceed levels that may affect human health or
comfort. Therefore manufacturers are increasingly
asked or required to demonstrate that vapor-phase
emissions of chemicals of concern from their
products under normal use conditions comply with
various voluntary or regulatory acceptance criteria.
In practice, it is difficult to accomplish this
requirement. In general, the mechanism of VOCs
release from products and the factors influencing the
emission process are complex and can involve the
diffusion of VOCs within the product and their
evaporation from the surface to the ambient air.
Additionally, the emission rate of VOCs may be
affected by the concentration of these species in the
air, decomposition related to the hydrolysis or heat,
oxidation, chain breakdown resulting in the smaller
and more volatile molecules as well as the sorption
on the material surface. All these phenomena cause
that the process of VOC emission is time dependent.
For these reasons, there is the absence of a uniform
procedure for modelling and calculating the
emission rate of VOCs.
Other approach requires manufacturers to have
their products periodically tested for VOC emissions
by independent laboratories using designated
reference test methods (for example, Test Method
D6007, ISO 16000-9, and ISO 16000-10). This
strategy very often uses chromatography and
spectroscopy which are accurate and precise.
However, reference methods for testing chemical
emissions from products are typically expensive, too
time-consuming and impractical for routine emission
monitoring in a production environment. So, there is
a great need for rapid, easy-to-use, inexpensive,
portable instruments for real-time, continuous or
periodic measurements performed in situ or on-line,
162
Szczurek A. and Maciejewska M..
Semi-quantitative Monitoring of VOCs Emission Decay based on Gas Sensor Array and Graphical Display.
DOI: 10.5220/0004310401620170
In Proceedings of the 2nd International Conference on Sensor Networks (SENSORNETS-2013), pages 162-170
ISBN: 978-989-8565-45-7
Copyright
c
2013 SCITEPRESS (Science and Technology Publications, Lda.)
that do not require specialist technicians. This
demand can be fulfilled by the devices equipped
with the solid-state chemical sensors. Among solid-
state chemical sensors, tin oxide semiconductor
sensors developed by Taguchi are highly sensitive to
volatile organic compounds (VOC) and other
reducing gases. Unfortunately, they cannot be used
as individual devices for qualitative and quantitative
analyses, because of very low selectivity. This
problem may be solved by the use of the
measurement system consisting of a suitable
sampling system, an array of gas sensors with partial
or overlapping sensitivities and a pattern recognition
component capable of discriminating between
simple as well as complex gas mixtures (Jurs et al.,
2000).
In practice, there is frequently a need for rapid
characterization of volatile compounds emission.
Such measurements are performed in an analysis
mode termed “semi-quantitative”. They are not
designed to offer the ultimate accuracy but to
provide the results with the sufficient accuracy in
both an analysis time and labour efficient manner
(Lemke et al., 2005, Dias et al., 2011). The aim of
this work was to propose a method of semi-
quantitative analysis of VOCs multi-component gas
mixtures which are emitted from different products.
Several assumptions were made in our studies.
The first one was related to the instrumental aspects
of semi-quantitative analysis. The elaborated system
should be based on: (1) semiconductor gas sensor
array, (2) dynamic mode of operation and (3) pattern
recognition module. Sensor array usually generates
highly dimensional response to the target gas.
Therefore it is difficult to extract the information
useful for solving the problem under investigation
from the obtained data. Graphical methods offer a
simple way of analyzing data in an exploratory
manner (Scott et al., 2007). For that reason, it was
assumed that the graphical method of data analysis
could be used in the system for semi-quantitative
measurements. Additionally, we assumed that from
the start, the emission of VOCs decreases over time
and the decay process is relatively fast. In our work,
semi-quantitative analysis was designed to provide
the information which allows for comparing the
concentration of the selected species with the
standards using minimum effort and in close to real
time. It is assumed that the investigated substances
belong to the brad category of VOCs are they are
known in advance. By definition, the accuracy of the
method should be in the range of ± 30 to 50 %.
2 MATERIALS AND METHODS
2.1 VOCs Gas Mixture
In order to test the approach we focused our
attention on the four-component gas mixture. It was
composed of toluene, hexane, acetone and ethyl
acetate, see Fig. 1 and Table 1. These VOCs are
widely used in many commercial products and by
means of evaporation from the surface they find
their way to the surrounding air. Fourteen series of
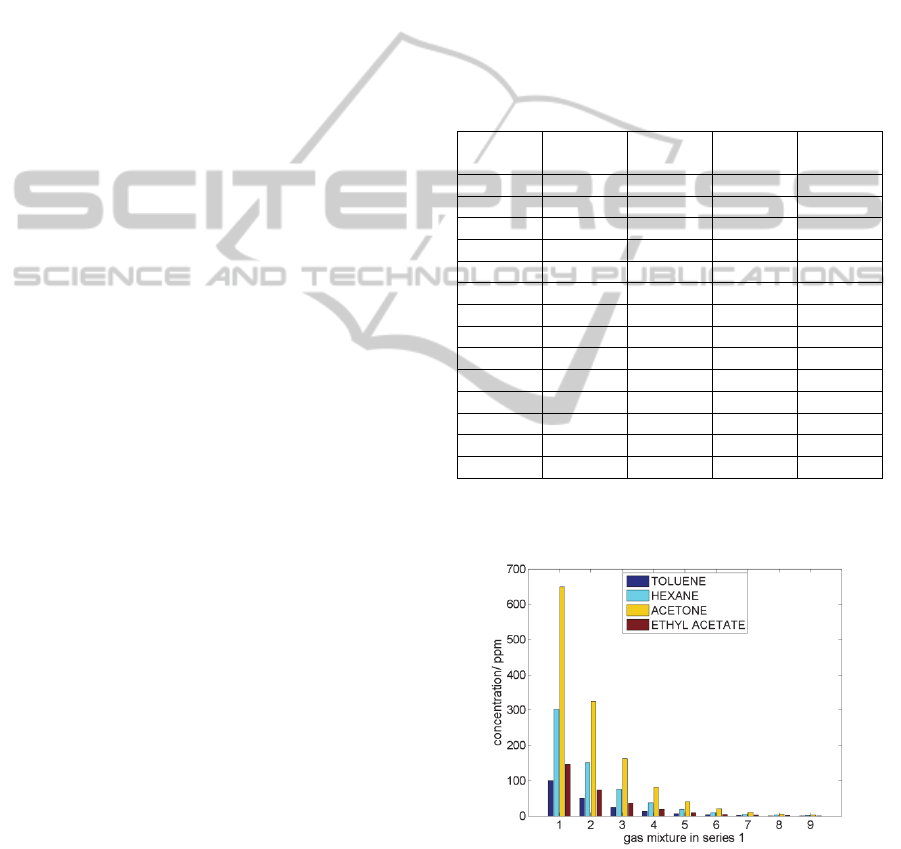
gas mixture samples were experimentally examined.
Table 1: Initial concentrations of four VOCs in each of
fourteen measurement series [ppm].
Series Toluene Hexane Acetone
Ethyl
acetate
1 101.0 302.0 650.2 146.8
2 110.4 299.6 640.3 149.7
3 122.0 296.6 628.1 153.2
4 136.7 292.9 612.7 157.7
5 155.9 288.0 592.5 163.5
6 182.0 281.4 565.2 171.4
7 219.5 271.9 525.9 182.8
8 277.9 257.0 464.5 200.5
9 381.8 230.6 355.5 232.1
10 618.0 170.7 107.6 303.7
11 874.2 0.0 0.0 325.8
12 959.1 0.0 0.0 240.9
13 1064.9 0.0 0.0 135.1
14 1090.9 0.0 0.0 0.0
Each series of gas mixture samples started from
different initial concentrations of VOCs (Table 1).
Figure 1: Single measurement series of gas mixtures.
There were chosen decreasing concentrations
within series, in order to simulate the decay of
VOCs emission process in a manner which is shown
in Fig. 1. The measurements were repeated three
times.
Semi-quantitativeMonitoringofVOCsEmissionDecaybasedonGasSensorArrayandGraphicalDisplay
163

2.2 Gas Sensor Array
The experimental setup consisted of several
functional blocks. Pure and dry air was produced
using zero air generator manufactured by Horiba.
The installation for standard gas preparation
included vaporizer in the form of the heated glass
coil with an injection port, Tedlar bag (12 l) and the
chromatography syringe (Hamilton). The module for
delivering and control of the gas flow was equipped
with the diaphragm pump, mass flow controllers,
valves and Teflon gas line. Sensing array was
equipped with the set of six commercially available
Taguchi Gas Sensors made by Figaro Engineering
Japan. There were applied: TGS2620, TGS821,
TGS825, TGS826, TGS2104, TGS2602. Each
sensor was mounted inside its own, specially
designed, airtight, flow-type test chamber. Chambers
were made of aluminum. The chambers were
provided with gas inlet and outlet and they were
connected parallel using Teflon-tubing. Such
configuration allowed for the simultaneous exposure
of the sensors to the same gas. The sensor array was
attached to the module for delivering and control of
the gas flow. The chambers were also equipped with
electrical connections. Each sensor was connected to
the voltage supplier and electronic circuit. The
output signals were measured in the form of voltage
variations on the load resistance with the time
resolution of 1 s. The ADC (Maxim 1231) was used
for analog to digital signal conversion. Signals were
recorded by the application developed in LabView.
Personal computer with the suitable software was
used for data storage, processing and analysis. The
system was operated in the dynamic mode. The
sensor signal was collected for a predefined period
of time. The responses of sensor array at each time
point of exposure to the test gas were considered as
distinct sources of information about the state of the
gas mixture. They were the candidates to become the
basis of semi-quantitative gas mixture assessment.
3 MEASUREMENT DATA
VISUALISATION FOR GAS
MIXTURE MONITORING
Semiconductor gas sensor array was chosen as the
source of measurement data to be applied for VOCs
emission decay monitoring. Due to their operation
principle sensors provide the data which contains
wide range of information about the tested gases.
Very accurate information may be acquired from
sensor array data provided that the adequate pattern
recognition methods are applied (Bermak et al.,
2006). This requirement comes from the fact that the
data has multivariate character and it is usually
featured by a considerable redundancy. In this work,
we proposed a simple manner of analyzing gas
sensor array measurement data. It was designed to
satisfy the objective of performing the semi-
quantitative assessment of emitted VOCs gas
mixture. The principal element of the concept was
the visualization of the data.
There are many thinkable ways of sensor array
data visualization, radar plots being most popular
among them. However, the graphical representation
of measurement data, which is to serve semi-
quantitative assessment of gas mixture, imposes
certain requirements on the method. The chosen
domain of graphical representation shall allow for:
1) simultaneous visualization of the data and the
criteria of its division, 2) establishing the semi-
quantitative relationship between the data and the
criteria, based on the visual inspection.
In this work there was exploited the concept of
employing feature space as the visualization domain.
In principle, the feature space encompasses the
representations of all possible states of gas mixture.
There was performed a division of the feature space.
The division resulted from solving the gas mixture
classification problem in that space. The division
criteria had the quantitative character i.e. they
referred to the quantitative parameter(s) of gas
mixture. As a result, there were separated the sub-
spaces containing representations of gas mixture
compositions, which complied with distinct criteria.
The criteria were displayed in the feature space as
the decision boundaries.
We chose two-dimensional feature spaces for
displaying the criteria and the measurement data.
More dimensions were not allowed to assure
comprehensive visualization. The current state of
gas mixture was represented as a wandering point in
the feature space. The coordinates of the point were
defined by the result of measurement obtained upon
dynamic exposure of sensor array to the investigated
gas.
It was proposed to monitor gas mixture evolution
by simultaneously analyzing the change of its main
components. Separate display panel was dedicated to
demonstrate the fate of each component of gas
mixture. The evolution of single component was
carried out against quantitative criteria. Depending
on the application they could refer to concentrations
of substances or other quantities describing
environmental impact of the test gas e.g. odor
SENSORNETS2013-2ndInternationalConferenceonSensorNetworks
164
intensity. The background of the display was to
provide visually the information on parts of the
feature space which represent particular stages of the
emission process decay. The partitioning of the
feature was guided by the mentioned criteria. The
gas mixture component evolution would be
evaluated by looking at the location of the data point
representing current measurement results against the
background information. The combined assessment
of gas mixture would be based on the human
judgment. It shall utilize the information about all or
just selected components of the gas mixture,
presented in the display panels.
A number of issues had to be considered while
designing a visualization of measurement data in the
proposed manner. The main ones were: 1) the
selection of features to form feature spaces, 2) the
selection of method to organize the feature space in
a way that its different regions correspond to the
subsequent stages of evolution of gas mixture
composed of the emitted VOCs. In both cases the
selection criteria had to be articulated and applied.
We proposed to anchor the feature space in a
defined time point of exposure to the test gas in the
dynamic mode of operation.
There were proposed two kinds of feature spaces
for consideration. The first kind was formed by
single time point signals of two different sensors.
The main advantage of using the time point sensor
signal as the feature is the direct transfer of the
sensor measurement result to the display, as the data
pre-processing is not required. In such case, there
are a number of available feature spaces to choose.
They may be associated with different time points of
exposure and also different pairs of sensors may be
considered. The main drawback of this solution is
that features of this kind are not orthogonal. The
second kind of feature was the principal component
(PC) resulting from the transformation of the data
associated with a single time point of sensor array
exposure to the test gas with principal component
analysis. This kind of feature represents the
combined information provided by all sensors in the
array. The features are orthogonal, but the
measurement data preprocessing step is required for
obtaining them. It was allowed that the feature
spaces selected for different components of gas
mixture are associated with different time points of
exposure to the test gas.
In this work, we applied an exhaustive search
across the pool of all two-dimensional feature spaces
in order to find the best ones.
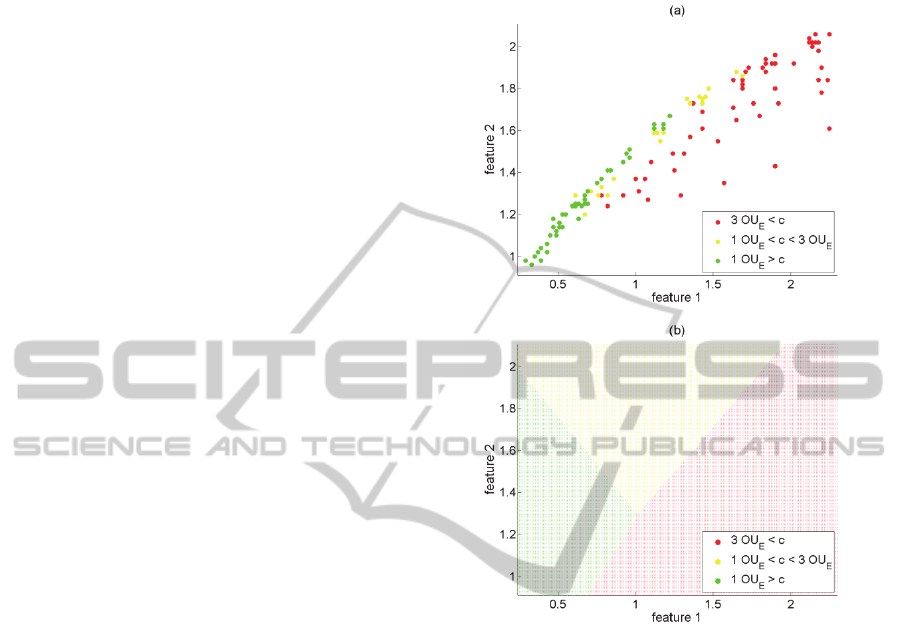
The simplest way to display measurement results
which allows for tracing the gas mixture evolution in
feature space is to use the data on the reference gas
mixtures as the ‘background’, as shown in Fig. 2a.
Figure 2: Two options of the background information
visualization on the gas mixture evolution in feature space:
a) with the use of reference gas measurement data, b) by
applying feature space division.
The data may be shown using different colours
or shapes which indicate separate categories of
reference gases, associated with different stages of
VOCs emission decay process. The way to evaluate
the current state of gas mixture is by comparing the
location of the measurement data point with the
location of reference data points on the display. This
simple solution has one major drawback. The test
gas mixture may be evaluated if the result of the
current measurement shows up in the part of the
display which is populated by data points associated
with the reference gas mixtures. While moving out
of this range the assessment becomes dubious due to
lack of reference. In practical applications, such
situation is very likely.
This major shortcoming may be overcome by
applying a classification engine for feature space
structuring. It is a way of dividing entire feature
space in an objective manner, see Fig. 2b. Two
Semi-quantitativeMonitoringofVOCsEmissionDecaybasedonGasSensorArrayandGraphicalDisplay
165

issues shall be addressed in relation to that
operation. These are: the method of dividing feature
space and the formulation of the classification
problem.
There are basically utilized the distance principle
and the decision boundary concepts while
developing classifiers (Snopok and Kruglenko,
2002). In the first approach the class assignment is
performed by calculating the data point distance to
different classes and by choosing the least distant
class. The second strategy involves the division of
the feature space into subspaces by imposing
decision boundaries which are in general
multidimensional surfaces (in 2D space these are
lines). They divide the space into disjoint regions
associated with distinct classes. The advantage of
the second approach consists in proposing the
division of entire feature space directly. Although
far from the regions populated by the calibration
data points the division shall be treated with caution
the feature space is reasonably well structured close
to them. Moreover, the class assignment of the new
data is related to its location with respect to the
displayed decision boundaries. In the particular
application considered in this work, the methods
based on decision boundaries would be favored also
for another reason. We found that the set of points
representing the gas mixture evolution has a
characteristic layout in the feature space, see Fig. 2a.
They are not arranged into a number of disjoint
clusters but they rather form one stretched grouping.
Due to the continuous transition between the stages
of gas mixture evolution the data points representing
subsequent stages are neighbours. In such
circumstances, the methods designed to cope well
with compact and disjoint clusters are inappropriate.
In this work, Discriminant Analysis was applied for
feature space partitioning. It is the most simple and
least time consuming classification method based on
decision boundary concept. We tested whether the
liner technique (LDA) or Quadratic Discriminant
Analysis (QDA) is more suitable for our application.
The way of formulating the classification
problem gains importance while applying multi-
criteria division of the feature space. It is a necessity
upon monitoring the evolution of gas mixture.
Willing to discriminate k stages of gas mixture
emission decay one may decide to apply one
division of feature space into k classes or k-1 two-
part divisions. While the first approach is quite
inflexible, the other leaves space for some
adjustment of the feature space structure to the
relative importance of the individual criteria. In this
work there were applied the criteria allowing to
assess VOCs emission process regarding their odor
impact (CIWEM's, 2011). We were willing to
discriminate between the following three stages of
gas mixture evolution: odor intensity below 1
OU
E
/m
3
, odor intensity between 1 OU
E
/m
3
and 3
OU
E
/m
3
and odor intensity higher than 3 OU
E
/m
3
. In
principle, the examination was performed for each
component of gas mixture separately.
Finally, one shall articulate the criteria of
selecting the best feature space. In this work we
considered two criteria. The first criterion was the
misclassification rate of reference gas mixtures. This
objective criterion indicated how successful was the
particular feature space together with the way of its
partitioning in assigning training patterns,
representing different stages of VOCs emission
process to the appropriate classes. There was also
applied other, subjective criterion. It referred to the
correspondence between the logics of feature space
fragmentation and the logics of gas mixture
evolution. Namely, there were examined the
arrangement, in particular the neighbourhood, of
distinct fragments of feature space, representing the
sequence of VOCs emission decay stages.
4 RESULTS AND DISCUSSION
The accuracy of reference gas mixtures
classification was the first criterion employed for the
assessment of data visualization method dedicated to
semi-quantitative gas assessment using sensor array.
The criterion was aimed to represent the accuracy of
feature space division with respect to the stages of
VOCs emission process. The following aspects of
visualization were examined with this criterion: 1)
selection of feature space coordinates (single sensor
related or sensor array related), 2) method of feature
space partitioning (linear or nonlinear), 3)
formulation of feature space division problem (k-1
divisions into two-part, or one division into k parts).
The misclassification rates of reference gas
mixture patterns are presented in Table 2, Table 3
and Table 4. The values shown in the tables are
medians. They provide a statistical indication of
misclassification rates obtained in feature spaces,
which were built separately for each time point of
sensor signal obtained upon dynamic exposure. Due
to the fact that misclassification rates were low for
most of the time points, the error rates shown in
Table 2, Table 3 and Table 4 well represent
minimum misclassification rates achievable with the
particular approach. The pairs of best sensor are
quoted in Table 5.
SENSORNETS2013-2ndInternationalConferenceonSensorNetworks
166
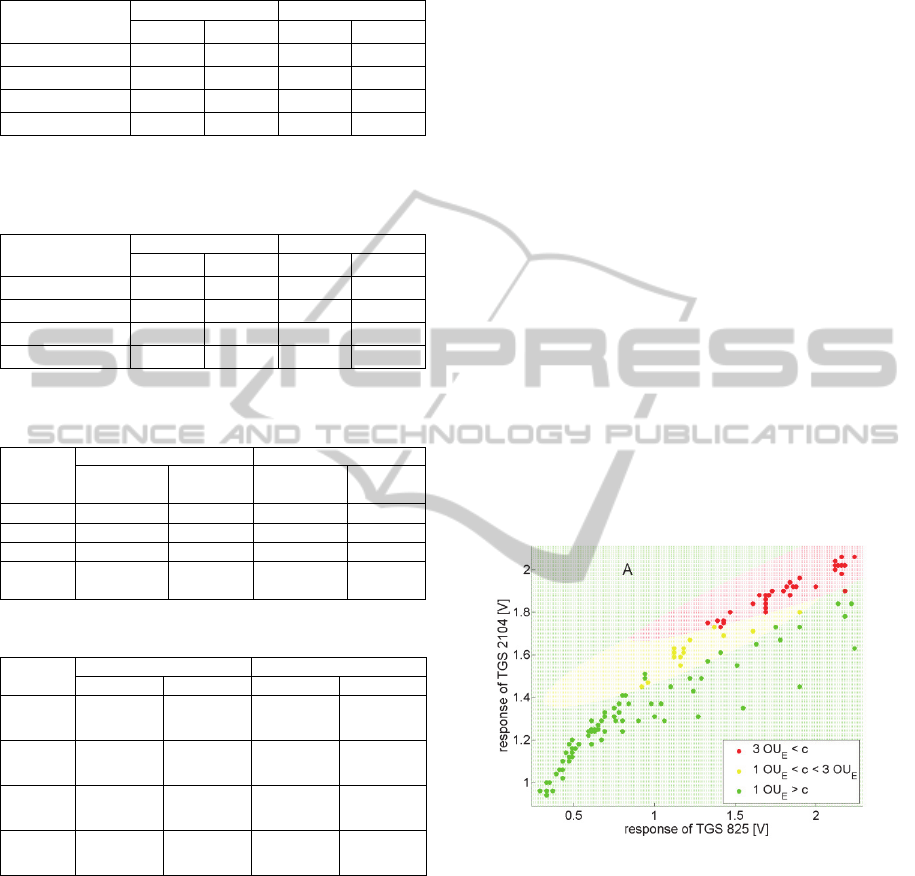
Table 2: Error rates while applying k-1 two-part divisions
in best feature spaces, by means of LDA. Criterion I: 1
OU
E
/m
3
, Criterion II: 3 OU
E
/m
3
.
VOC
Best sensor pair PC1 - PC2
I II I II
Toluene 13.49 7.14 9.52 18.25
Hexane 2.38 4.76 7.94 14.29
Acetone 7.94 8.73 15.87 11.11
Ethyl acetate 11.90 7.94 14.29 8.73
Table 3: Error rates while applying k-1 two-part divisions
in best feature spaces, by means of QDA. Criterion I: 1
OU
E
/m
3
, Criterion II: 3 OU
E
/m
3
.
VOC
best sensor pair PC1 - PC2
I II I II
Toluene 7.14 4.76 7.94 9.52
Hexane 3.17 0.00 3.17 0.00
Acetone 3.97 1.59 7.94 3.17
Ethyl acetate 12.7 5.56 12.70 7.94
Table 4: Error rates while applying one division of feature
space into k parts.
VOC
LDA QDA
best sensor
pair
PC1-PC2
best sensor
pair
PC1-
PC2
Toluene 23.20 26.98 13.49 19.50
Hexane 3.97 11.11 3.17 5.56
Acetone 13.49 23.02 8.73 14.29
Ethyl
acetate
15.08 16.67 11.11 12.70
Table 5: Best sensor pairs.
VOC
k-1 two-part divisions one division into k parts
LDA QDA LDA QDA
Toluene
TGS825,
TGS2104
TGS825,
TGS2104
TGS825,
TGS2104
TGS826,
TGS2104
Hexane
TGS825,
TGS2602
TGS826,
TGS2104
TGS825,
TGS2602
TGS2620,
TGS2104
Acetone
TGS826,
TGS2104
TGS826,
TGS2104
TGS826,
TGS2104
TGS825,
TGS2104
Ethyl
acetate
TGS825,
TGS826
TGS2620,
TGS826
TGS825,
TGS2602
TGS825,
TGS2104
Based on the joint analysis of Table 2, Table 3
and Table 4, the application of k-1 two-class
divisions of feature space resulted in lower
misclassification rates as compared to one division
into k fragments. The differences were considerable
and in single cases they exceeded 10 %. In general,
nonlinear classification offered better results than
linear. Regarding kind of features applied for
constructing the feature space it was shown that
responses of best pairs of sensors outperformed
principal components. The gain was less obvious
while applying k-1 two-class partitioning (Table 2
and Table 3) than in case of one division into k
classes (Table 4). It is noticeable in Table 5 that
different sensor pairs were found best for tracing the
evolution of the individual components gas mixture.
Except for one case (Table 4, toluene) all considered
methods allowed for the assessment of gas mixture
evolution stages with an error not exceeding 20 %.
In most cases the error was lower than 10 %. The
obtained result is satisfactory in view of ±30 to 50 %
accuracy expected from the gas sensor system which
performs semi-quantitative analysis.
While choosing the criterion of best separation of
classes as decisive, the obtained results indicate that,
the best choice for visualization of gas mixture
evolution is: 1) selecting responses of single sensors
as coordinates, 2) applying nonlinear division of
feature space and 3) using k-1 two-part divisions of
feature space. However, while designing the
visualization system the consideration of other
aspects is also worthwhile.
The first of other aspects considered in this work
is the reflection of the logics of gas mixture decay in
the structure of feature space. It is shown in Fig. 3
that illogical divisions are likely to occur while
applying nonlinear method of feature space division/
data classification.
Figure 3: Illogical division of feature space realized by
QDA.
From the logic of the arrangement of reference
gases data points, it is unlikely to encounter low
odor intensity gas mixtures in the region of feature
space marked A (Fig. 3). The structure of feature
space proposed by the classifier is questionable. The
problem indicated by the presented example may be
encountered both, when applying multiple two-class
partitioning as well as one division into k parts. It
comes from the fact that nonlinear classifier tends to
tighten nonlinear boundaries around groups of points
which belong to the same class. It result in lower
Semi-quantitativeMonitoringofVOCsEmissionDecaybasedonGasSensorArrayandGraphicalDisplay
167
misclassification rates (Table 2 to Table 4) but at
some distance from the centers of the classes, the
organization of the feature space may fail to agree
with the logics of the variability of real object
represented by the data. The linear solution,
although less advantageous in terms of the
classification performance is less likely to generate
such misinterpretations.
The second of other visualization aspects
considered in this work is associated with the
multiple two-class approach to the feature space
division. While choosing this strategy instead of one
multiclass division, the designer of data visualization
for the sensor system may decide about the priority
of one or the other criteria of gas mixture state
assessment. This problem is illustrated in Fig. 4. An
example of linear division was chosen for showing,
although the same possibility is available while
using nonlinear classifier.
The region marked A, between the dashed lines
(red and green), may host data points considered as
representing highly odorous gas mixture or low odor
Figure 4: Prioritization of the criteria for gas mixture
evolution stages detection.
intensity gas mixture depending on whether the
priority was given to the decision boundary set at c =
3 OU
E
/m
3
or to c = 1 OU
E
/m
3
. In the second case the
field denoted with A shall be marked green.
The division shown in Fig. 4 would be favoured
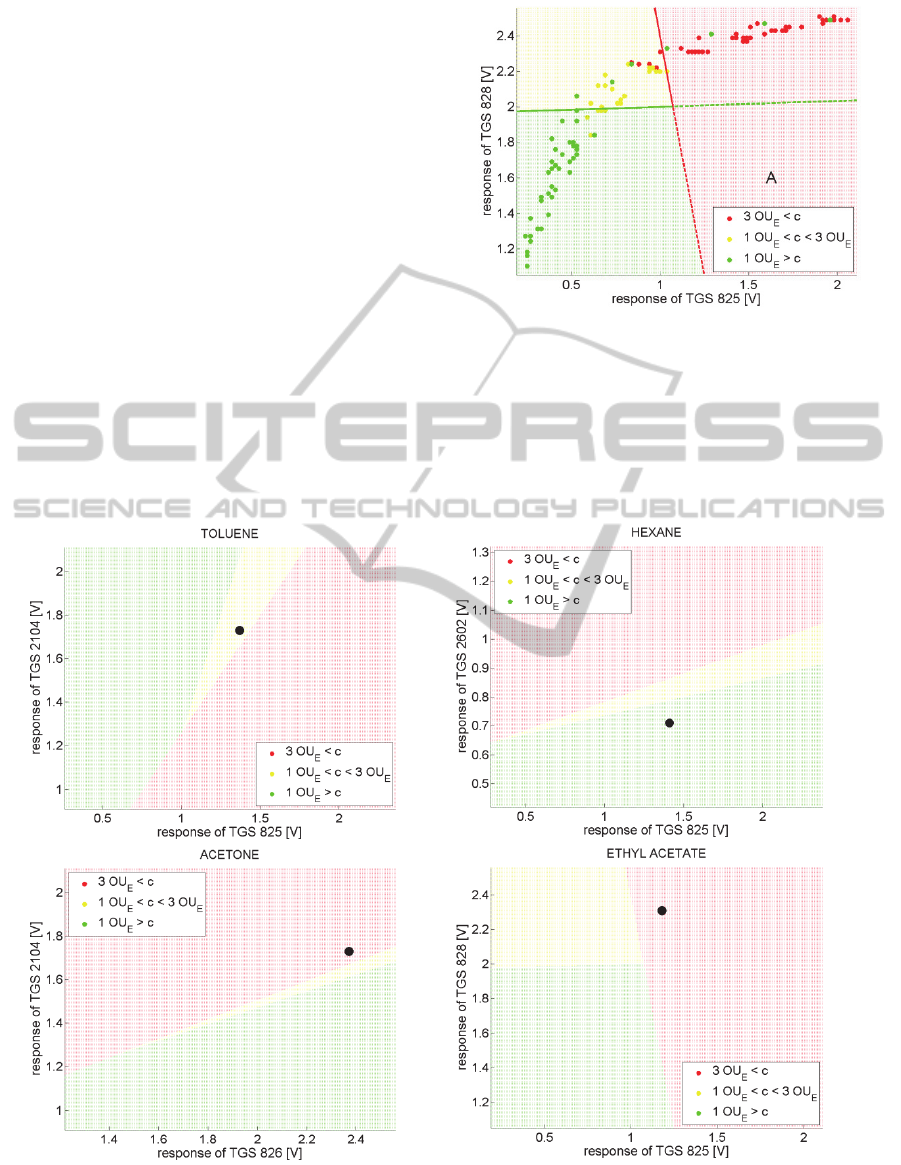
Figure 5: Sensor array measurement data visualization for semi-quantitative monitoring of VOCs emission decay process.
There is shown a exmple of a display designed for four-component gas mixture. We were willing to discriminate between
the following three stages of gas mixture evolution: odor intensity below 1 OU
E
/m
3
, odor intensity between 1 OU
E
/m
3
and 3
OU
E
/m
3
and odor intensity higher than 3 OU
E
/m
3
. Black dot indicates the current state of gas mixture.
SENSORNETS2013-2ndInternationalConferenceonSensorNetworks
168

if the underestimation of the gas mixture odor
intensity was not desired, e.g. in environmental
applications. However, one would rather choose the
other way of dividing the feature space if avoiding
too strict judgment of gas mixture odor intensity was
most important. In case of a single multiclass
partitioning the possibility of gas mixture
assessment criteria tuning is not available. We
additionally showed that in this case the
classification errors are higher (Table 2 to Table 4).
Based on the above findings, we proposed the
concept of gas sensor system for the semi-
quantitative monitoring of multi-component VOCs
mixture emission decay. The system consists of the
semiconductor gas sensor array and the graphical
display. Commercial TGS sensors are used. They are
operated in the dynamic mode. The display of the
sensor system is divided into panels, as shown in
Fig. 5. Each panel hosts the graph of two-
dimensional feature space. Separate graphs are used
to address distinct components of gas mixture with
the quantitative criteria. The responses of selected
sensors are used as features (dimensions of feature
spaces). Best pair of sensor is chosen for each
substance individually. Linear division of feature
space is performed using Linear Discriminant
Analysis. Mulitple two two-class divisions are
applied with the priority assigned to detecting gas
mixtures with higher polluting potential. The
integral elements of the feature space are the
decision boundaries. They represent the quantitative
criteria which separate different stages of gas
mixture evolution. The tested gas mixture is
represented as the wandering point in the feature
space on each display. The diagnosis of gas mixture
state results from the combined assessment which
utilizes the displayed information about all, or
selected components of gas mixture, and it is based
on human judgment.
5 CONCLUSIONS
In this work there was proposed the concept of gas
sensor system for the semi-quantitative monitoring
of the emission process decay of multi-component
VOCs mixture. The principal idea for realizing the
assessment was to visualize the evolution of gas
mixture components against the objective,
quantitative criteria. It allows for fast human
judgment on the condition of the mixture as a whole,
based on the visual inspection of the graphical
display.
For visualization we proposed to use the two-
dimensional feature spaces. They were defined for
each component of gas mixture individually.
Classifiers were applied in order to partition feature
spaces according to the criteria which discriminate
between different stages of VOCs emission process.
The measurement data resulting from an ongoing
measurement was displayed in the feature spaces. Its
location with respect to the distinguished fragments
of feature spaces was indicative for the current state
of gas mixture.
Based on our investigation, the most difficult
problem of sensor system design was the lack of
objective criteria to decide whether the proposed
division of feature space is adequate. It was shown
that the criterion of lowest misclassification rate of
reference gas mixture patterns was insufficient for
assuring that the obtained partitioning of feature
space follows the logic of gas mixture evolution.
The objective criteria regarding neighborhood and
sequence of regions corresponding to particular
classes would be needed to evaluate the candidate
feature spaces in that respect. In this work we dealt
with these problems in a heuristic manner.
We think that the proposed solution may be
interesting for the constructors of sensor systems
addressed to environmental monitoring applications.
ACKNOWLEDGEMENTS
This work was supported by the project "Detectors
and sensors for measuring factors hazardous to
environment - modeling and monitoring of threats",
POIG.01.03.01-02-002/08-00.
REFERENCES
Bermak A., Belhouari S. B., Shi M., Martinez D. (2006).
Pettern recognition techniques for odor discrimination
in gas sensor array, Encyclopedia of Sensors, 10, 1-17.
CIWEM's Position on Odours, Feb. 2011,
http://www.ciwem.org/knowledge-
networks/panels/air/control-of-odour.aspx
Dias L. G., Peres A. M., Barcelos T. P., Sá Morais J.,
Machado A.A.S.C. (2011) Semi-quantitative and
quantitativeanalysis of softdrinks using an
electronictongue, Sens. Actuators B, 154(2), 111-118.
Jurs P.C., Bakken G. A., McClelland H. E. (2000).
Computational methods for the analysis of chemical
sensor array data from volatile analytes, Chem. Rev.,
100, 2649-2678.
Lemke M., Fernández-Trujillo R., Löhmannsröben H.G.
(2005) In-situ LIF Analysis of Biological and
Semi-quantitativeMonitoringofVOCsEmissionDecaybasedonGasSensorArrayandGraphicalDisplay
169

Petroleum-based Hydraulic Oils on Soil, Sensors, 5,
61-69.
Scott S. M., James D., Ali Z. (2007) Data analysis for
electronic nose systems, Microchim. Acta, 156, 183-
207.
Snopok B. A., Kruglenko I. V. (2002) Multisensor system
for chemical analysis: state-of-the-art in Electronic
Nose technology and new trends in machine olfaction,
Thin Solid Films, 418, 21-41.
SENSORNETS2013-2ndInternationalConferenceonSensorNetworks
170
