
A Data Logger for Wireless Sensor Network
Giuseppe Amato
1
, Stefano Chessa
2
, Claudio Gennaro
1
, Daniele Pallini
2
and Claudio Vairo
1
1
ISTI-CNR, via G. Moruzzi 1, Pisa, Italy
2
Universit`a di Pisa, Largo B. Pontecorvo 3, Pisa, Italy
Keywords:
WSN, Logger, Transducer, Java.
Abstract:
Wireless sensor networks (WSN) are often used to monitor environmental data because of their low cost.
However, writing applications for such a technology requires not trivial programming skills. Moreover it is
not easy to find available general purpose tools that can be used to perform a monitoring task with a WSN
because usually such tools are focused on a specific application scenario. In this paper we present a tool for
the real-time acquisition of data from a set of Mote sensors and for the storage of the acquired data in the flash
memory of the sensors. The tool provides functionalities to retrieve the stored data in the sink node, to insert
them in a database and to visualize them by means of a graphical user interface that runs on a linux-based PC.
The tool that we propose consists of both the software that runs on the PC and the software to be installed on
Motes.
1 INTRODUCTION
Wireless sensor networks (WSN) are a technology
suitable to monitor a wide range of environmental pa-
rameters such as pressure, temperature, acceleration,
chemical composition, etc... and they are used for
battlefield surveillance, habitat monitoring, home au-
tomation and health-care applications (Baronti et al.,
2007; Culler et al., 2004; Romer and Mattern, 2004).
Monitoring/Logging services, in particular, focus
on dissemination and collection of environmentaldata
in order to monitor the flora, the fauna as well as nat-
ural and human-made elements. For example, (Ya-
mamoto et al., 2012) provides an in-depth study of
WSN applications to monitor and control the swiftlet
habitat. Tolle et al. presents a query-based frame-
work for temporal and spatial monitoring of a red-
wood tree for environmental monitoring (Tolle et al.,
2005). Arora et al. builds a real-time surveillance
system for target detection, classification and tracking
using a central monitoring unit (Arora et al., 2004).
Sometimes, however, the only real time monitor-
ing is not sufficient but it can be useful also to store
the data for further analysis and processing at a later
time. This implies that the sensors must be pro-
grammed to save the data locally and to send them
successively to a coordinator node (hereafter called
sink) to avoid congesting the communication chan-
nel with a huge amount of transmissions. Especially
when the number of sensors is high.
We also want to be able to control the entire sensor
network remotely without having to retrieve the sen-
sors once they have been installed. In certain cases,
for example in wildlife monitoring applications, once
the sensor has been installed on the body of the an-
imal is no longer possible to recover it if we do not
want to disturb the observation.
The objective of this work is to provide a frame-
work for remotely control a set of Motes for both real-
time and off-line data acquisition. The tool is com-
patible with the IRIS, MicaZ and TelosB platforms.
With this tool, the user can request a series of mea-
surements related to surrounding environment (light,
temperature, accelerometer, humidity, Pir - Passive
infrared, Magnetic, RSSI- Radio Signal Strength In-
dicator, and microphone). The data collected by the
Motes can be subsequently be forwarded to the sink,
which can store them in a local database, enabling the
user for off-line analysis and processing.
2 SYSTEM REQUIREMENTS
The system we have developed meets the following
basic requirements:
• Topology. Figure 1 shows the network architec-
ture of our WSN. The Motes acquire the requested
data and send them to the sink Mote either in a
real-time fashion, or on-demand when requested.
65
Amato G., Chessa S., Gennaro C., Pallini D. and Vairo C..
A Data Logger for Wireless Sensor Network.
DOI: 10.5220/0004315000650069
In Proceedings of the 2nd International Conference on Sensor Networks (SENSORNETS-2013), pages 65-69
ISBN: 978-989-8565-45-7
Copyright
c
2013 SCITEPRESS (Science and Technology Publications, Lda.)
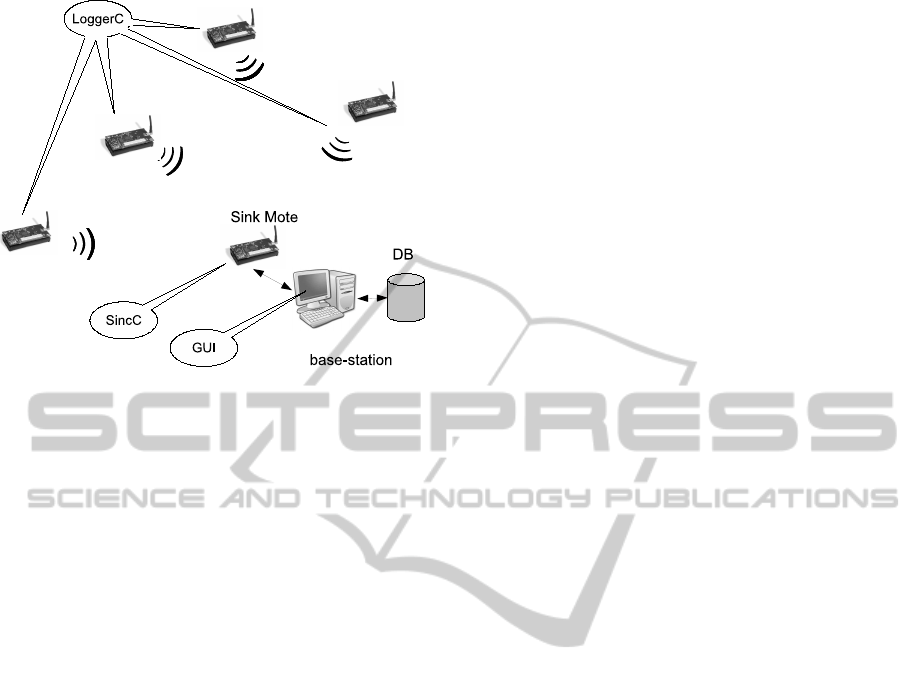
Figure 1: The topology of the data logger.
The sink interfaces the WSN with the user: it
routes the data received from the other Motes to
the base-station (the PC) where they are stored
in a local database and visualized to the user by
means of the GUI.
• Mote Management and Setting. The number of
Motes involved in the query can change over time,
and each of them can be managed independently
from the others. Each Mote must be able to be set
up, turned on and off without affecting the oper-
ation of the other Motes in the network. At the
same time, the system must allow the user to acti-
vate, deactivate or reset all Motes on the network
simultaneously. The main parameters that can be
set in mote are the following:
– Sampling period. It indicates the period of time
(expressed in milliseconds) between two con-
secutive readings of the transducers.
– Type of transducer. It allows the user to choose
which transducers of the sensor board the Mote
has to sample.
• On-line and Off-Line Data Collection. The
monitor application on the Motes can be exe-
cuted in two modalities: on-line and off-line. The
on-line mode provides the data collected in real-
time for being immediately stored in the cen-
tral database when they are received by the base-
station. In the off-line mode, on the other hand,
the data are temporarily stored within the Mote
flash memory and they can be downloaded at a
later time, upon a specific request from the user.
• Data Storage. - Each data detected by transduc-
ers mounted on Motes must be stored in a central
database located on the base-station, allowing the
user to access the data and analyze them anytime.
Note that in most WSN application scenario, the
amount of acquired data can be very large, so this
feature is particularly useful.
• Graphical User Interface. The Graphical User
Interface (GUI) allows the user to remotely setup
all the needed parameters on the Motes and to
activate/deactivate all the functionalities provided
by the logger. Moreover, the GUI visualizes the
receiveddata while they are stored in the database,
so a first quick analysis of the data can be executed
without having to access the database. This is use-
ful in particular for the real-time applications.
3 ARCHITECTURE
The Data Logger consists of four separate software
components (see Figure 1):
• SincC is the gateway between the WSN and the
user that runs on Sink Mote.
• LoggerC is the component designated to collect
and store the data that runs on Motes.
• GUI is the user interface that runs on the base-
station.
• DB is the database for the storage of the data col-
lected that runs on the base-station.
3.1 SincC
The sink Mote is the access point to the network
from the real world. This Mote, therefore, forwards
the commands received from the base-station to the
other Motes of the network through the wireless com-
munication channel. It also routes all the data ac-
quired from the Mores in the network towards the
base-station to which it is connected through a serial
channel. The nesC component, that implements such
functionality similar to a hub, is called SincC and it
has to be installed on the sink Mote.
3.2 LoggerC
The rest of the Motes in the network have the same
nesC application installed on board called LoggerC.
Their typical function is to read the values from the
transducers integrated on the sensorboard, store the
acquired data in their internal flash memory and/or
send them to the sink.
SENSORNETS2013-2ndInternationalConferenceonSensorNetworks
66
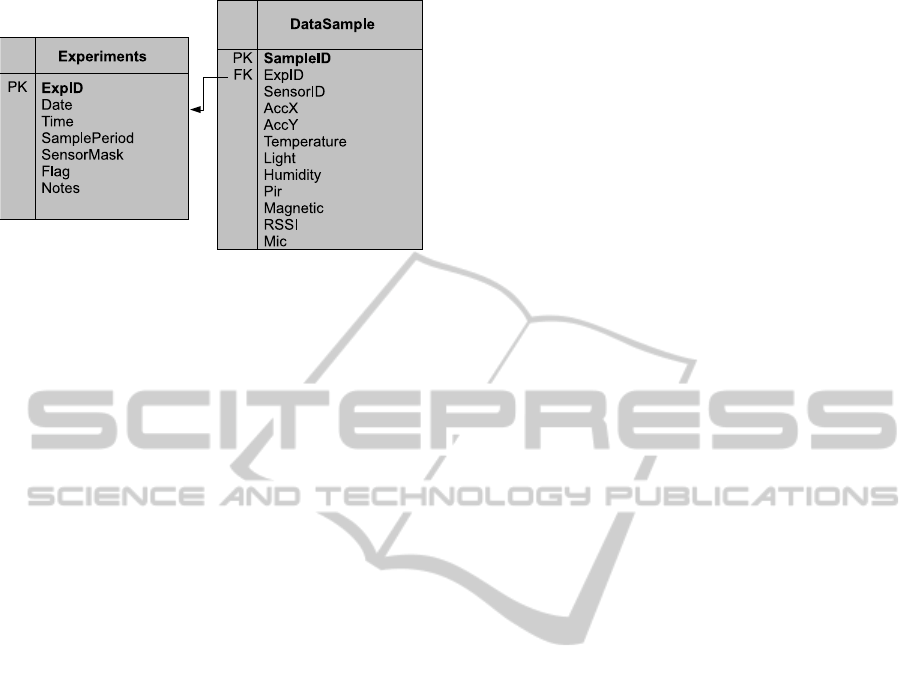
Figure 2: The Entity-Relationship diagram of the database.
3.3 GUI
Through the GUI the user is able to remotely instruct
the LoggerC components to start/stop the sampling,
to download the data stored in the flash memory of
a Mote and to erase the memory after the download
has been completed. The GUI also allows the user
to specify the parameters needed for the monitoring
task: sampling period at which the data have to be
acquired, transducers to sample, acquisition modality
(on-line and/or off-line), the ID of the target Mote or,
in case of storing in the flash memory and erasing the
flash memory content, to send the command in broad-
cast to all the Motes. The Sink connected to the base-
station redirects the command specified in the GUI to
the target Mote. In case of on-line mode, the acquired
data are immediately sent back to the base-station and
they are displayed on the GUI and stored in the DB. In
case of off-line mode, instead, the data are only stored
in the flash memory of the Mote. In order to get these
data, a specific download command has to be sent and
the data are received, stored in the DB and visualized
in the GUI, as in the on-line scenario.
3.4 DB
The DB component is an SQL relational database.
The tables created in the database regard the exper-
iments performed (Experiments entity), and the data
recorded by the sensors (DataSample entity). Figure
2 shows the entity-relationship schema of the Data
Logger database. Each experiment is associated with
an ID, called ExpID. Therefore we have a tuple for
each experiment in the Experiments table and the as-
sociation that links the two tables is provided by Ex-
pID, which is a foreign key in the DataSample table.
Here is the list of attributes of tables with related
information. Experiments table:
• ExpID. Unique identifier of the experiment (pri-
mary key).
• Date. Starting date of the experiment.
• Time. Starting time of the experiment.
• SamplePeriod. Sample Period of the experiment.
• SensorMask. A bit-mask used representing which
transducers were active during the experiment.
• Flag. Indicates the choice of making an on-
line/off-line communication.
• Notes. Contains any notes entered by the user
when creating the experiment.
SampleDate table:
• SampleID. Unique identifier of the sample data
(primary key).
• ExpID. Unique identifier of the experiment for
which the sample belongs to (foreign key).
• SensorID. Unique identifier of the Mote in the net-
work.
• AccX. Sampled value from the x-axis accelerom-
eter.
• AccY. Sampled value from the y-axis accelerome-
ter.
• Temperature. Sampled value from the thermome-
ter transducer.
• Light. Sampled value from the light transducer.
• Humidity. Sampled value from the humidity
transducer.
• Pir. Sampled value from the Pir transducer.
• Magnetic. Sampled value from the Magnetic
transducer.
• RSSI. RSSI value of the communication between
the sink and the target Mote.
• Mic. Sampled value from the microphone.
4 IMPLEMENTATION AND
USAGE
4.1 Setting Up an Experiment
Here we describe the use of the GUI of the data logger
shown in Figure 3.
• New Experiment button. This button is used to
create a new entry in the experiments table in the
DB.
• Sampling Period text box. It allows the user to
setup up the sampling period of the transducers
readings (expressed in msec).
ADataLoggerforWirelessSensorNetwork
67
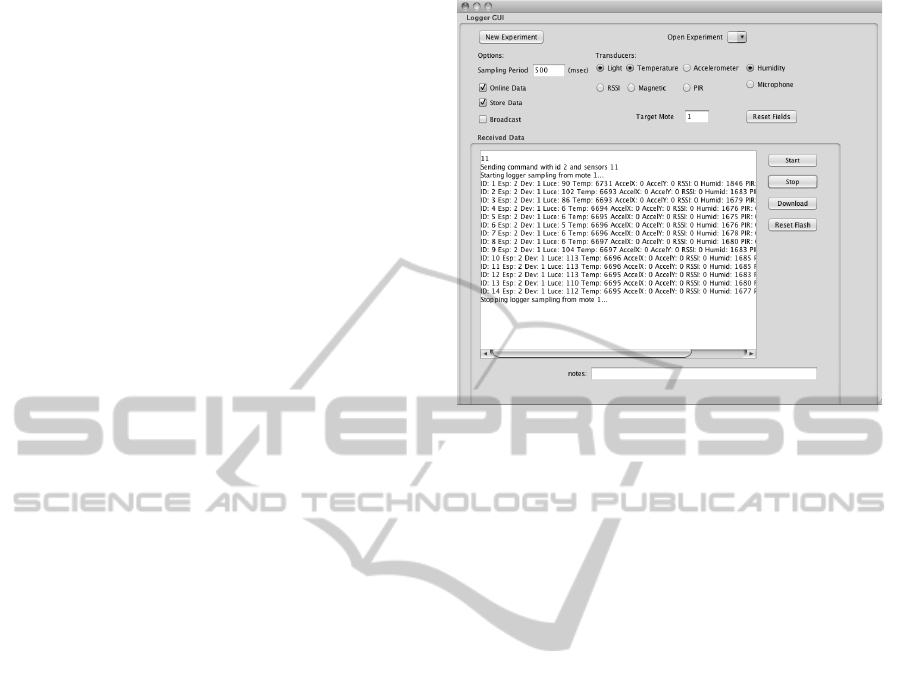
• Transducers radio buttons. Eight radio buttons
that allow the user to select which transducers ac-
tivate on the Motes during the experiment.
• Online Data check button. If selected, the data
are sent to the sink in real-time when they are ac-
quired by the target Mote.
• Store Info. If selected, the acquired data are
stored in the flash memory of the target Mote
(these two last options can be jointly checked).
• Target Mote text box. Specifies the ID of the
Mote from which to acquire data. Note that, in or-
der to avoid collisions, only one mote is allowed
if the Online Data modality is set, that is the real-
time data can be received from one mote at a time.
• Broadcast checkbox. This option is available
only for the Store Info mode and to erase the flash
memory of the motes. By checking it, the storing
of data in the flash memory, or its deletion, can be
requested contemporarily on all the motes.
• Note textbox. It allows the user to associate the
experiment entry with a textual comment.
• Command buttons Start, Stop, Download, and
Reset Flash. Once a new experiment entry has
been created, the sampling task is activated by
clicking on the Start button. As consequence, the
Mote specified in the Target Mote text-field will
start sending its acquired data and they will be
visualized in the GUI. If the Store Info modality
was set, the blue LED toggling on the Motes noti-
fies the writing of the acquired data into the flash
memory. The Stop button terminates the sampling
task. This command can also be sent in broadcast
by checking the Broadcast checkbox. To down-
load the data stored in a Mote into the database,
the button Download is used. In order to avoid
collisions, this operation is allowed for only one
Mote at a time. The green LED toggling on the
target Mote notifies the reading from the flash.
The receiveddata are stored in the DataSample ta-
ble of the database in the same order as they have
been acquired in the Mote and they are stored with
the reference to the experiment in the table Ex-
periments that contains the timestamps at which
the sampling started and the sampling frequency.
The Reset button erases the flash memory of the
Mote. This operation may take a long time and its
progress is signaled by the red LED on the Mote:
it is on during the execution of the operation and it
is turned off when it is completed. This command
can also be sent in broadcast. It is important to ex-
ecute this command in order to have always clean
data.
Figure 3: The GUI of the data logger.
5 CONCLUSIONS
In this article we have presented a data logger for
WSN that allows both real-time data acquisition
and storing on the acquired data in the flash mem-
ory of the Motes for off-line analysis. The soft-
ware is freely downloadable at www.nmis.isti.cnr.it/
gennaro/logger.zip and runs on Linux where Postgres
DBMS (www.postgresql.org) is installed. As future
developments, we aim at providing the possibility to
execute the on-line data acquisition on all the sensors
at the same time, by implementing a mechanism for
avoiding the collision of the packets.
REFERENCES
Arora, A., Dutta, P., Bapat, S., Kulathumani, V., Zhang,
H., Naik, V., Mittal, V., Cao, H., Gouda, M., Choi, Y.,
Herman, T., Kulkarni, S., Arumugam, U., Nesterenko,
M., Vora, A., and Miyashita, M. (2004). A line in the
sand: A wireless sensor network for target detection,
classification, and tracking. Computer Networks (El-
sevier, 46:605–634.
Baronti, P., Pillai, P., Chook, V. W., Chessa, S., Gotta, A.,
and Hu, Y. F. (2007). Wireless sensor networks: A sur-
vey on the state of the art and the 802.15.4 and zigbee
standards. Computer Communications, 30(7):1655 –
1695. ¡ce:title¿Wired/Wireless Internet Communica-
tions¡/ce:title¿.
Culler, D., Estrin, D., and Srivastava, M. (2004). Guest
editors’ introduction: Overview of sensor networks.
Computer, 37:41–49.
SENSORNETS2013-2ndInternationalConferenceonSensorNetworks
68

Romer, K. and Mattern, F. (2004). The design space of
wireless sensor networks. Wireless Communications,
IEEE, 11(6):54 – 61.
Tolle, G., Polastre, J., Szewczyk, R., Culler, D., Turner, N.,
Tu, K., Burgess, S., Dawson, T., Buonadonna, P., Gay,
D., and Hong, W. (2005). A macroscope in the red-
woods. In Proceedings of the 3rd international confer-
ence on Embedded networked sensor systems, SenSys
’05, pages 51–63, New York, NY, USA. ACM.
Yamamoto, H., Uchiyama, S., Yamamoto, M., Nakamura,
K., and Yamazaki, K. (2012). Development of sensor
network for ecology observation of seabirds. IEICE
Transactions, 95-D(2):532–539.
ADataLoggerforWirelessSensorNetwork
69
