
Multi-method Software Estimation Utilizing Judgment and Model
based Methods
Aldo Dagnino
ABB Corporate Research, Industrial Software Systems Program,940 Main Campus Drive, Raleigh, NC, U.S.A.
Keywords: Planning Estimates, Cone of Uncertainty, Planning Estimation Stage.
Abstract: This paper describes a multi-method approach utilized at ABB to derive size and effort estimates at the
planning stage of software development projects. The planning stage is the stage where the organization has
more insights into the project that at the initial conceptual stage. This does not mean that uncertainty is
totally eliminated but it is reduced as analysis of features has resulted in more detailed requirements. The
approach assumes that the organization conducting the estimation exercise does not have reliable historical
data that can be used to derive the estimates. A case study is presented that describes a pilot conducted in an
ABB Unit where the method has been implemented. This paper also shows how key estimation principles
have been incorporated to the methods discussed to form a comprehensive estimation process. By
implementing the methods and key principles described in this paper, an organization can begin storing
reliable historical data for future use. Judgment-based and model-based methods are used to derive size and
effort estimates. The paper shows that using different estimation methods helps the project manager to gain
better insight on the estimates and obtain a composite estimate that is more robust and reliable.
1 INTRODUCTION
In spite of all the research conducted in the software
estimation discipline, a large number of software
development organizations these days still have
enormous difficulties developing reliable size and
effort estimates that result in on-time and on-budget
delivery of their software products and with the
expected functionality and quality. There are several
reasons why this happens. First, many software
development organizations do not have a robust
software estimation process. Second, there are a
myriad of estimation methods that have been
developed and each method provides different
outputs (one estimate point, two-point interval
estimate, probability and estimate, direct effort
estimates, etc.) which may become confusing to
practitioners. Third, most software estimation tools
assume that organizations have reliable historical
data and this is seldom true. Fourth, it is not clear to
organizations how to use estimation methods when
they do not have reliable historical data. Fifth, many
organizations are not aware of the basic estimation
principles and how to present their estimates to
relevant stakeholders. Sixth, many organizations
confuse the concepts of target, estimate, and
commitment. Lastly, often organizations do not fully
understand the benefits of decoupling size estimates
from effort estimates. To address these concerns,
this paper focuses on several objectives. First, define
key software estimation principles. Second, outline
an approach to utilize different software estimation
methods. Third, define an approach to begin reliable
data collection. Finally, define an overall software
estimation process that can lead organizations
towards a high software estimation maturity.
2 ESTIMATION RESEARCH
This section presents a brief review of previous
software estimation research. Cohn (2006) provides
a useful definition of estimation and points out that
“[a] good estimate is an estimate that provides a
clear enough view of the project reality to allow the
project leadership to make good decisions about how
to control the project to hit its targets”. After
decades of research in the field of software
estimation, and despite the large number of cost
factors gathered and the rigorous data collected in
the software industry, there is a lot of uncertainty on
403
Dagnino A..
Multi-method Software Estimation Utilizing Judgment and Model based Methods.
DOI: 10.5220/0004434004030410
In Proceedings of the 8th International Joint Conference on Software Technologies (ICSOFT-EA-2013), pages 403-410
ISBN: 978-989-8565-68-6
Copyright
c
2013 SCITEPRESS (Science and Technology Publications, Lda.)

how to effectively estimate software projects. In
practical terms, the ability to estimate software
projects well depends on how much knowledge or
uncertainty exists about the project being estimated
(Laird, 2006). Estimation should focus first on
deriving size estimates and then utilize these size
estimates to compute effort and cost estimates
(Galorath, 2006); (Laird, 2006).
Software estimation has different stages and they
can be aligned with the development lifecycle
stages. The initial estimation occurs at early stages
of the lifecycle and this is a stage where uncertainty
is still quite high. Planning estimation occurs when
the product is better defined and more detailed
requirements are known, but there is still a high
degree of uncertainty (Minkiewicz, 2009). During
the development lifecycle stage, a lot of the
uncertainty has been removed and the preliminary
commitment estimates can be made. This paper
focuses on helping a project manager to develop
estimates at the planning stage of the development.
Estimates are a communication vehicle that
allows the whole organization to have a meaningful
dialogue about the project and its significance to the
organization (Muir, 2009). The process of approving
an estimate involves two very distinct sides in the
organization, the business side and the technical
side. The goal is to balance both the business and
technical perspectives. A friction point arises over
the gap between the business’ target for the project
and the technical staff’s estimate of project
completion. The gap between the two views
represents the organizational risk. Frequently, the
organization resolves the organizational risk by
adopting the target as the plan. For many
organizations, the debate over the gap between the
target and the estimate can degenerate into strife, or
a “negotiation”, instead of an open discussion. This
can “poison” the project and make the organization
lose sight of the “estimation process” and focus only
on the end result of the estimation process. This
means that the organization focuses on the certainty
of the estimation outcome, downplaying and de-
emphasizing the risks and uncertainty that could
prevent success. This situation short-changes the
organization by taking away the opportunity to
develop an in-depth understanding of the project in
terms of the risks, rewards, and benefits.
As seen above, conflict arises because of the
difference between the “target” and the “estimate”.
This situation pits the project planning team against
the business management team. Frequently, Senior
Management seeks to resolve the situation by
imposing the target on the project planners.
A “savvy” Project Manager knows how to utilize
the estimate to promote a business discussion
focused on the gap between the estimate and the
organization’s target. At the end, this discussion will
serve to make the organization aware of the level of
risk in the project and to frame a discussion around
how to creatively mitigate the project risk and thus,
the gap between the target and the estimate.
A good presentation of an estimate includes the
description of the estimate’s scope, the estimation
methods utilized, the accuracy, and the inherent
uncertainty of the estimate. Planning estimation is
most successful when multiple methods and
different people are employed to develop the
estimate. Convergence in the estimation is an
indication of the accuracy of the estimate and it also
provides higher level of confidence in the estimate.
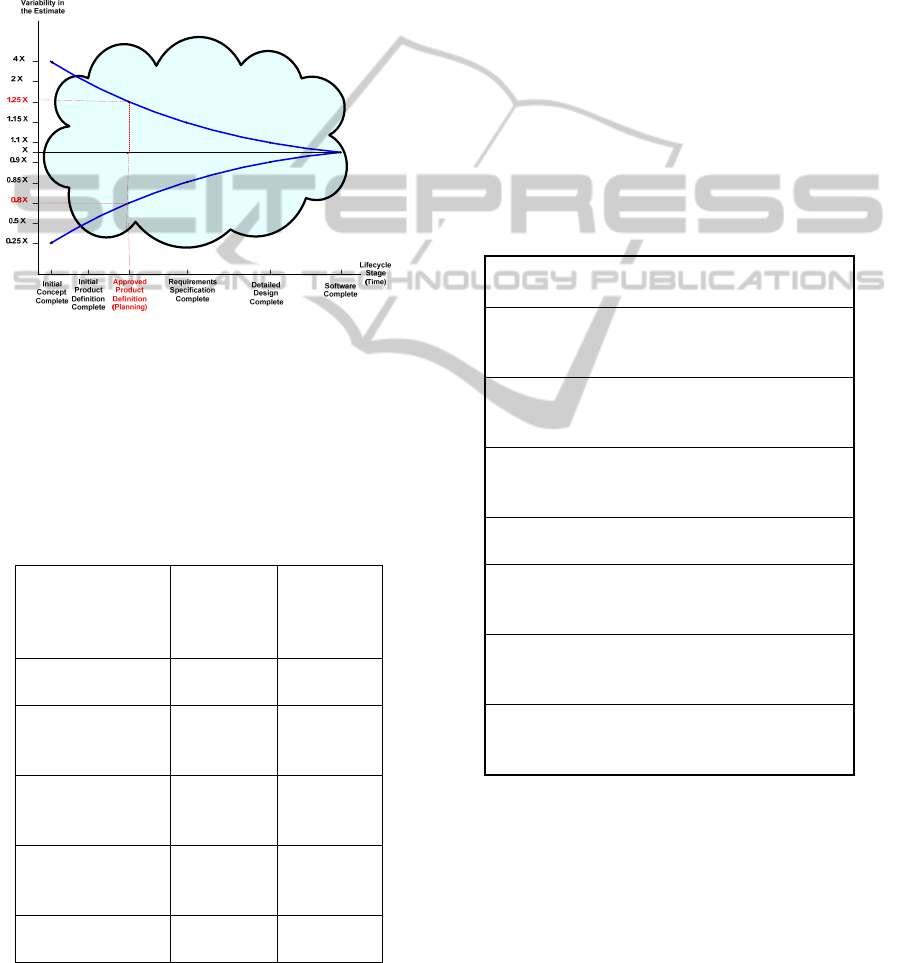
A fundamental concept in software estimation is
the Cone of Uncertainty (McConnell, 2006). The
Cone of Uncertainty represents the uncertainty
intrinsic to any project and shows how estimation
should become more accurate as the development of
a product moves from early development lifecycle
stages towards later stages as shown in Figure 1. The
“Y” axis in Figure 1 shows the degree of error in the
estimate and it is closely correlated with the
uncertainty that exists in every project. Estimates
created early in the development lifecycle have a
higher degree of uncertainty and estimates improve
rapidly after the first third of the project. It is
important to notice that the most important business
decisions related to the software project are made at
the time when there is minimum knowledge about
the project and hence maximum uncertainty
(McConnell, 2006). The Cone of Uncertainty
represents the best-case accuracy that is possible to
have in software estimates at different points in a
project. The Cone represents the error in estimates
created by skilled estimators. If the project is not
well controlled or the estimators are not very skilled,
estimates can fail to improve and the uncertainty
instead of being a well defined Cone, is a Cloud that
persists until the end of the project as shown in
Figure 1. Hence, the Cone of Uncertainty is
narrowed by making decisions that remove
uncertainty from the project. Studies show that
estimators who start their estimates with single point
estimates often do not adjust their minimum and
maximum values sufficiently to account for the
uncertainty (McConnell, 2006).
The Cone of Uncertainty should be used to
derive estimates taking into consideration the
software development lifecycle stage. A way in
which the Cone of Uncertainty can be utilized is to
ICSOFT2013-8thInternationalJointConferenceonSoftwareTechnologies
404
estimate a most likely size and then use the factors
in Table 1 (which are mapped to the Cone of
Uncertainty) as a guide to compute estimate ranges.
It is important that the estimation team carefully
analyzes at which stage on the development lifecycle
the project is when the estimation exercise is
conducted. This is important to properly select the
error factors from the Cone of Uncertainty that will
be utilized.
Figure 1: Planning Stage in the Cone of Uncertainty.
It is important to notice that even if an organization
has reliable historical data for estimation purposes,
there are points in the estimation process that still
require some “subjectivity” and selecting an
appropriate development lifecycle stage is one of
these “uncertain” points.
Table 1: Cone of Uncertainty factors.
Development
Phase
Possible
Error
Low side
Possible
Error
High
Side
Initial concept
complete
0.25 * X 4.0 * X
Initial product
definition
complete
0.5 * X 2.0 * X
Approved
product
definition
0.8 * X 1.25 * X
Requirements
specification
complete
0.85 * X 1.15 * X
Detailed design
complete
0.9 * X 1.1 * X
3 PLANNING ESTIMATION
OF A CASE STUDY
In this section we will discuss a real-world case
study conducted within a software development
Business Unit (BU) of ABB. The focus of this case
study is to outline the process of developing
planning estimates for software development
projects. The objective of the software development
project at the BU was to enhance the functionality of
the User Interface of an existing software substation
system that allows a Utilities Engineer to define the
settings of intelligent electronic devices (IEDs) of a
substation in a power distribution grid. Table 2
below shows the list of needed enhancements
identified to be developed in the software substation
system as defined at the initial stage of the project.
Table 2: Customer needs for the substation software
system enhancement.
Defined Customer Needs for Substation
System Enhancement
A user in a Utility needs to efficiently
define the settings in intelligent electronic
devices (IEDs) in substations
A user in a Utility needs to save the
settings of intelligent electronic devices
(IEDs) in feeders in substations
A user in a Utility needs to efficiently load
the values of intelligent electronic devices
(IEDs) of feeders in a substation
A user in a Utility needs to edit the settings
of intelligent electronic devices (IEDs)
A user in a Utility needs to efficiently
manage the feeders' settings in intelligent
Electronic devices (IEDs) in substations
A user in a Utility needs to print a
simplified setting report for a selected
intelligent electronic device (IED)
A user in a Utility needs to export the
settings of intelligent electronic devices
(IEDs) in feeders
Utilizing the customer’s needs presented in Table 2
the market requirements for the system can be
derived and they are presented in Table 3. The case
study presented in this paper focuses on showing
how several estimation methods can be employed to
estimate the size and effort to develop the market
requirements shown in Table 3. As this BU did not
have any reliable historical data to apply to this
specific project, the following estimation methods
were employed to derive the initial estimates for this
Multi-methodSoftwareEstimationUtilizingJudgmentandModelbasedMethods
405

enhancement project: (i) Planning Poker; (ii)
Modified Wideband Delphi method; (iii) Monte
Carlo Simulation.
Table 3: Market requirements for the substation software
enhancement.
Market
Requirement/No.
Description of Market
Requirement
1 - Define IED
Settings
The IED Configuration System
shall allow the Utilities Engineer
to define IED settings and enter a
description of each setting
2 - Save IED
Setings
The IED Configuration System
shall allow the Utilities Engineer
to save IED settings
3 - Load IED
Settings
The IED Configuration System
shall allow the Utilities Engineer
to load IED settings
4 - Edit IED
Settings
The IED Configuration System
shall allow the Utilities Engineer
to edit IED settings
5 - Manipulate IED
Settings
The IED Configuration System
shall allow the Utilities Engineer
to manipulate IED settings
6 - Print IED
Settings
The IED Configuration System
shall allow the Utilities Engineer
to print IED settings
7 - Export IED
Settings
The IED Configuration System
shall allow the Utilities Engineer
to export IED settings to other
systems
3.1 Planning Poker Method
The Planning Poker is a top-down and structured
expert judgment estimation method and it is useful
during the planning stage of estimation to provide a
high-level perspective of the project. This method
classifies the sizes of the market requirements in the
work breakdown structure (WBS) relative to a
selected baseline market requirement. After the sizes
of the elements in a WBS have been estimated, it
calculates the effort for each market requirement
based on the team velocity. Team velocity refers to
the amount of time a development team employs to
implement the points associated with the baseline
market requirement. The following steps are
followed to develop the estimates shown in Table 4.
1) After the estimation team has identified the main
market requirements of the WBS, a “baseline
market requirement” is selected and it is used to
compare the sizes and complexity of the
remaining market requirements in the WBS. If
the organization has reliable historical data, the
baseline market requirement can be selected
from the historical database. If not, as in our
present case, the estimation team selects the
baseline market requirement by identifying a
market requirements in the WBS that seems of
medium size and with medium complexity, and
assigns it a number (market requirement points)
in the middle of the range that the team expects
to use. The series of market requirements points
can be selected in many ways, but the following
set of points has been successfully used in
practice: (1, 2, 3, 5, 8, 13, 20, 30, 40, 50, 70, 90,
and 100) [1]. After the baseline market
requirement has been selected and assigned a
number of points, the team discusses and
documents all associated assumptions (see Table
4, first row, and columns 1, 2, and 6).
2) The remaining market requirements in the WBS
are now compared in terms of size and
complexity with the baseline market requirement
and assumptions are documented for each market
requirements (see Table 4, all remaining rows,
and columns 1, 2, and 6).
3) Once the estimation team has completed
discussions and assigned points to each element
of the WBS, the team has a discussion to ensure
that major tasks (such as develop system
architecture, integration testing, system
documentation, etc.) have been considered. If
there is any task remaining, add this task to the
elements of the WBS and estimate its size in
market requirement points (no additional tasks
added in Table 4).
4) As previously discussed, the team velocity in the
project is the time that the development team
requires to develop a certain number of market
requirement points. It is recommended to use
past historical data if it is available in the
organization and is considered as reliable.
Otherwise, as is the current case, the team can
estimate the team velocity based on past
experience. In our example the team velocity is
considered as 2 person-days per market
requirement (see Table 4, column 4). Estimates
of velocity should be given as a range that
reflects the uncertainty inherent in the estimate
as shown by the Cone of Uncertainty. It is
important to notice that team velocity is a critical
component as the project evolves. For the most
part, the points assigned to the market
requirements of the WBS should not be adjusted
throughout the project. The equalizer is the team
velocity and this one is the one that can be
changed.
5) Finally, depending at what stage in the
development lifecycle the project is at, use the
Cone of Uncertainty shown in Figure 1 and the
ICSOFT2013-8thInternationalJointConferenceonSoftwareTechnologies
406

values of Table 1 to determine the lower and
upper range values for the effort estimates. In our
case, the lifecycle stage was the “Approved
Product Definition” or “Planning Stage” and
hence the lower bound multiplier for velocity is
0.8 and the upper bound is 1.25 (see Table 4
columns 3 and 5).
6) With these data points, the estimation team can
then add all the effort numbers and obtain the
overall project effort (see Table 4 and row 9).
Table 4: Planning Poker Estimates.
Market
Req.
MR
Points
(size)
Velocity
p-days
Best
Case
(effort)
Velocity
p-days
Most
Likely
(effort)
Velocity
p-days
Worst
Case
(effort)
1 5.00 8.00 10.00 12.50
Baseline
MR
2 3.00 4.80 6.00 7.50
3 8.00 12.80 16.00 20.00
4 8.00 12.80 16.00 20.00
5 13.00 20.80 26.00 32.50
6 8.00 12.80 16.00 20.00
7 5.00 8.00 10.00 12.50
Totals 50.00 80.00 100.00 125.00
3.2 Size Wideband Delphi Method
The Wideband Delphi is a structured group
estimation technique. This technique, if
appropriately used, can be employed by higher
maturity software development organizations. It is
important that historical data is stored, that
estimating size is kept at the forefront and that effort
and cost estimates are derived from the size
estimates. Wideband Delphi is considered a bottom-
up and structured expert judgment estimation
method and it is very useful at the planning stage of
the development lifecycle, where size is estimated
and effort is computed based on team velocity. This
technique serves to discuss a group’s estimates and
improve them by holding structured meetings with
the help of a facilitator. The following steps are
followed to develop the estimates shown in Table 7.
1. A Delphi facilitator works with the estimation
team to define the baseline market requirement
that is used to compare each of the market
requirements in the project. If there is a historical
list of accepted baseline market requirements
classified based by their type (i.e. functional
algorithmic, functional user interface, functional
database related, non-functional, hardware, etc.)
then this list will be used with the associated
market requirement point sizes and assumptions.
Moreover, historical data can provide the typical
effort that a development team takes to
implement one market requirement point. If no
historical data exists, the estimating team may
decide to identify the baseline market
requirement that will be used to compare the
size(s) and complexity(ies) of the market
requirements to be estimated. The team also
needs to estimate the level of effort (in
person/time) that a market requirement point
takes to be implemented. Table 7 shows market
requirement 1 as the baseline feature shaded.
2. The Delphi Facilitator presents the group of
experts with the description of the selected
baseline market requirement. The assumptions
made for the baseline market requirement are
also discussed.
3. The Delphi Facilitator presents the group of
experts with the description of the baseline
market requirement in the WBS to be estimated,
and guides the team into comparing the market
requirement being estimated with the size and
complexity of the selected the baseline market
requirement. Each team member, in an
anonymous way, provides a single most likely
estimate of the size of the market requirement
and arguments or assumptions behind the
estimate. This step is followed for each of the
market requirements identified in the WBS.
4. The Facilitator prepares a summary of the size
estimates showing the different estimates and
presents it to the group for discussion. The
participants see how their estimates compare
with other estimators’ estimates.
5. Estimators vote anonymously on whether they
want to accept the average size estimate as the
Most-likely estimate for each market
requirement. If estimate is accepted then
estimators document assumptions behind this
estimate. If any of the estimators vote no, they go
back to step 3.
6. Estimators discuss Most-likely estimate and vote
to provide a Best-case (BC), Worst-case (WC)
size estimates for the market requirement (see
Table 7, columns 2-4, and rows 2-8).
7. For each market requirement, we compute the
Expected Case Estimate (ECE) with the
following equation (1), where (MLC) is the most
likely case estimate:
Multi-methodSoftwareEstimationUtilizingJudgmentandModelbasedMethods
407

ECE = [BC + ( 3 * MLC) + (2 * (WC)] / 6 (1)
Studies have shown that estimators using the
Wideband Delphi method tend to produce optimistic
“Most-likely” estimates, which can yield to
optimistic overall estimates. Equation (1) is a
slightly altered version to consider “optimism” (see
Table 7, column 7).
8. For each market requirement in the WBS we
compute the Standard Deviation (STD) using
equation (2) (see Table 7, column 5).
STD = [WorstCase – BestCase] / 1.4 (2)
9. Using the divisor of 1.4 statistically implies that
the estimators’ ranges between Best-case and
Worst-case will include the actual outcome of
the estimate 50% of the times. To increase the
percent to 70% of the times, the divisor in the
equation must be changed to 2.1 instead of 1.4.
Table 5 shows the divisors to be used when
calculating standard deviations. Compute the
Variance (VAR) using equation (3) and Total
Variance (TVAR) using equation (4) (see Table
7, column 6).
VAR = [STD] ** 2 (3)
TVAR =
∑
i
(4)
10. Compute the Aggregate Standard Deviation
(ASTD) using equation (5) (see Table 7, row 10).
ASTD = [TVAR] ** 0.5 (5)
11. Compute the 90% Percentage Confident
Estimate (PCEST) using equation (6) (see Table
7, row 11).
PCEST = [ECE + (1.28 * ASTD)] (6)
Table 5: Standard deviation factors.
If this % of actual
outcomes fall
within estimation
range . . .
then use this factor
as a divisor in the
STD calculation
10% 0.25
20% 0.51
30% 0.77
40% 1
50% 1.4
60% 1.7
70% 2.1
80% 2.6
90% 3.3
99.70% 6
Table 6 shows the percentage confidence based
on use of aggregate standard deviation. This means
that the PCEST is expected to be accurate with 90%
confidence by using the factor 1.28
Table 6: Percentage confidence factors.
Percentage
Confidence
Calculation
2% EC – (2 * STD)
10% EC – (1.28 * STD)
16% EC – (1 * STD)
20% EC – (0.84 * STD)
25% EC – (0.67 * STD)
30% EC – (0.52 * STD)
40% EC – (0.25 * STD)
50% EC
60% EC + (0.25 * STD)
70% EC + (0.52 * STD)
75% EC + (0.67 * STD)
80% EC + (0.84 * STD)
84% EC + (1 * STD)
90% EC + (1.28 * STD)
98% EC + (2 * STD)
12. Compute overall effort estimate by multiplying
the team Velocity (see Table 7, row 12) by the
PCEST (see Table 7, row 13).
13. Table 7 shows the results of the estimates carried
out by the Business Unit estimation team using
the modified Wideband Delphi method
Table 7: Size Wideband Delphi results.
Req
BC
MLC
Size
WC
Size STD VAR ECE Size
1 3 5 7 3 13 5
2 1 3 5 3 25 3
3 3 8 10 5 51 8
4 5 8 9 3 33 8
5 5 13 15 7 115 12
6 3 8 10 5 51 8
7 5 5 7 1 5 6
Totals 25 50 63 292 50
ASTD
17.08
PCEST
72.03
Team
Velocity
0.5
req
pts
Overall
Effort
Est 90%
Conf.
144
pers
-
days
ICSOFT2013-8thInternationalJointConferenceonSoftwareTechnologies
408

3.3 Monte Carlo Method
Monte Carlo is a stochastic technique based on the
use of random numbers and probabilistic approaches
that can also be used to derive initial estimates.
Monte Carlo methods have been used to model
business phenomena that have high degree of
uncertainty. The following steps were utilized to
derive the estimates presented in Table 8 utilizing
the Monte Carlo method.
1. Table 8 is constructed using the size estimates
identified in rows 2-8 and columns, 2, 3, and 4
from Table 7.
2. Inputs were generated using random numbers
and the Triangular Probability Distribution for
each Feature using the three inputs Best, Most
Likely, and Worst cases and mapping them to the
Triangular Distribution. Triangular Distribution
random entries were generated for a total of
5,000 simulations for each market requirement.
As shown in the results of the Monte Carlo
simulation, the median size for the project was
46.2 market requirement points, with 10% of the
observations as 41.6 market requirement points
and with 90% of the observations with a highest
value of 50.2 market requirement points. Figure
2 shows the summary of the results of the Monte
Carlo estimation.
Figure 2: Monte Carlo size estimation output.
Once the Monte Carlo simulation calculates the size,
the team Velocity is utilized and then the overall
expected effort with 90% confidence is (2 person-
days*50.2 market requirement points) which results
in 100.4 person-days effort.
3.4 Analysis of Results
Table 8 summarize the results of effort estimates
computed by all three methods. All three methods
converge in the overall size of the project being 50
market requirement points.
Table 8: Summary of results.
Estimating
Method
TotalEffortin
person‐days
ML
PlanningPoker 100
WidebandDelphi 144
MonteCarlo 100.4
Average 114.8
The Planning Poker method estimated a total of 100
person-days to complete the project. Utilizing the
Wideband Delphi method the effort estimate is 144
person-days to complete the project with 90%
confidence level. Finally, utilizing the Monte Carlo
simulation method, the total estimated effort to
complete the project is 100.4 person-days with 90%
confidence level. Ultimately, the approach followed
is to compute the average estimate utilizing all three
estimation methods and the final result is 115
person-days to complete the project.
4 CONCLUSIONS
The approved product definition or planning stage of
the development lifecycle represents a point in the
product where the software development
organization has an understanding on the market
requirements that will be included in the first release
of a software product. The planning stage typically
occurs when the organization has completed the
initial concept and product definition and a general
understanding of the product functionality is
achieved. Although at the planning stage there is less
uncertainty in the project that at initial stages, still
the level of uncertainty is considerable. There is an
added pressure at this stage because typically
development budgets are confirmed and initial
internal company commitments are made.
Utilizing several estimation methods is
especially important at the planning stage as the
organization can observe the project from two very
different perspectives bottom-up and top-down. It is
then important to utilize more than one estimation
method to achieve robust size and effort estimates. It
is also especially important to not only utilize a
variety of methods but also to fully embrace key
estimation principles such as not confusing estimates
Multi-methodSoftwareEstimationUtilizingJudgmentandModelbasedMethods
409

with targets, allowing people that will perform the
work develop the estimates, identifying and
documenting the estimation assumptions, and
providing estimates as a range of values and a
percent confidence, among others. It is essential to
start the process by estimating the project size and
then utilizing the team velocity to compute the effort
and the project cost. The principle of the Cone of
Uncertainty is a cornerstone to understand how
estimates should be calculated, as it defines the
multipliers to be utilized which are associated with
the stage of the development lifecycle of the project.
The methods described in this paper can be utilized
by organizations that do not have reliable historical
data to derive the estimates. If an organization has
reliable historical data, these methods can also be
utilized and will provide even better results. The
methods and principles utilized in this paper do not
require the implementation of costly software tools.
Through the estimation process the project
manager will have the necessary arguments to
establish a constructive collaboration between the
business target position and the technical perspective
of the estimation. The planning estimate represents a
unique opportunity to be the communication vehicle
that allows the whole organization to have a
meaningful dialogue about the business objectives of
the project and the development intricacies and
effort required to produce the final product. This
dialogue is important to reduce the risk to the
organization.
REFERENCES
Cohn, M., 2006. Agile Estimating and Planning, Prentice
Hall, Robert C. Martin Series.
Dagnino, A. 2013. Estimating Software-Intensive Projects
in the Absence of Historical Data, 35
th
International
Conference on Software Engineering (ICSE 2103),
San Francisco, Ca.
Galorath, L. A., 2006. Software estimation - an
introdution, in Proceedings of the Second IEE
Conference on Automotive Electronics, pages 101–
118.
Genuchten, M. V., 1991. Why is Software Late? An
Empirical Study of the Reasons for Delay in Software
Development, IEEE Transactions on Software
Engineering, vol. 17, no. 6, pp. 582-590, June.
Jørgensen, M. 2004. Top-down and bottom-up expert
estimation of software development effort. Journal of
Information and Software Technology, 46(1):3–16.
Jørgensen, M., Boehm, B., and Rifkin, S., 2009. Software
development effort estimation: Formal models or
expert judgment?, IEEE Software, vol. 26, no. 2,
pp.14–19.
Jørgensen, M. and Grimstad, S. 2008. Avoiding irrelevant
and misleading information when estimating
development effort. IEEE Software, 25(3):78–83.
Laird, L., 2006. The limitations of estimation, IT
Professional, vol. 8, no.6, pp. 40–45.
Layman, L., Nagappan, N., Guckenheimer, S., Beehler, J.,
and Begel, A. 2008. Mining software effort data:
preliminary analysis of visual studio team system data.
In Proceedings of the 2008 International Working
Conference on Mining Software Repositories, pages
43–46.
McConnell, S., 2006. Software Estimation: Demystifying
the Black Art (Best Practices (Microsoft)), Microsoft
Press.
Minkiewicz,A. F., 2009. “The evolution of software size:
A search for value” CrossTalk: The Journal of
Defense Software Engineering, March-April, pp. 23-
26.
Muir, D., 2009. Estimation for the savvy project manager.
http://¬www.spc.ca/-index.htm.
Robertson, S. and Robertson, J., 1999. Mastering the
Requirements Process, Addison-Wesley.
ICSOFT2013-8thInternationalJointConferenceonSoftwareTechnologies
410
