
Discovering Potentials in Enterprise Interface Design
A Review of Our Latest Case Studies in the Enterprise Domain
Christian Lambeck, Dietrich Kammer and Rainer Groh
Institute of Software and Multimedia Engineering, Chair of Media Design,
Technische Universität Dresden, 01062 Dresden, Germany
Keywords: Enterprise System, ERP, Graphical User Interface, Usability, Case Studies.
Abstract: User interfaces in enterprise systems are primarily based on visualizations such as tables and forms, which
are state-of-the-art since the middle of the 1990s. Additionally, most information is presented in a textual
way and offers little capabilities to change the mode of presentation or the level of detail. The authors argue
that these deficiencies are a major reason for existing usability problems related to the graphical user
interface. Hence, this contribution presents four case studies, which aim to establish innovative visualization
and interaction modalities in the field of enterprise systems.
1 INTRODUCTION
According to the worldwide enterprise software
revenue of about $260 billion in 2011, enterprise
applications are an important economic sector.
(Gartner Inc., 2011) With regards to a survey
conducted in Germany in 2009, ERP systems are
used in more than 92% of all German industrial
enterprises with more than 50 employees. (Konradin
Business GmbH, 2009) These numbers give a first
impression of the high diffusion rate of ERP systems
and the resulting amount of users. Hence, existing
usability problems – but also their solutions – would
affect a broad user group and should be seriously
taken into account.
However, latest research in the field of enterprise
resource planning (ERP) has primarily focused on
technological concepts to keep up with a steadily
increasing complexity of business processes and the
volatile market needs. Examples of these
technological advancements are performance
optimizations (Tertilt and Krcmar, 2011), service-
oriented architectures (Seth et al., 2011) or cloud-
based business applications (Ragusa and Puliafito,
2011). Therefore, it is not surprising, that ERP
systems are primarily chosen due to their
functionality, performance and migration aspects
instead of usability and ergonomic criteria.
(intelligent systems solutions GmbH (i2s), 2011)
In contrast to this technology-focused research
and development, innovation concerning human-
computer-interaction in the field of ERP is present,
but significantly less considered. Whereas numerous
research papers in the field of user satisfaction and
usability have focused on the participation of users
in the implementation process, top management
support, self-efficacy or perceived usefulness of the
system, the explicit investigation of usability barriers
located in the graphical user interface (UI) is rarely
discussed. Most of this research is focused on
Critical Success Factors (CSF) to model user
satisfaction (e.g. (Mitakos et al., 2011; Bin et al.,
2010; Ozen and Basoglu, 2006)), but misses the
explicit incorporation of the graphical user interface
as a separate, influencing factor. Only few
contributions are at least partially related to interface
concerns. These papers identified critical
deficiencies in the system usage, such as the
identification of and the access to the right
functionality, support in transaction execution,
system output limitations, terminology and finally
the overall system complexity. (Topi et al., 2005)
Furthermore, user guidance, learnability and
minimal memory load have been stated as important
for the user-system collaboration. (Calisir and
Calisir, 2004)
Although these findings date back several years,
they revealed significant deficiencies in user
interface design for ERP systems, that still exist
today and which demand for further improvements
in this field. Whereas the majority of current
enterprise systems still utilizes modalities that are
state-of-the-art since the middle of the 1990s (e.g.
forms, tables, standard diagrams, mouse and
99
Lambeck C., Kammer D. and Groh R..
Discovering Potentials in Enterprise Interface Design - A Review of Our Latest Case Studies in the Enterprise Domain.
DOI: 10.5220/0004442000990104
In Proceedings of the 15th International Conference on Enterprise Information Systems (ICEIS-2013), pages 99-104
ISBN: 978-989-8565-61-7
Copyright
c
2013 SCITEPRESS (Science and Technology Publications, Lda.)

keyboard interaction, cp. (SAP AG, 2012)), the
potentials which arise from other domains – such as
interactive and scalable visualizations or multi-touch
and tangible interaction – are not considered so far.
On the one hand, this paper introduces the
appliance of innovative visualizations instead of the
established text-based information presentation. On
the other hand, latest interaction modalities such as
tangible and multi-touch interaction are applied to
chosen enterprise scenarios. The authors argue that
these concepts are able to significantly contribute to
an intuitive system access and furthermore to ease
the handling of enterprise systems.
2 CASE STUDIES
This section is dedicated to concepts and prototypes
which have been created to mitigate existing barriers
in enterprise system usage. In complement to the
previously identified and UI-focused user needs
from the related work, we conducted a survey of
small and medium sized enterprises in a federal state
of Germany. The 58 participants were belonging to
several industry branches such as automotive,
chemistry or mechanical engineering and used their
ERP system for purposes such as article
management, customer data or storage management.
In this study, we investigated several user interface
aspects such as task-oriented visualizations, views
for detail and overview, faceted browsing and
semantic search, 3D views on processes and
facilities as well as multi-touch devices. (Lambeck
and Leyh, 2012)
The survey revealed that a major problem exists
in the insufficient availability of task-oriented
visualizations. This category includes the
representations of enterprise information in a visual
way in contrast to the primarily textual form known
today. Thereby, the visual appearance allows for an
advanced comprehension of temporal or topological
correlations of information sets. The marginal
availability of alternative visualizations in current
ERP applications might be one of the reasons for the
high responsiveness.
Similar, but less significant results have been
observed for the paradigm of detail and overview.
Users wish to adjust the level of detail according to
their needs, which are driven by the experience and
knowledge as well as the current task. Existing ERP
systems seem to support this feature inappropriately,
as they permanently offer a fixed and detailed view
on the information space. The remaining aspects of
faceted browsing and semantic search, 3D-views on
processes and facilities and especially multi-touch
devices received significantly less popularity.
The following section presents concepts and
prototypes, which address the aforementioned
aspects. The case studies cover scenarios in the
fields of manufacturing, real-time supply chain
management (RT-SCM), advanced planning and
scheduling (APS) and finally mobile business
intelligence (BI). Each concept utilizes advanced
visualization and/or interaction capabilities.
2.1 Graph-based Scheme
The bill of materials (BOM) is a central element in
manufacturing-related ERP systems and lists all
materials, resources and operations, which are
needed to fabricate the final product. The BOM
seems to be very appropriate to illustrate the
dependencies of the final product, its required raw
materials, their intermediate goods and the
conjunctive operations in a visual manner. As a basis
for the following concept, documentations from
student workshops were taken into account. Herein,
students from a business informatics course had to
solve specific tasks in a productive case study. As a
result, textual instructions and screen casts had been
created that acted as an indicator for potential
usability problems for this concept. The demand for
user guidance could be approved as a major
challenge in this scenario. During the analysis of the
textual protocols and the corresponding videos, the
following problems have been observed:
several (obviously unrelated) windows are
opened simultaneously, which caused
confusion
awareness of the current workflow status is
missing
incorrect production orders due to missing
transaction summaries
aspect-oriented views to support the user’s
process comprehension and awareness are
missing (e.g. for time, cost, progress and
availability)
To address these issues, a prototype has been created
that offers a visual and interactive BOM. Hence, all
information of the manufacturing order is accessible
via the BOM. Thereby, it can be used as a central
entry point to guide the user to the underlying and
more detailed system forms. In contrast to current
tabular presentations, the concept offers an
interactive graph showing the dependencies via
edges, availability information via a colour scheme
and an adjustable level of detail. Furthermore, three
information views for time, cost and progress are
ICEIS2013-15thInternationalConferenceonEnterpriseInformationSystems
100
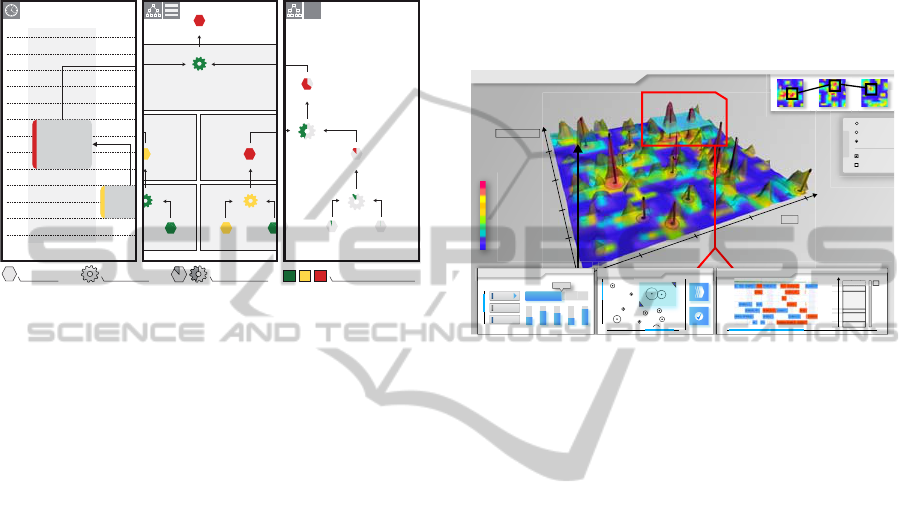
offered, which can be combined as desired.
Although the interactive BOM is still in a
prototypical status, it indicates first potentials of
task-oriented visualizations and a concept for detail
and overview. The three different views of an
exemplary BOM are illustrated in figure 1.
Figure 1: Concept of the interactive bill of materials
showing three different levels of detail (Lambeck,
Kirchner, et al., 2012).
2.2 Spatial Data Landscape
Many business processes, which are currently still
characterized by linear step-by-step dialogs, are
going to change to interactive and simulation based
approaches. (Lambeck, Schmalzried, et al., 2012)
This allows for the introduction of new interface
concepts in the field of Supply Chain Management
(SCM). The proposed dialog structure of this
concept is as follows:
After the adjustment of initial calculation
parameters for an overall optimization objective
(e.g. maximized profit margin, minimal profit
margin with restocking, meeting delivery dates), the
system generates a whole result set at once by
utilizing up-to-date multi-core and in-memory
architectures. Afterwards, the emerging set of
planning alternatives is jointly presented in a
summarized visualization in the form of a data
landscape as illustrated in figure 2. Previous
concepts use a series of forms in a sequential user
dialog to present the resulting schedules. The major
benefit of the data landscape is an explicit and direct
comparability of the calculated planning
alternatives. Whereas conventional systems usually
illustrate the simulation results in a tabular manner,
the data landscape approach has the ability to give
an impression of the result set’s quality at once.
Each peak represents a concrete production plan,
whereas plans with similar properties can be found
within the same area of the landscape. The height of
the peaks is determined by Key Performance
Indicators (KPI), which illustrate the production
plan’s degree of optimization objective fulfilment.
For the refinement of selected and promising
production schedules, the user selects the desired
region of interest (cp. figure 2, cyan rectangle). The
results are getting more and more accurate from one
iteration to the next and the user is continuously
approaching the most suitable plan.
Figure 2: User interface of the SCM system with spatial
data landscape (top) and detailed planning schedule
(Gantt-chart, bottom right) (Lambeck, Schmalzried, et al.,
2012).
2.3 Tangible Floor Plan
Nowadays, production planning is customarily based
on spread sheets supported by planning and
simulation tools that are limited to textual or
diagram output. (Gissrau and Rose, 2011) Some
tools visualize the planned tasks as a Gantt-chart, but
direct interaction is not supported. A user’s routine
production planning workflow basically consists of
two steps: (1) planning of upcoming processes with
the help of optimization algorithms and (2) handling
of deviations or interruptions during runtime. The
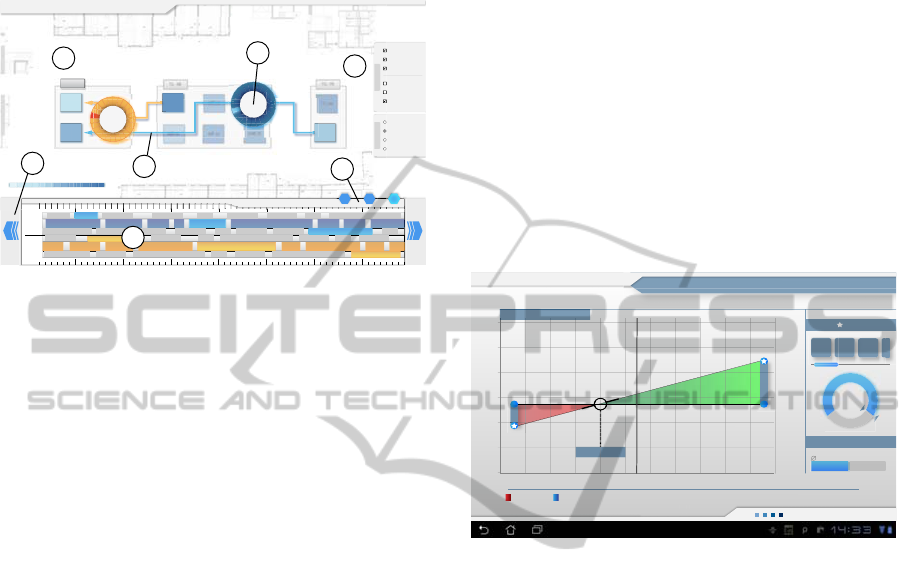
suggested user interface is based on a floor plan that
depicts the machines at their topological positions
instead of the conventional textual presentation (see
figure 3, no. 1). The machines have incoming and
outgoing connections to visualize the material flows
with regard to the underlying manufacturing process.
Current and upcoming tasks for selected machines
are visualized in the interactive Gantt-charts
beneath. On top of these views, and in addition to
standard touch gestures, tangible objects on a
tabletop system are used for selection and
adjustment tasks (see figure 3, no. 6).
As soon as the user starts dragging a process in
the Gantt-chart, he or she needs all relevant
information about the resulting consequences
immediately. The user’s increased awareness of the
Material Resource Partial Costs Availability Index
rial 1.2.2 Raw Material 1.3.1 Raw Material 1.3.2
Intermediate 2.1.4
Operation 2.2
Intermediate 3.1.2
Operation 1.3
4458
3100
806
500
3140 275
d
iate 2.1.2 Intermediate 2.1.3
Final Product
Operation 3.1
Raw Material 1.1.2
a
tion 1.1
Raw Material 1.2.1 Raw Mater
i
Operation 1.2
€
00:00
00:20
00:40
01:00
01:20
01:40
02:00
02:20
02:40
03:00
03:20
03:40
04:00
RESOURCE A RESOUR
Operation 2.1
Operati
o
Condensed & Time Detail & Stage Detail & Cost
Resource Ulizaon
Time
Show Numeric Values
VIEW SETTINGS
Show Sampling Points
Wireframe
Solid Surface
Transparency
APlansOpt ADVANCED PLANNING | SCHEDULING | OPTIMIZATION
Min
Max
PARAMETERS
Margin
Quality
Flexibility
10 100
60
OBJECTIVE | Parameter Sengs
12 34 5
1
2
3
R1
R2
R3
R4
R5
R6
R7
RESULT| Sampling Point Evaluaon
Parameter 5
Parameter 3
Parameter 2
0,11
Parameter 1
MARGIN
QUALITY
DEADLINE COMPLIANCE
FLEXIBILITY
0,20
0,09
0,39
0,11
DEMAND FULFILLMENT
0,90
EXECUTE|Selecon
DiscoveringPotentialsinEnterpriseInterfaceDesign-AReviewofOurLatestCaseStudiesintheEnterpriseDomain
101
impacts is a crucial prerequisite for subsequent and
expedient planning decisions. To prevent the user
from constructing inconsistent states, the application
supports the user by highlighting conflicts.
Figure 3: User interface consisting of floor plan with
machines and tool groups (1), Gantt-charts of the selected
machines (2), dialog control (3), dialog step indicator (4),
visualization settings (5), tangible object (6) and material
flow (7) (Lambeck, Kammer, et al., 2012).
2.4 Touch-enabled Mobile Dashboard
This concept originates from a workshop with an
international car manufacturer and has focused on
mobile business intelligence in the field of sales and
marketing. To be successful in an oligopoly which
competes for market shares, the financial provider
has to differentiate its services. With the help of
mobile business intelligence, service processes can
be treated more flexible to meet the demands of a
fast changing market and corresponding customer
needs.
In this specific scenario, field managers are
coaching their car dealers according to available
contract types and disposal strategies. To assist the
communication and to ease the traceability of the
presented data (e.g. quarterly figures) a mobile
solution has been prototypically implemented. It
combines information from customers, contracts,
staff and social communities to valuable mobile
services. These services cover meeting preparation,
performance analysis, forecast simulation, coaching
and protocol management. In addition, peripheral
services allow for status tracking and route
management. All services are accessible through the
start screen, which shows the main functional
categories.
A first main function is the retrospective
investigation of the business performance by
revenue. The application starts to present the sales of
the car dealership for a period of 12 month. If the
user performs a zoom gestures, the resolution adapts
to a more detailed presentation of several weeks. By
zooming in again, a list of contracts for the selected
week is shown. By clicking on one of the contracts,
all details are presented.
The second main function is the simulation of a
contract setting in a “what-if”-scenario. Herein,
contract mixtures can be composed and templates
for bonuses can be selected by directly interacting
with the visualization illustrated in
Figure 4. During
the setting of interest rate, contract runtime and
given bonus, the visualization is adapting and
presents the final revenue. The solution is conceived
for Tablet devices which seem to be appropriate in
their dimensions to suit the needs of the scenario. In
addition, the application uses multi-touch interaction
with zoom, pan and slide gestures.
Figure 4: Screenshot of the sales and bonus simulation
interface illustrating the effect of a bonus and the interest
rate on the revenue according to the contract runtime
(Lambeck, Jung, et al., 2012).
3 SUMMARY
AND CONCLUSIONS
The enormous number of industry branches and
users that are affected by usability problems in the
ERP domain has illustrated the importance of this
research. First motivated by insufficient research
concerning the graphical user interface in the field of
enterprise applications, relevant and related work
focusing on usability and user satisfaction has been
presented. In the subsequent section on promising
case studies, we introduced prototypical concepts
that aim to resolve at least some of the
aforementioned usability problems. The benefits of
the presented concepts cover:
iteratively developing result presentations
direct-manipulative visualizations
tangible interaction for the simultaneous
selection of objects and the adjustment of
parameters
Show Optimizations
Show Numeric Values
Show Color Indicators
VIEW SETTINGS
Show Machine Numbers
Show Floorplan
Show Tool Groups
Total Queing Time
Throughout
Utilization
Total Setup Time
ACHIEVMENTS
APlansOpt
ADVANCED PLANNING | SCHEDULING | OPTIMIZATION
16 00
17 00 18 00 19 0015 0014 0013 00
14 00
15 00 16 00 17 0013 0012 0011 00
14 00
0
1
15 00
16 00
17 00
13 00
12 00
11 00
1
2 3
CX 255
ANB 77
PTX 702
ABB 02
PCX 702
PTX 701
PTX 701
PCX 702
ANB 77
CX 255
ABB 02
PTX 702
TG - PX
0%
100%
0%
14
B
B
77
77
7
A
AN
N
B
N
77
B
B
B
B
B
7
7
A
A
AN
AN
AN
AN
AN
B
B
B
7
14
B
B
N
N
B
B
N
N
N
B
N
N
N
B
A
AN
N
B
A
AN
N
B
A
AN
N
B
A
7
77
7
77
7
77
B
B
7
77
B
B
7
77
B
B
7
B
B
7
B
B
B
B
B
B
B
B
B
16
2
2
0
0
2
2
0
0
2
2
0
0
70
70
70
0
7
7
PC
C
PC
X
X
C
C
X
X
C
X
X
X
X
X
X
7
6
X
X
CX
CX
PCX
PC
X
P
0
2
02
70
02
70
02
70
0
70
0
70
70
7
2
1
3
4
5
6
7
VERSION 0.1 BETA
ADM Personal Assist
EINZELFALL
JANUAR DEZEMBER
Pauschale
(kumuliert)
Kreditzins
(kumuliert)
200
400
600
800
1.000
1.200
JANUAR DEZEMBER
ZINSSATZ
2.90 %
2.00 6.00
INDIVIDUELLER ZINS
VORLAGEN-ANTEILE
350.00 €
900.00 €
500.00 €
500.00 €
-150.00 €
+400.00 €
BREAK-EVEN
BONUS
? ?
?
150 €
1. JahrJAN DEZ
2. JahrJAN DEZ
ICEIS2013-15thInternationalConferenceonEnterpriseInformationSystems
102
topological object placement instead of
tables with textual attributes
strong visual correlation between
topological and temporal information
strong visual correlation between user
actions and resulting consequences
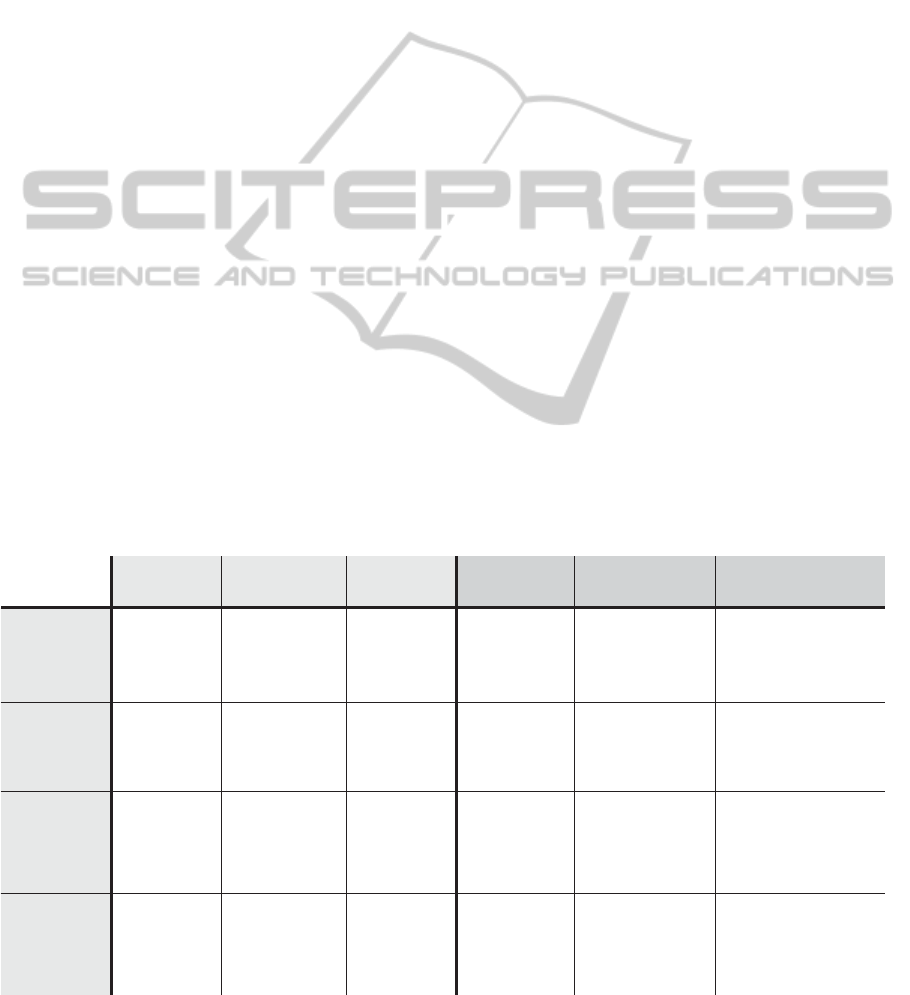
The presented concepts are varying in their
mentioned usage scenario, interaction modality and
additional aspects. Figure 5 summarizes the
prototypes according to their addressed user need,
scenario, modality and UI capabilities. These
examples give a first impression of innovative user
interface solutions in the field of enterprise systems.
Especially concepts addressing the identification of
and the access to the right functionality as well as
the overall system complexity (Topi et al., 2005) are
fundamental to increase usability. As users are
facing several barriers as briefly summarized in this
paper, especially the methodology of accessing
enterprise information should be renewed by
appropriate concepts. Whereas most of the
experienced users learned to use their ERP system
by attending time and cost consuming trainings and
their daily work over the years, especially
inexperienced users are still facing those problems.
In addition, primarily small and medium-sized
enterprises are affected, as they often have less
knowledge in application usage and cannot afford a
dedicated expert in this field. By utilizing visual
metaphors and reactive interfaces prior to textual
tables, forms and menus, a significant improvement
in ERP usability could be achieved.
However, multi-touch and tangible interaction
have been stated as less important in our local
survey (see section 2). One of the reasons for this
result might be that users are familiar with
keyboard- and mouse-based interaction and do not
have exhaustive experience in handling touch-
enabled devices. Hence, the resulting benefits of
such a technology can be hardly estimated by the
users themselves and might be misunderstood.
Therefore, it is increasingly important to offer
concrete and adequate prototypes, which are able to
illustrate the additional benefits and support the
confidence building in the new interface design.
With the help of the presented prototypes, the
usefulness but also the inadequacy could be
identified in a user study by qualitative and
quantitative methods
4 FUTURE WORK
Since our regional usability study from 2011
demonstrated that interface-related problems in ERP
still exist (cp. section 2), we currently conduct an
extended survey which is focused on the graphical
user interface and its interaction modalities. Our
major research questions are dedicated to mobile
devices, user guidance and the habits of private IT-
usage. To obtain a broader insight and deduce more
significant results, the study will focus on multiple
European countries, which currently involves
Austria, France, Germany, Latvia and Poland. Thus,
regional differences could be taken into account to
Figure 5: Classification of the presented concepts according to their user need, scenario, modality and UI capabilities.
User need Scenario
Graph-
based
Scheme
Spatial
Data
Landscape
Tangible
Floor Plan
Task-oriented
Visualizations
Detail and
Overview
Task-oriented
Visualizations
Multi-touch
Devices
3D Views on
Processes
and Facilities
Manufacturing
in ERP systems
Decision Support
& RT-SCM
APS &
Manual
Scheduling
Drill-down
capabilities
3 Levels:
- condensed
- prouct. steps
- details
2 Levels:
- data mountain
- production
schedule
2 Levels
- oor plan
- production
schedule
Guidance
capabilities
Implicit / random
- nodes can be selected
to display the details
(related ERP form)
Explicit / sequential
- stepwise from parameter
input to schedule
presentation
Visualization
capabilities
Graph with
enriched status
nodes with lling
and color scheme
Free zooming
data landscape
with color scheme
to indicate optimum
Floor plan with color
scheme to indicate
objective fulllment
Modality
Desktop
Desktop
Desktop &
Mobile
Mouse &
Keyboard
Mouse &
Keyboard
Multi-touch
& Tangibles
Explicit / sequential
- stepwise from parameter
input to schedule
presentation
1
2
3
Detail and
Overview
Multi-touch
Devices
Mobile Business
Intelligence for
Sales and
Marketing
4 Levels
- year
- month
- week
- contract
Explicit
- categories as entry
point on start screen
- breadcrumb
Direct-manipulative
diagrams for
interactive and
visual drill-down
Mobile
Multi-touch
Touch-
enabled
Mobile
Dashboard
4
DiscoveringPotentialsinEnterpriseInterfaceDesign-AReviewofOurLatestCaseStudiesintheEnterpriseDomain
103

offer enhanced and region-tailored solutions. The
presented prototypes can make a valuable
contribution to illustrate the potentials of new
interface and interaction paradigms.
The findings of future user studies combined
with the approaches presented so far have to
converge to an integrated concept to ensure the
adequate consideration of usability concerns in the
software development workflow. By offering a
concrete usability standard or guideline for ERP,
that goes beyond abstract engineering standards such
as (ISO, 2013), the sustainability of usability
concerns in the field of ERP can be improved.
ACKNOWLEDGEMENTS
Christian Lambeck would like to thank
the European Union and the Free State
of Saxony, Germany for funding this
work. Special thanks are also due to
Christian Leyh, Dirk Schmalzried and
Bettina Kirchner for their enthusiastic
participation.
REFERENCES
Bin, W. et al., 2010. Empirical research on the factor of
ERP’s user customer satisfaction based on triadic
reciprocal determinism. In Proceedings of the
International Conference on Management Science and
Engineering (ICMSE) 2010. IEEE, pp. 58–66.
Calisir, Fethi & Calisir, Ferah, 2004. The relation of
interface usability characteristics, perceived
usefulness, and perceived ease of use to end-user
satisfaction with enterprise resource planning (ERP)
systems. Computers in Human Behavior, 20(4),
pp.505–515.
Gartner Inc., 2011. Gartner Says Worldwide Enterprise
Software Revenue to Grow 9.5 Percent in 2011.
Available at: http://www.gartner.com/newsroom/id/
1728615 [Accessed February 12, 2013].
Gissrau, M. and Rose, O., 2011. A detailed model for a
high-mix low-volume ASIC fab. In Proceedings of the
2011 Winter Simulation Conference. Winter
Simulation Conference 2011. Arizona, pp. 1953–1963.
Intelligent systems solutions GmbH (i2s), 2011. ERP User
Satisfaction Survey: Summary, Zurich.
ISO, 2013. TC 159/SC 4 - Ergonomics of human-system
interaction. Available at: http://www.iso.org/
iso/home/store/catalogue_tc/catalogue_tc_browse.htm
?commid=53372 [Accessed February 12, 2013].
Konradin Business GmbH, 2009. Konradin ERP-Studie
2009: Einsatz von ERP-Lösungen in der Industrie.,
Leinfelden-Echterdingen: Konradin Mediengruppe.
Lambeck, C., Kammer, D., et al., 2012. Bridging the
gap: advances in interaction design for enterprise
applications in production scenarios. In Proceedings of
the Conference on Advanced Visual Interfaces 2012.
AVI’12. Capri Island, Italy.
Lambeck, C., Schmalzried, D., et al., 2012. Changing
Concepts in Human-Computer-Interaction in Real-
Time Enterprise Systems - Introducing a Concept for
Intuitive Decision Support in SCM Scenarios. In
Proceedings of the 14th International Conference on
Enterprise Information Systems. International
Conference on Enterprise Information Systems
(ICEIS). Wroclaw/Poland: SciTePress – Science and
Technology Publications.
Lambeck, C., Jung, S. & Geissler, G., 2012. MKWI2012
Workshop: Mobile Business Intelligence for Sales and
Marketing.
Lambeck, C., Kirchner, B. & Leyh, C., 2012. Beyond
Forms and Tables - A visual and Task-oriented
Approach to ERP systems. In Proceedings of the
Conference on Enterprise Information Systems.
CENTERIS. Vilamoura, Portugal.
Lambeck, C. & Leyh, C., 2012. Defizite und Potentiale
im Bereich der Usability betriebswirtschaftlicher
Anwendungen in Kleinst-, Klein- und
Mittelständischen Unternehmen am Beispiel des
Freistaats Sachsen. In Multikonferenz der
Wirtschaftsinformatik 2012. Braunschweig: GITO, pp.
109–120.
Mitakos, T., Almaliotis, Ioannis & Demerouti, Anna,
2011. An Auditing Approach for ERP Systems
Examining Human Factors that Influence ERP User
Satisfaction. Informatica Economica, (14), pp.78–92.
Ozen, C. & Basoglu, N., 2006. Impact of Man-Machine
Interaction Factors on Enterprise Resource Planning
(ERP) Software Design. In Technology Management
for the Global Future, 2006. PICMET 2006. pp. 2335
–2341.
Ragusa, C. & Puliafito, A., 2011. Running business
applications in the cloud: a use case perspective. In
Proceedings of the 2010 conference on Parallel
processing. Euro-Par 2010. Berlin, Heidelberg:
Springer-Verlag, pp. 595–602.
SAP AG, 2012. SAP Design Guild -- R/3 History in
Screen Shots. Available at: http://www1.sapdesign
guild.org/goodies/r3_history.asp [Accessed February
27, 2012].
Seth, A., Agarwal, H. & Singla, A.R., 2011. Designing a
SOA based model. ACM SIGSOFT Software
Engineering Notes, 36(5), pp.1–7.
Tertilt, D. & Krcmar, H., 2011. Generic performance
prediction for ERP and SOA applications. In V. K.
Tuunainen, M. Rossi, & J. Nandhakumar, eds. ECIS.
Topi, H., Lucas, W.T. & Babaian, T., 2005. Identifying
Usability Issues with an ERP Implementation. In
Proceedings of the International Conference on
Enterprise Information Systems (ICEIS). ICEIS’05.
pp. 128–133.
ICEIS2013-15thInternationalConferenceonEnterpriseInformationSystems
104
