
Intuitive Multi-touch User Interface for Visualization
of and Interaction with Product and Process Information to Enhance
Product Lifecycle Management
Martin Eigner, Karl-Gerhard Faißt and Alexander Keßler
VPE, University of Kaiserslautern, Gottlieb-Daimler-Str., Kaiserslautern, Germany
Keywords: Product Lifecycle Management, Multi-touch, Visualization, Interaction, Collaboration, Product and Process
Information, User Interface.
Abstract: Today’s products more and more turn into systems which are built up of different kinds of linked
components that communicate among each other. The resulting complexity brings today’s information
management technologies, user interfaces and information visualizations to their limits. This paper presents
a research idea which proposes the use of modern touch devices with multi-touch multi-user enabled
graphical user interfaces in order to handle the named complexity explosion in a new and better way.
1 INTRODUCTION
The capability of companies to be innovative on
today’s global markets is essential for their survival.
In the end, the success of an innovation depends on
the company’s capability to transform innovative
ideas into salable products in an efficient and
effective way. Against this background, the product
creation process (PCP) is of special importance.
Tracing product creation in the last thirty years, the
amount of functionalities and thereby product
complexity (Fig. 1) have strongly increased (Eigner,
2009). Today’s products more and more turn to
systems which are built up of different kinds of
linked components that communicate among each
other. Accompanying, process and product
complexity have risen by multidisciplinarity in
mechatronic products and cyber-physical systems
(maybe in combination with hybrid bundles of
services), by a stronger federation of the supply
chain as well as by external surrounding conditions
like product liability or sustainability. As a result,
the users involved in the product creation process
perceive a massive complexity and information
overload today.
Today’s standard PLM (Teamcenter, Windchill,
Enovia, etc.) / ERP (SAP, ORACLE, etc.) solutions
that shall help the user to cope with the complexity
fail due to user interfaces that are not designed for
usability.
A user-friendly visualization has to align to the
ability of a human to recognize visual information
(patterns, trends, characteristics and groups) very
efficient. A human is able to remember images, to
recognize and scan them quickly and precisely.
Furthermore he has the ability to recognize subtle
changes in color, shape, motion and texture.
Therefore, the most natural representation of product
and process information for a human is a graphical
representation. (Brodbeck et al., 2009)
Considering the present common forms of
representation there are mainly tables and lists, so
textual forms, which is contradictory to the
recommendations for developing user-friendly
graphical interfaces. (Shneiderman, 1997)
In detail, the above named IT systems simply
reflect the storage structure - namely tables - to the
user interface. Usually one would expect that there
exists a separation layer between the structure in
which information is stored and the structure that is
presented to the user. Furthermore, for interaction
with the system the user is offered standard input
devices (mouse, keyboard, etc.). However, these
interfaces (input and output) are not natural and
native human-centered user interfaces (Wigdor,
2011).
For a native human-oriented access to a machine
the barriers called input devices (mouse, keyboard,
etc.) have to fall down. These devices are prosthesis
for humans to interact with the machine. The
630
Eigner M., Faißt K. and Keßler A..
Intuitive Multi-touch User Interface for Visualization of and Interaction with Product and Process Information to Enhance Product Lifecycle Management.
DOI: 10.5220/0004506006300634
In Proceedings of the 9th International Conference on Web Information Systems and Technologies (FWP-2013), pages 630-634
ISBN: 978-989-8565-54-9
Copyright
c
2013 SCITEPRESS (Science and Technology Publications, Lda.)
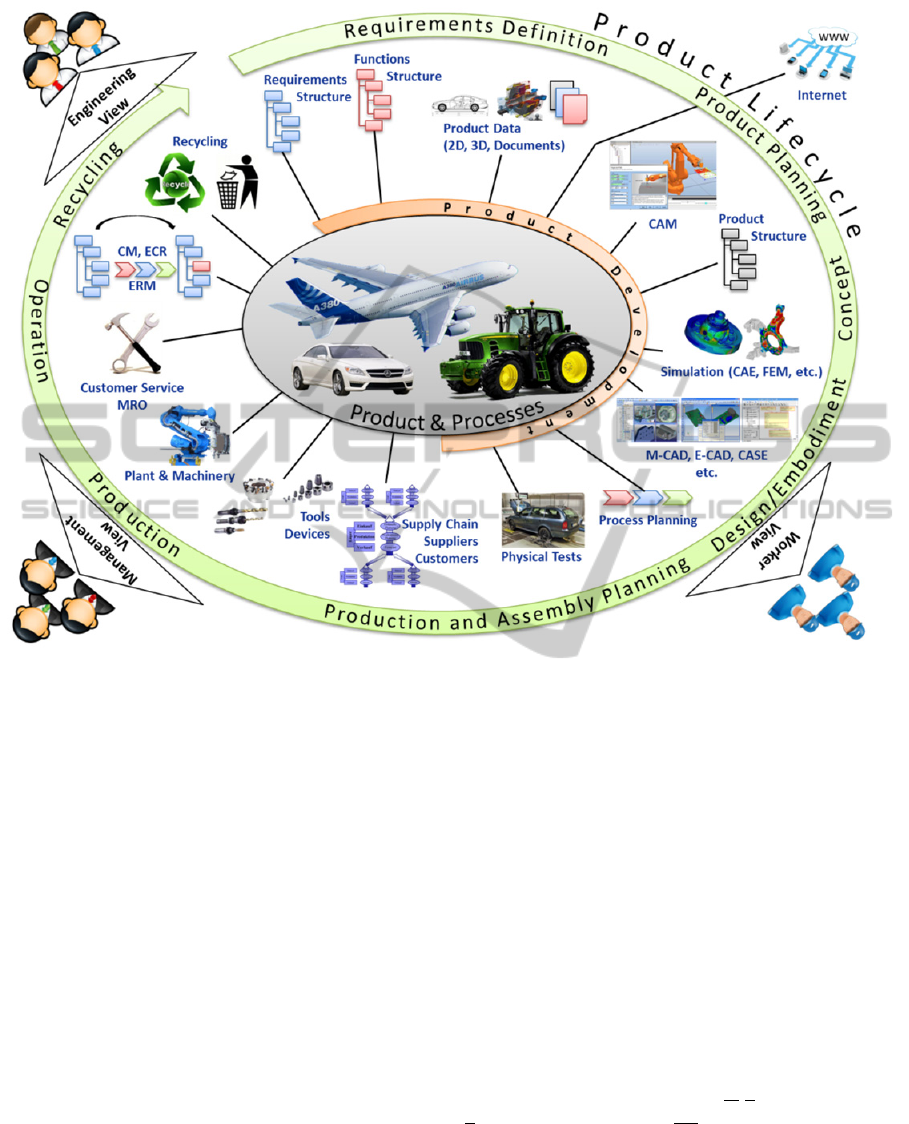
Figure 1: Complexity in the product lifecycle.
machine is not able to interact with a human in a
direct way. Machines don’t understand natural
spoken language. They don’t react if one touches
them. Gestures, feelings, views and all the other
human signals are not perceived. The reason lies in
the lack of natural human-oriented hardware
interfaces and in the lack of algorithms that give the
machine a human-like behavior.
Developing the future workplace, it will be a
great challenge to transform today’s business IT
systems into systems that allow an easy and intuitive
– ideally role-/view-based – access to a company’s
information. Beside this challenge the
transformation of today’s business IT systems with
single-user interfaces to a business IT system with a
collaborative multi-user interface that supports
group collaboration and group interaction in a local
or globally distributed meeting poses an even greater
challenge.
Fortunately, in the field of Human Computer
Interaction there exists a broad range of excellent
works that could support the development of the
future workplace. For example (Jetter et al., 2011)
(Heilig et al., 2011), (Prewett et al., 2006) and
(Hoggan et al. 2008) prove the usefulness of touch
interaction in comparison to mouse/ keyboard
interaction and provide examples and prototypes on
how an intuitive, human-oriented and context-
sensitive interface could be designed. Using touch
interaction, gestures and tangible physical objects
for interaction (in the following of this paper named
as a tangible or tangibles), a large field of new
possibilities is opened. With more new technologies
to come in the next years like real speech
recognition, 3D cameras (e.g. Microsoft’s Kinect)
and many more promising technologies, the
prerequisites for the future workplace are laid.
To promote the application of these new
techniques in the field of product creation a research
idea for the development of an intuitive multi-touch
user interface for the visualization of and the
interaction with product and process information to
enhance product lifecycle management (InuVis) is
presented in the next chapter. In the context of future
workplace research, InuVis aims at developing new
concepts and techniques for a better handling and
IntuitiveMulti-touchUserInterfaceforVisualizationofandInteractionwithProductandProcessInformationtoEnhance
ProductLifecycleManagement
631

control of the named complexity explosion, to
reduce the users feeling of being overwhelmed and
to provide concepts and technologies for natural and
intuitive interaction with information for PLM/ERP
solutions by using human-oriented graphical
interfaces.
2 INUVIS
With InuVis, the target user groups engineers,
administration and management people shall be
enabled to access all existing information in a
company in a very easy and intuitive way. The goals
are to reduce the time for accessing information
significantly, to allow the user to view more
information without overwhelming him, to increase
the joy in using IT systems (PLM, ERP, etc.) and
therefore to extend the time the user can work with
them without getting tired and mentally exhausted. It
is the goal to create an overall concept for a new
user interface that is so simple to use, that only a
very short training is necessary to be able to use the
full functionality of the systems. All these goals will
bring a completely new user feeling to the current
business software world. The focused application
areas are engineering collaboration and coordination
in the creation process of complex products (e.g.
decision or change processes). The disciplines
involved in the research are virtual product
development, interaction design, user interface
design, ergonomics and work psychology/human
factors.
Remark: Because of the limited space in this
paper, in the following sections only a small part of
the overall concept is presented.
2.1 Engineering Network
As today's corporate IT suffers from a variety of
distributed legacy systems, the first step towards an
easy information access is the aggregation and
federation of the spread information. For this
purpose the Engineering Network (EN) concept was
developed. The EN concept is an enhanced flexible
object-oriented meta-model for the modeling of
composite and integrated multi-disciplinary product
data and process models and it supports the mapping
of data into data management systems. The product
data models and process models derived from the
meta-model provide user-specific views and flexible
variant-rich development processes. With its
flexibility and customizability, the EN concept
contributes to handle the complexity in today’s
product creation processes. It is based on the
following two core components (Mogo Nem, 2011),
(Dankwort et al., 2012):
2.1.1 Enhanced Object (EO):
Enhanced Objects (EO) are used for the modeling of
product-related information and allow a user-
specific, individual presentation of the data. Today,
different models are used for this purpose. Different
disciplines (software, electronics and mechanics)
have various different models. Some of them are
defined in ISO 10303 (STEP). An EO is a virtual
object which is fed by information from models of
various globally distributed systems. The position of
the user (viewer) determines which information is
included. For this purpose, the EO component
includes and offers Viewpoints which are linked by
different Views to the virtual EO. By taking a
Viewpoint, a real object is created which holds and
presents real data.
An EO has properties which carry the specific
values of the EO. Furthermore, the EO has
interdependencies/relations to other EOs. Relations
can be of types EO EO, EO Property, EO
View, View View and Property Property. The
Property Property relations are fully
programmable and offer the possibility to attach
algorithms, methods, etc. to them (e.g. to execute
operations such as transformation, calculation,
check, etc.). This for example allows an automatic
update functionality by which a value change of the
source property is automatically transferred to
and/or compared with other properties related to it
(within defined and valid constraints. Exceeding the
constraints has to stop the process).
2.1.2 Engineering Process (EP)
Engineering Processes (EP) are used to model the
business processes associated with the EOs. In the
EN concept the assumption is made that there is a
strong correlation between a product and its
associated processes. Thus, the EO is the processes’
data context. According to the concept of object
orientation, a process is defined as a dynamic
behavior of an object. Therefore, in EN processes
are mapped to object methods and reside in the EOs.
EPs can access other EOs by traversing the
relation¬ships between EOs. Thereby a process can
change not only its own EO but also related EOs. In
the context of engineering design, EPs serve for
capturing the various design processes and for
mapping them onto some formal and executable
structure.
WEBIST2013-9thInternationalConferenceonWebInformationSystemsandTechnologies
632
2.2 Interaction
Having the aggregated information at hand, in this
section the process of interacting with InuVis will be
sketched.
The interaction with the system can be split into
an input and an output channel. As InuVis focuses
on the application of new touch technologies, the
input channel incorporates every possible type of
touch contact or touch gesture, every kind of a
tangible and other kinds of objects that can be
identified by the used hardware (e.g. a touch display,
a touch table, a powerwall, etc). Also multimodal
input is taken into account. The elements of the
output channel can be visualizations, sound, force
feedback and others. However, to keep the scope of
the research manageable on the output channel, the
research idea is limited to visualization and sound.
2.2.1 Phases of Interaction
To interact with the future workplace the following
phases are proposed. With every phase change the
graphical user interface can change its appearance to
provide the user with the controls needed at a
specific moment. This is essential for offering a
large amount of functions without cluttering the user
interface.
Phase 1: User Login
For the user login the idea is to make use of
tangibles as a personal token that the user always
carries with him/her. This can be for example a
special object created only for the purpose to log
into the system. But the token also can be a
smartphone with a QR-Code on the back or
something similar. By placing the physical token on
a tangible enabled surface the system reads the
user’s ID, fetches the user’s EO and logs him/her in.
Depending on his/her access rights and roles the
visualization changes and presents a cloud of EOs to
the user. These EOs symbolize all information in the
company’s systems that are accessible for this user.
As this might be a real large amount of EOs, the
visualization has to be pure and simple (e.g. a
pictogram) to show as many EOs as possible on the
restricted screen space without overwhelming the
user.
Phase 2: Object Search
The next step in the interaction process flow will be
usually the search for a special piece of information
– for one dedicated EO. InuVis offers the user
several ways to perform this. First, there will be
regular full text search. Without using a physical
keyboard this can be done by a soft-keyboard that
can be accessed by placing a special tangible on top
of the touch device. Secondly, it will be possible to
filter the EO cloud by the use of tangibles (Jetter et
al., 2011). And third, the user shall be able to
navigate by touch gestures. The combination of
tangibles, touch gestures and textual full text search
will be possible too.
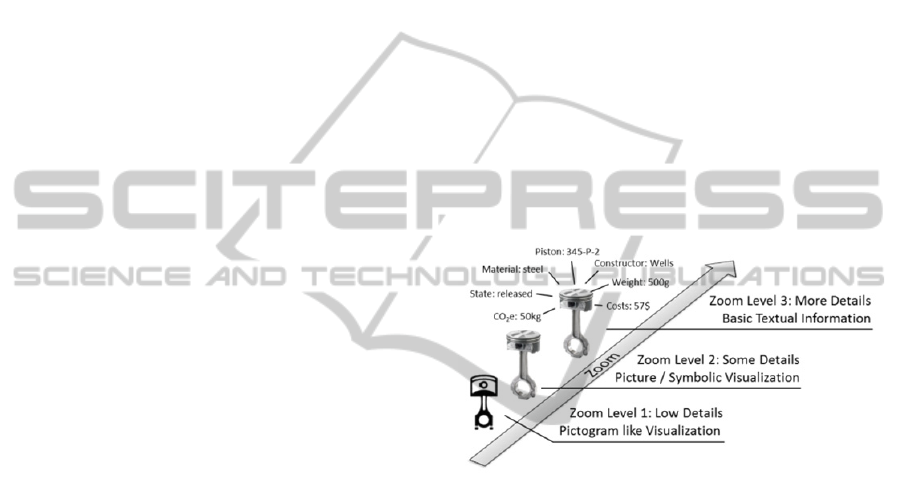
Phase 3: Object Enrichment
Searching for objects with an easy and simple
visualization maybe will not lead to a satisfying
success. So the user needs a possibility to enrich
his/her selection with additional information when
needed. This shall be done by zooming into the EO
cloud.
Figure 2: EO enrichment.
The more the user zooms in, the more information
will be displayed (Fig. 2). As for the object search,
the zooming can be done in several ways: by a touch
gesture and by a tangible.
Phase 4: Object Usage
Once the user has found his/her object he/she can
view its role-dependent information. The
information is presented in views which can be
scrolled freely, pulled apart and rearranged (Fig. 3).
By using a tangible or a special touch gesture or
simply by dragging the object to a special location
on the touch device, the user can switch to an
enhanced interaction mode that provides more
options. As the Engineering Network allows the live
connection to systems, e.g. cyber-physical systems,
machines, etc., the user now can view and
manipulate the parts of the selected EO that are live
enabled. For the passive parts of the EO editing
functions are provided.
IntuitiveMulti-touchUserInterfaceforVisualizationofandInteractionwithProductandProcessInformationtoEnhance
ProductLifecycleManagement
633
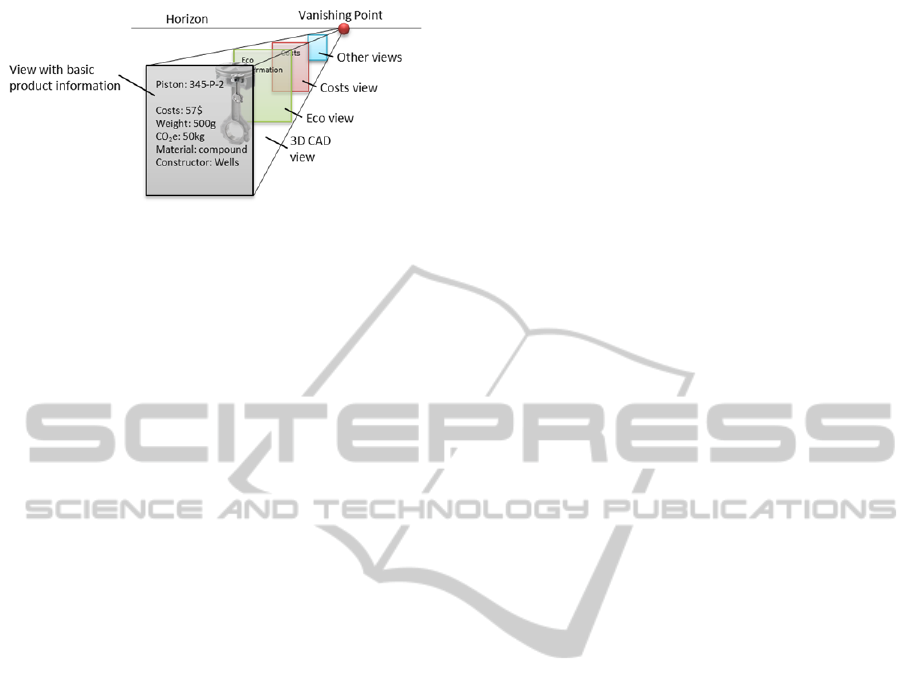
Figure 3: EO with views.
Switching between the different phases will be
possible so that the user feels completely free when
he/she “surfs” in the EO cloud. The change from the
visualization in one specific phase to the next
visualization in another phase will thereby be
smooth.
3 SUMMARY AND OUTLOOK
In this paper, a proposal for a new field of research
is given. The research idea InuVis focuses on
handling the increasing information complexity in
today’s information management systems by the use
of rich visualizations and multi-touch technologies.
As part of InuVis a concept for a graphically rich
multi-touch multi-user interface for a natural and
intuitive interaction with complex product and
process information has been presented.
According to the research idea first concepts and
prototypes have already been created. In this paper,
the necessary information aggregation layer and a
brief overview over the process of interacting with
InuVis has been presented. In the next future a
prototype for evaluating different interaction
concepts will be developed.
REFERENCES
Eigner, M., Stelzer, R., 2009. Product Lifecycle
Management - Ein Leitfaden für Product Development
und Lifecycle Management. Springer Verlag, Berlin
Heidelberg
Brodbeck, D., Mazza, R., Lalanne, D., 2009. Interactive
Visualization – A Survey. Human Machine Interaction
Lecture Notes in Computer Science, Volume
5440/2009, pp. 27-46
Shneiderman, B., 1997. Designing the User Interface.
Addison Wesley. 3. Edition
Wigdor, D., Wixon, D., 2011. Brave NUI World.
Designing Natural User Interfaces for Touch and
Gesture. Morgan Kaufmann Verlag
Jetter, H. C.; Gerken, J.; Zöllner, M.; Reiterer, H.; Milic-
Frayling, N. (2011) ‘Materializing the Query with
Facet-Streams – A Hybrid Surface for Collaborative
Search on Tabletops’, Proceedings of the 29th
international conference on Human factors in
computing systems, ACM Press, 2011
Heilig, M.; Huber, S.; Gerken, J.; Demarmels, M.;
Allmendinger, K.; Reiterer H. (2011) ‘Hidden Details
of Negotiation’ Proceedings of 13th IFIP TC13
Conference on Human-Computer Interaction, acm In-
Cooperation, SpringerLink, p. 622-639.
Prewett, M. S., Yang, L., Stilson, F. R. B., Gray, A. A.,
Coovert, M. D., Burke, J., Redden, E., Elliot, L.R.,
2006. The benefits of multimodal information: a meta-
analysis comparing visual and visual-tactile feedback.
In Proceedings of the 8th international conference on
Multimodal interfaces (ICMI ‚06), pp. 333-338, ACM,
New York, NY, USA
Hoggan, E., Brewster, S.A., Johnston, J., 2008.
Investigating the effectiveness of tactile feedback for
mobile touchscreens. In Proceeding of the twenty-
sixth annual SIGCHI conference on Human factors in
computing systems (CHI ‚08), pp. 1573-1582, ACM,
New York, NY, USA
Mogo Nem, F. (2011) ‘Engineering Networks: Holistic
approach for multidisciplinary Product Lifecycle
Management’ Kaiserslautern, University of
Kaiserslautern.
Dankwort, C. W., Eigner M., Faißt K. G., Keßler A.
(2012) ‘Enhanced Object-Driven Design (EOD) based
on Product Properties – Fundamentals and
Implementation in the Engineering Network Concept’
in Marjanovic, D., Storga, M., Pavkovic, N., Bojcetic,
N. (eds) (2012) 12th International Design Conference
DESIGN 2012, Dubrovnik, University of Zagreb, pp.
421-434.
WEBIST2013-9thInternationalConferenceonWebInformationSystemsandTechnologies
634
