
Tool Support for Building Graph Construction
Paul Heiniz, Karl-Heinz Krempels, Christian Samsel, Kai Schwarz and G¨okay Bodur
Informatik 5, RWTH Aachen University, D-52074 Aachen, Germany
Keywords:
Landmark, Indoor Navigation, Building Graph, Mobile, Positioning.
Abstract:
Landmark-based navigation is one promising approach among the group of indoor navigation solutions. Using
logical connections between areas in the building, users are able to follow a path via step-by-step instructions.
This approach provides universally applicable navigation to complex buildings. However landmark-based
indoor navigation requires a solid and reliable data structure which depicts regarded buildings. In this paper
we present a tool for construction of such data structure. Using findings from prior experiments and well-
established design principles and patterns, we were able to significantly improve the usability of the tool and
lower the cognitive load of the user. Furthermore, the proposed improvements were integrated into landmark-
based indoor navigation software to enhance the user experience and display a more familiar presentation
during the navigation task.
1 INTRODUCTION
Mobile devices of all kinds penetrate our daily life
and change it significantly. The build-in hardware be-
comes more complex and consequently, the range of
application steadily grows.
Navigation is one of the many tasks that nowadays
devices are capable of. The satellite-based Global
Positioning System (GPS) became the standard for
outdoor positioning in recent time. There exist not
only stand-alone navigation solutions but many of to-
day’s sold mobile phones include the required soft-
and hardware for outdoor navigation. However, there
are limitations in the field of application for such de-
vices. Even though navigation tasks on street level
are very precise, the GPS approach reaches its limit
at the entrance of a building. Since nowadays archi-
tectonic styles are changing to more individual and
often more complex structures, it is indisputably im-
portant to support visitors in such complex buildings
as airports, railway stations, hospitals, and museums.
Completely new navigation approaches are required
to navigate a person inside unfamiliar buildings. For
this task exist several hardware-based solutions as
well as approaches working solely with logical con-
straints of the building and human perception.
Landmark-based indoor navigation (Heiniz et al.,
2012) is one of such solutions. Compared to navi-
gation approaches based on precise geographic co-
ordinates which are mapped on a floor plan of the
building, landmark-based navigation relies heavily on
the data structure that represents the covered build-
ing. This data structure, a so called building graph,
consists of nodes and directed edges. Subdivided
into logical areas within the building, such a build-
ing graph is an abstract representation of the human
mental map that he subconsciously builds for indoor
environments. It is crucial to design such a graph in
a suiting, consistent, and precise way to cover most
special cases within rambling building structures such
as stairs, elevators, complex intersections, and large
open spaces.
This paper is structured as follows: Section 2
briefly describes the aim of our work. Section 3 in-
troduces several navigation models and presents tech-
niques for indoor positioning and navigation. In Sec-
tion 4, we describe landmark-based indoor naviga-
tion in detail. Additionally, Section 5 covers the data
structure which is the foundation of this navigation
approach and depicts the implementation and archi-
tecture of our system. In Section 6, we present the
evaluation of our system. Finally, in Section 7, we
summarize this paper and future steps for the system
development are revealed.
2 APPROACH
This paper describes the design of a tool for creation
of building graph data structure. The majority of
265
Heiniz P., Krempels K., Samsel C., Schwarz K. and Bodur G..
Tool Support for Building Graph Construction.
DOI: 10.5220/0004510402650272
In Proceedings of the 10th International Conference on Signal Processing and Multimedia Applications and 10th International Conference on Wireless
Information Networks and Systems (WINSYS-2013), pages 265-272
ISBN: 978-989-8565-74-7
Copyright
c
2013 SCITEPRESS (Science and Technology Publications, Lda.)

this work is based on the navigation approach and
resulting software from the work by (Heiniz et al.,
2012). We extend and simplify the existing approach
for graph creation. Sequential views from the initial
implementation are extended by the wizard metaphor
(Tidwell, 2010). This technique guides users through
the creation of the graph by locking the user into a
sequence of several well-defined views. Therefore,
graph creation is done step-by-step in a logical order.
This way we are able to lower user’s cognition load
and avoid misleading handling of the tool.
Furthermore, an additional view is introduced
which is based on the floor plan of the building. This
view adapts well to the touch interface of the applica-
tion and allows a more natural handling of the graph.
During the editing, users have an overview over the
created graph and may update and delete data ele-
ments more easily. In case of missing floor plan for a
building, the proposed procedure switches into a de-
fault setting, where the user places elements of the
building graph on a white canvas. This option allows
a touch-based visual handling in a symbolic space.
Additionally, the application for indoor navigation
introduced in (Heiniz et al., 2012) is extended with
the presented approach. Users often want a more con-
ventional overview of the route while navigating with
the application. Therefore, they are able to switch
from the initial step-by-step view to an overview of
the building to observe the passed steps and the route
ahead. This way we introduce an additional view that
supports users which experience difficulties with pure
sequential instructions. Using this enhancement, we
were able to combine the advantages of landmark-
based indoor navigation (e.g., best-effort positioning
and navigation approach based on human cognition)
and the more common information from a building
floor plan.
3 RELATED WORK
The following approaches base on the idea of support-
ing positioning through the data structure. Thus, the
system is more independent from the existing techni-
cal infrastructure in the building.
Landmark-based indoor navigation (Heiniz et al.,
2012) does not rely on additional sensors in the build-
ing or the navigation device to lead the user to his des-
tination point in a building. This approach includes
the user into the navigation task by letting him sub-
consciously collect visual impressions about his sur-
roundings. The user has to perceive his surroundings
and compare certain areas of the building to presented
depictions in the application. He then actively in-
forms the system about his position in the building by
selecting certain areas from a list of preselected posi-
tions. Using physical constrains of the building and
the human power of observation, it was possible to
design a reliable navigation system. Landmark-based
indoor navigation serves as the starting point to this
work.
The navigation approach presented by (Chowaw-
Liebman et al., 2010) provides an advanced data
model for buildings. Users follow generated textual
instructions and thus are guided through the graph
structure of the data model. The position of the user is
monitoredvia the devicewhispering approach (Krem-
pels et al., 2011) during the navigation.
(Baras et al., 2010) presented an approach that
leads users through a building without any hardware-
based positioning. In this work, a model of the tar-
get building provides the route based on area iden-
tifiers such as room names or special locations. Ob-
jects which base on these identifiers are logically con-
nected. Users are following the sequence of locations
and reach their destination. However, the presented
system provides very sparse information which lacks
details. Furthermore, all information is presented as
text, therefore, users need to be familiar with the
building to follow the route.
Another approach working with imprecise posi-
tioning was introduced by (Jensen et al., 2009). The
presented system encloses areas to logical objects
which are connected in a building graph. Human
movement is tracked by a technique based on RFID
signal recognition. Even though this positioning ap-
proach shares the drawbacks of all hardware-based
positioning solutions, the graph on its own provides
strong constrains for possible actions within the build-
ing and thus the introduced navigation approach is
still reliable. A proper building structure enables
flawless navigation for this approach.
Apparently, it is possible to navigate a person
through a building without precise hardware-based
positioning. A proper underlying data structure is cru-
cial to achieve a reliable indoor navigation approach.
However, most of the introduced approaches still use
floor plans to depict user location even though this po-
sition lacks precise coordinates. We will use this find-
ing to evaluate human mapping of points on a map to
areas in the building.
Usability aspects play an important role for de-
sign of the building graph construction tool. We re-
course to a certain set of design principles and de-
sign patterns to create an accessible and user-friendly
experience. To optimize the existing graph creation
views, we adapted design patterns from (Shneider-
man, 2003). Additionally, we implemented the wiz-
WINSYS2013-InternationalConferenceonWirelessInformationNetworksandSystems
266

ard pattern for construction views from (Tidwell,
2010) to guarantee certain sequence of steps and sim-
plify the usage of our tool.
4 LANDMARK-BASED INDOOR
NAVIGATION
This section describes the approach for landmark-
based indoor navigation in detail. First, we explain
the idea behind the navigation approach, followed by
the navigation data model of our system.
4.1 Navigation Approach
The concept of the developed navigation system fol-
lows the human cognitive navigation process. Sub-
consciously, the human brain constructs a unique cog-
nitive map from the starting point to the endpoint
of the route which is divided into single route sec-
tions of manageable sizes characterized by waypoints
and landmarks known or communicated to the user
(Downs and Stea, 1982). A landmark is a unique rec-
ognizable reference point in a section used for orien-
tation and positioning of the user, whereas a waypoint
is a special kind of a landmark, namely the starting or
endpoint of a route section. Hence, the route consists
of a sequence of waypoints which the user needs to
pass in a predefined order. Each of these waypoints
is connected to one or several landmarks which de-
pict this exact position visually unique in the context
of routing. During the human navigation process, a
mental depiction of the route, the cognitive map, is
continuously compared to the surroundings.
This subconscious procedure is modeled in the
navigation system by (Heiniz et al., 2012). However,
this approach does not only model the human navi-
gation process but also human instructions in case of
asking other people for the direction to a destination
point. People tend to describe the route by provid-
ing two to three landmarks which are located on the
way and build the directions using these unique ar-
eas. Landmark-based navigation system is based on
the same principle. A route along waypoints is com-
puted after defining a starting and an end point. The
navigation system displays successively the next way-
point the user has to pass until he reaches the end-
point. To facilitate the navigation for each waypoint,
textual instructions are attached which describe how
to reach the next waypoint from the current position.
Additionally displayed landmarks allow a continuous
verification of the current position along the route.
The user is actively integrated into the navigation pro-
cess by confirming his arrivalat the target waypoint to
be navigated to a successor located on the route.
4.2 Navigation Model
In this section we will focus on a data model called
building graph. In our system, on the one hand the
building graph is used as a structure the navigation
relies on. On the other hand the system provides a
module to construct such a structure for an arbitrary
building.
In general, this graph consists of nodes and di-
rected edges. The nodes represent specific logical ar-
eas in a building which comprises unique attributes,
e.g., the entrance hall. They are used as naviga-
tion points and can obviously be applied as starting
points or endpoints. We distinguish between way-
points which depict landmarks lying on the route and
points of interest which are relevant navigation end-
points and a subset of waypoints. Both are discussed
below.
The edges represent all possible routes between
the nodes in the specific building. They have to be
directed edges because some routes can be restricted
with respect to their direction of movement, e.g., an
escalator. Every edge contains a rough distance value
between the connected nodes such that the user can
estimate how long he has to walk to reach the next
waypoint and can easily compare sections. An esti-
mation of the distance is sufficient since a person can
hardly estimate accurate distances in buildings (Cut-
ting and Vishton, 1995). During the construction of a
building-graph, we assign a geographic direction to
each edge to compute the angle between two con-
secutive sections. In dependency on the angular de-
gree, the user can be precisely navigated by adapt-
ing the textual instructions according to the computed
value, e.g., turn left, turn right, turn around, followthe
route. The direction patterns base on work presented
in (Chowaw-Liebman et al., 2010).
Precise implementation of the building graph in
our application and all required components are pre-
sented in detail in Section 5.1.
5 IMPLEMENTATION
The following section describes the implementation
of the building graph construction tool and integration
into the existing application.
5.1 Building Graph
Building graph is the central construct that acts as
the base for landmark-based indoor navigation. It
ToolSupportforBuildingGraphConstruction
267
consists of all essential elements to describe a route
through a building. Such a graph is identified by the
address of the respective building.
A building is subdivided in different areas, e.g.,
different floors or departments which distinguish in
a logical matter. An area can be a subarea of an-
other one, e.g., there can be several departments on
the same floor of a building. Partially intersecting ar-
eas are not considered in our implementation.
Another important entity is a landmark. It con-
tains pictures of the reference point from the user’s
point of view, an identifying name, GPS-coordinates,
and Wi-Fi fingerprints. The two latter attributes are
necessary because a landmark just as a waypoint can
be suggested to identify the starting point in the navi-
gation process.
A waypoint is similar to a landmark and is de-
scribed by the same attributes. The difference is that
a waypoint contains a set of landmarks which are vis-
ible from this point and is not necessarily a discrete
object. In fact, waypoints represent the nodes of the
building-graph, i.e., the starting points and endpoints
of every section of a route which have to be reached
to continue with the next section, e.g., branches or
stairs to the next floor. A point of interest (POI) is a
special waypoint which can be the target of an entire
route. They additionally contain a textual description
of the target. A waypoint is associated to the area it
is located in and to other adjacent waypoints by seg-
ment objects. Segments correspond to the edges of
the building graph and have to fulfill the attributes dis-
cussed above. Especially, all landmarks positioned on
a section are included into such a segment.
Landmarks and POIs are collected in logical
categories: LandmarkCategory, POICategory, and
POISubcategory. Landmarks are categorized by in-
cluded attributes, e.g., stairs, corridors, pillars, lifts.
POICategory and POISubcategory are used to fa-
cilitate the manual choices of the endpoint.
To support the user by determining her starting
point, GPS-coordinates and Wi-Fi fingerprints are as-
signed to landmarks and waypoints. With the appro-
priate infrastructure, the navigation system can sug-
gest possible starting points based on hardware posi-
tioning. A GPS object contains a latitude, a longi-
tude, and an accuracy value and refers to every land-
mark and waypoint with the same coordinates. The
accuracy value specifies the accuracy during the mea-
surement to determine the coordinates of a point in a
building conditioned by shielding. The system sug-
gests only estimated points whose coordinates stay
within this value.
Wi-Fi fingerprinting (Chan et al., 2009) uses the
signals of Wi-Fi access points for positioning. To de-
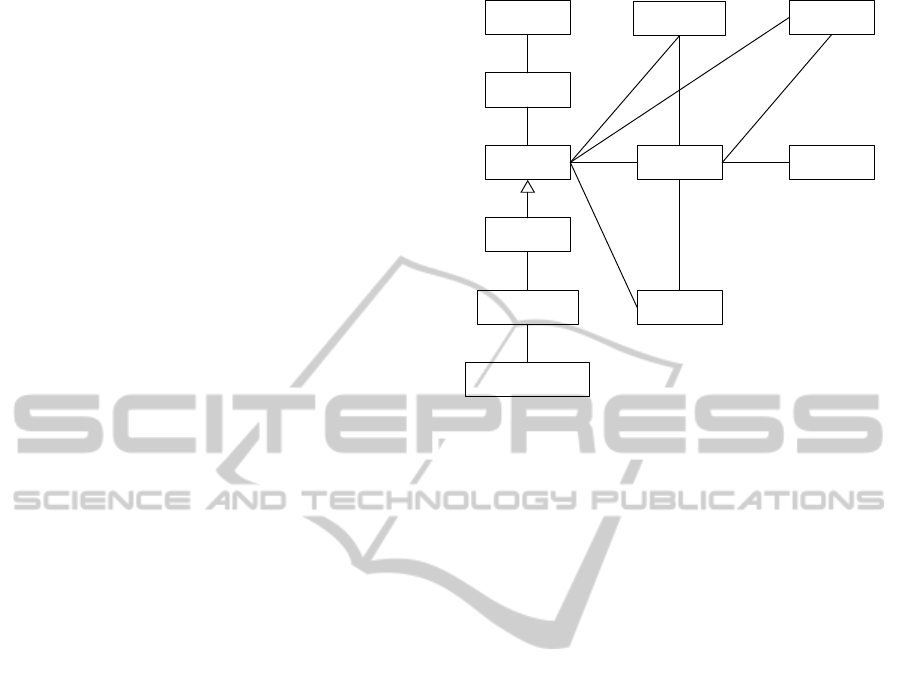
Segment
Waypoint
POI
GPS
POISubcategory
POICategory
Landmark
Address
Area
Landmark
Category
WiFi
Fingerprint
*
1
1
*
1
*
1
*
2
*
1 * * *
1
1
1 1
1
1
1
1
1
*
Figure 1: Building graph structure.
termine the user position, the measured fingerprint of
the navigation system is compared to the fingerprint
objects in the database. Hence, every Wi-Fi finger-
print object requiresthe creation date, the access point
identifier, the signal strength, and the references to the
considered landmarks and waypoints.
The overall structure of the building gragh is de-
picted in Figure 1.
5.2 Design Principles for Workflow
Improvement
The initial version of graph construction tool used a
loosely coupled collection of views bound by a cen-
tral menu. Each of these views addressed a certain el-
ement of the building graph. Thus, these components
were logically linked, e.g., a segment always had a
starting and an endpoint. However, due to the nature
of this approach, there were no clear sequences of re-
quired steps and the user had to figure out the right
construction steps on his own (see Figure 3). Addi-
tionally, those views were not optimized for usability.
Views were not consistent and lacked simplicity and
clarity. The principles of reducing memory load and
offer informative feedback are also addressed in the
floor plan view described in the next section.
By redesigning the views according to the ”Eight
Golden Rules of Interface Design” by (Shneiderman,
2003) and adding a clear creation sequence of steps,
usability of the tool should be clearly improved. We
focused on principles of consistency within the views
and easy reversal of actions. To approach the princi-
ples of designing dialog to yield closure and to reduce
short-term memory load, we used the wizard design
WINSYS2013-InternationalConferenceonWirelessInformationNetworksandSystems
268
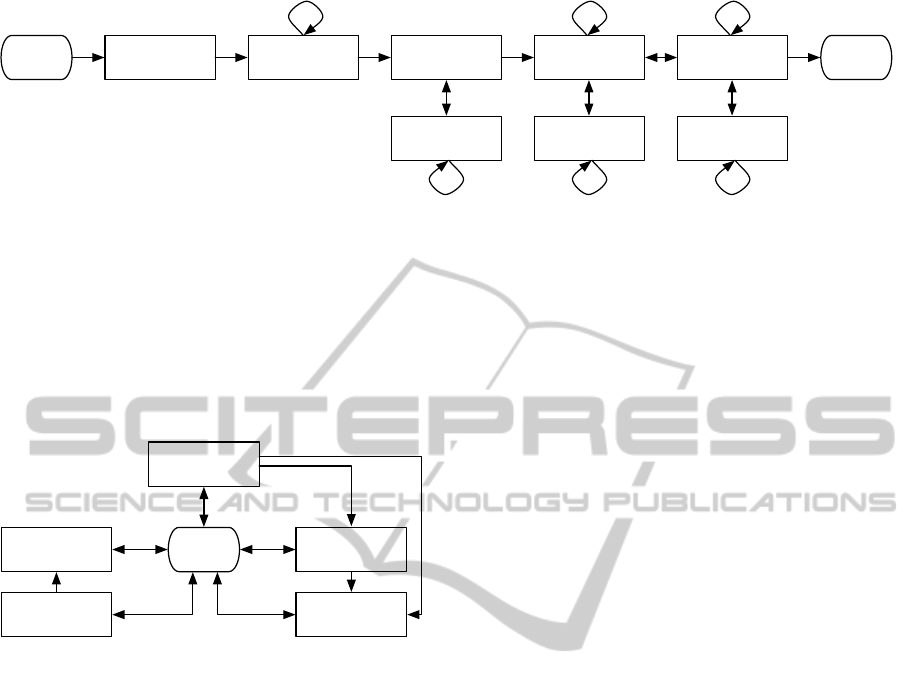
Start
Enter
Address
Stop
Create
Area
Create
Waypoint/POI
Create
Waypoint/POI
Create
Segment
Create
Landmark
Create
Landmark
Create
Landmark
Figure 2: Logical building graph construction steps (sequence for wizard design pattern).
pattern for graph creation steps (Tidwell, 2010). User
is locked in a certain sequence of views and therefore
is not able to do wrong actions, e.g, user has first to
create two waypoints to be able to create one segment
(see Figure 2). He also does not need to remember
all prior actions and is requested only to fill out infor-
mation that is required as a logical consequence to his
actions.
Start
Enter
Address
Create
Area
Create
Waypoint/POI
Create
Segment
Create
Landmark
Figure 3: Initial building graph construction.
5.3 Floor Plan View
To achieve a more usable approach for building graph
creation it was our aim to provide users with a famil-
iar presentation. While a menu-based view is simple
to implement, it requires a huge cognitive overhead
to imagine and remember the created building graph.
The depiction of that structure is abstract and user is
required to build a mental map of the building in his
head and synchronize it to the actual graph. Without
visual feedback and a lot of experience it is a very
difficult task to accomplish.
We decided to include a view into the tool which
displays the ground plan of the target building. In
terms of navigation, users are more familiar with the
concept of a visual 2-dimensional presentation of the
terrain from above known from most outdoor naviga-
tion systems and indoor plans. We differ between two
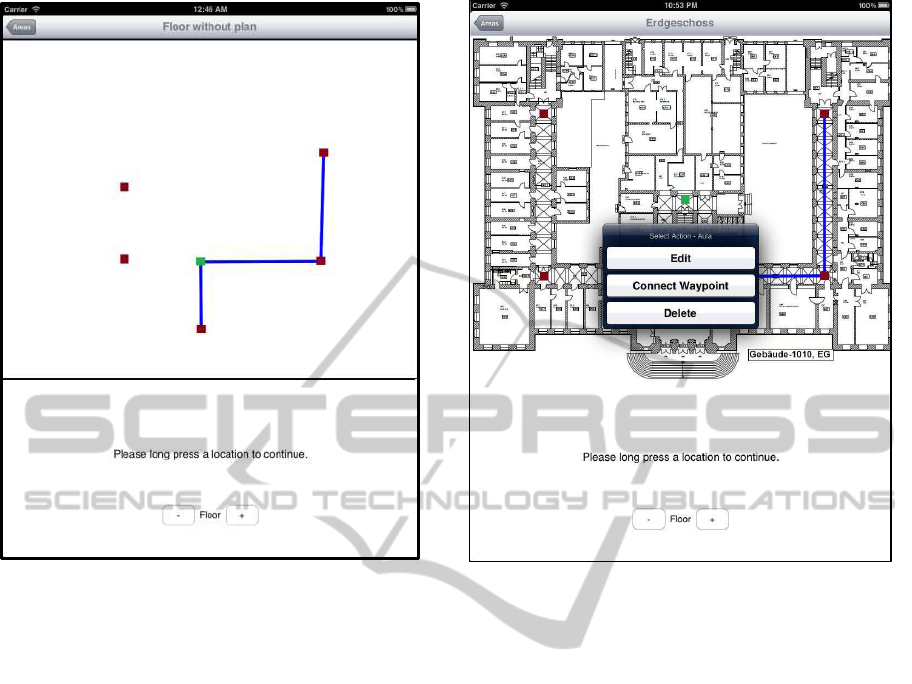
kind of situations: either a floor plan does or does not
exist for the target building. In case of the missing
plan, we use a blank canvas, i.e., white background,
to let users build the graph as a visualization of their
mental maps (see Figure 4(a)). This way users may
express their view of the building and create a clear
structure. They may freely place waypoints in the
building and combine these with segments of a de-
fined length. The length of the segments is estimated
by the creating user. These distances are only guide
values for the navigating user and thus do not need
to be precise. They serve to represent distance differ-
ences among the sections within a route. Finally, on
the one hand, by using this view, we are able to help
users while creating a building graph with a perma-
nent visual feedback. On the other hand, this view
helps during the navigation to visualize walking di-
rections and route length with reference to the passed
segments. However, in this view, we are missing the
constraining features of a building plan. Hallways and
clear separated rooms often help users orient them-
selves.
In case of an existing floor plan, users are able to
create an even more informative and hence support-
ing building plan. Here, users are able to add, delete,
and update graph elements like waypoints and seg-
ments directly on top of the floor plan image (see Fig-
ure 4(b)). Therefore, the building graph structure was
extended for each visible element (i.e., waypoints and
segments) to include reference points on the image to
map the components to the visualization. Using these
coordinates, we are able to create a navigation view
that displays the entire route through the building (see
Figure 5). Natural constrains of the building support
the navigation. For this reason the floor plan view
with a real plan of the building is always preferable to
the black canvas approach.
Both navigation views were extended to support
users. Calculated route within the building is marked
blue, the passed route is grayed out, users current
location is marked green and the target POI is de-
picted as a checked square. Using this clear color-
ing schema, users are always informed about their
progress.
6 EVALUATION
In this section we discuss the evaluation of the imple-
ToolSupportforBuildingGraphConstruction
269
>(,),+--9?$ )"#$ 2+6#$ '#(*#'&$ )"#$ ,0+6#$ &#-#7)#*$ ,($ )"#$ ;'#+$ 37'##($ ).$ +$ -+'6#$
A,6%'#$B8BD$;'#+$<,)".%)$2-+($
(a) Graph construction on blank canvas
#
(b) Graph construction on floor plan
Figure 4: Graph construction in floor plan views.
mented tool for building graph construction. Every
participant had to complete two test routes within a
building. On one test route he used the improved tool,
on the other one he built a proper data structure for
four areas in the building with the initial version of the
software. Afterwards, the different approaches were
compared based on time measurements and user feed-
back.
6.1 Test Procedure and Setup
Description
The depicted navigation system was implemented in
Objective-C on the Cocoa-Framework. During the
test procedure the software ran on an Apple iPad 2
Wi-Fi with iOS 5.0.1.
The main building of RWTH Aachen University
was chosen to conduct the user tests. This building
has a complex architecture. It is rambling and con-
sists of three upper floors, two basement floors, differ-
ent kinds of stairways, and elevators. Although many
university departments are located in the main build-
ing, most students are not acquainted with this build-
ing, thus, it can be assumed that the test results are
not distorted. We used very detailed floor plans of
the building as the background for the floor plan view
(see 5).
The test group consisted of 2 female and 10 male
students aged between 19 and 30. Self-evaluated
technical skills of this group were well-distributed
from poor to excellent. The users were given a ver-
bal briefing before the first test run. Two test routes of
the same length and complexity were selected for the
study. The participants were asked to create building
graphs for each of those two routes once with the ini-
tial tool and once with the altered version from this
work. The resulting graphs consisted of four con-
nected waypoints with appropriate landmarks and in-
cluded one change of floor. Users were instructed
where to mark a waypoint but had to estimate the dis-
tance of each connecting segment between two points
in the resulting graph.
The main part of the evaluation bases on an on-
line questionnaire. Users could evaluate both tool ver-
sions, write comments, and rate the usability of the
system. The scale for the ratings ranged between 1
for poor results and 6 for excellent outcomes.
6.2 Outcomes
We observed that using our improved approach we
could lower graph creation time significantly. The
WINSYS2013-InternationalConferenceonWirelessInformationNetworksandSystems
270
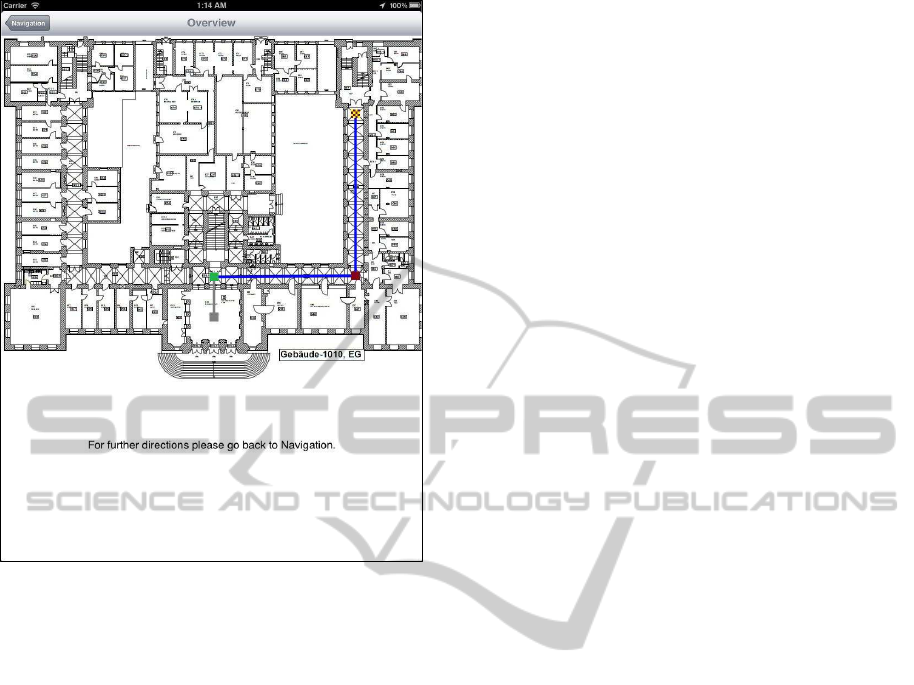
#
!"# ()**+',-&./&0' 92%/&0'#%2 :' %&92"6"6#'02%/'%&0'260'0& .-&./&%&0)
Figure 5: Route navigation.
prior approach was very struggling for the user and
required a lot of additional instructions. Views and
the proper sequence of creation steps were not clear
and required a massive cognitive load from the user.
After each action he had to reorient himself and re-
think his next steps. Introducing the wizard approach
for the views, we were able to create a clear step-by-
step sequence of views. Users always knew the next
required action and were able to fulfill the task more
easily and more efficiently.
However, most users instantly switched to the
floor plan view (see Section 5.3). Visual feedback and
the overview of the created building graph must not
be ignored and were highly preferred by the users.
Views from step-by-step instructions required a cer-
tain abstraction level from users. Areas in building
had to be mapped to textual descriptions and the cog-
nitive map. This approach was often confusing and
required experience with the tool and good memory.
The floor plan view solves this problem by mapping
the abstract structure of the building graph to an im-
age of the building plan.
The questionnaire among test participants con-
firms that observation. Even though users declared
that the visual floor plan is not especially helpful to
find requested locations (average rating 2,83), it still
seems to support the users subconsciously. Therefore,
our test group rated the usability of the improved tool
(average rating 4,42) significantly better than from the
initial version (average rating 2,08). Supporting this
outcome, all 12 users were aware of the improvement
of the modified tool and most users were satisfies with
this version (average rating 4,33). Consequently, all
12 users stated that they prefer the altered tool than
the initial version of the software.
7 CONCLUSIONS & FUTURE
WORK
Building graph is the central structure of landmark-
based navigation and thus requires to be flexible, re-
liable and precise to guarantee proper indoor naviga-
tion. In this work, we introduced an improved tool
to construct such a graph in a user friendly and con-
venient way. Existing views were improved and rear-
ranged by using well-established design patterns and
principles. An additional view, the floor plan view,
was introduced. Users are now able to map the ab-
stract structure of the building graph to a ground plan
of the building. Thus, they have a permanent visual
feedback over the progress and all created graph com-
ponents.
The evaluation revealed that the modified version
of the graph construction tool is clearly an improve-
ment over the prior version. User study participants
observed a noticeable enhancement of the approach
and clearly stated to prefer the new version of the tool.
However, further work is required to improve and
evaluate graph construction as well as the entire en-
hanced navigation approach. First, floor plan view
with a blank canvas needs a proper evaluation. While
creating a building graph on a depiction of the build-
ing works properly, construction of this data structure
on a white backgroundrequires a more abstract proce-
dure. Users must project their mental map of the sur-
roundings into a visual representation. An evaluation
needs to reveal user interaction with this approach.
Introduced floor plan view needs an additional
evaluation. We will test usability and proper pre-
sentation for the navigation application. One intro-
duced idea was to include the building graph visual-
ization as the background for the step-by-step naviga-
tion instructions. This approach would combine the
overview of the graph with the detailed descriptions
of the route. User would not need to switch between
views and therefore need less actions for navigation.
However, we need to evaluate whether the added in-
formation is required and does not excess the accept-
able amount of depicted information.
ToolSupportforBuildingGraphConstruction
271

REFERENCES
Baras, K., Moreira, A., and Meneses, F. (2010). Navigation
Based on Symbolic Space Models. In International
Conference on Indoor Positioning and Indoor Navi-
gation (IPIN 2010).
Chan, E., Baciu, G., and Mak, S. (2009). Using wi-
fi signal strength to localize in wireless sensor net-
works. In Communications and Mobile Computing,
2009. CMC ’09. WRI International Conference on,
volume 1, pages 538 –542.
Chowaw-Liebman, O., Christoph, U., Krempels, K.-H., and
Terwelp, C. (2010). Evaluation of an indoor naviga-
tion approach based on approximate positions. In In-
ternational Conference on Wireless Information Net-
works and Systems (WINSYS 2010), pages 195–201.
Cutting, J. E. and Vishton, P. M. (1995). Perceiving lay-
out and knowing distances: the integration, relative
potency and contextual use of different information
about depth. In Handbook of perception and Cog-
nition., volume 5: Perception of Space and Motion,
pages 69–117.
Downs, R. M. and Stea, D. (1982). Kognitive Karten: Die
Welt in unseren K¨opfen. UTB f¨ur Wissenschaft.
Heiniz, P., Krempels, K.-H., Terwelp, C., and W¨uller, S.
(2012). Landmark-based navigation in complex build-
ings. In International Conference on Indoor Position-
ing and Indoor Navigation (IPIN 2012).
Jensen, C. S., Lu, H., and Yang, B. (2009). Graph Model
Based Indoor Tracking. Tenth International Confer-
ence on Mobile Data Management: Systems, Services
and Middleware (MDM 2009), pages 122–131.
Krempels, K.-H., Patzak, S., St¨ulpnagel, J., and Terwelp,
C. (2011). Device whispering: An approach for
directory-less wlan positioning. In e-Business and
Telecommunications, Communications in Computer
and Information Science, pages 346–357. Springer
Berlin Heidelberg.
Shneiderman, B. (2003). Designing the User Interface.
Pearson Education.
Tidwell, J. (2010). Designing Interfaces. O’Reilly Media,
2nd edition edition.
WINSYS2013-InternationalConferenceonWirelessInformationNetworksandSystems
272
